. 2017 Jun 29;170(1):86-101.e16.
doi: 10.1016/j.cell.2017.06.017.

TERRA RNA Antagonizes ATRX and Protects Telomeres

Affiliations

TERRA RNA Antagonizes ATRX and Protects Telomeres

Hsueh-Ping Chu et al. Cell. .

Abstract

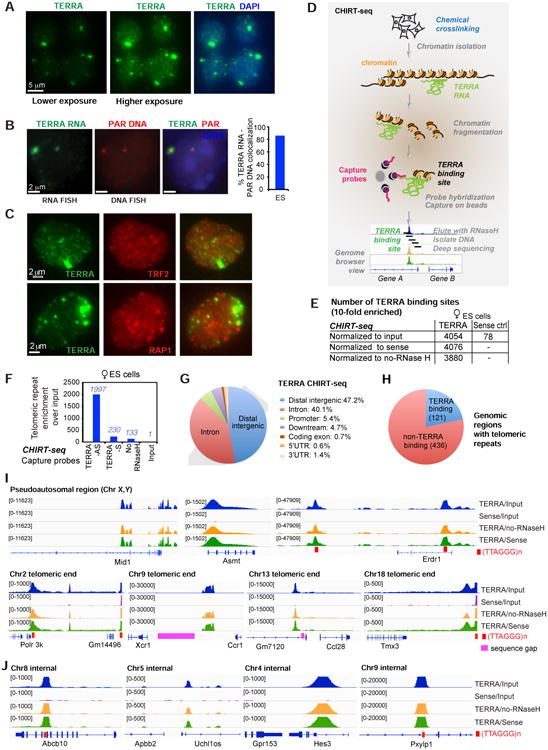
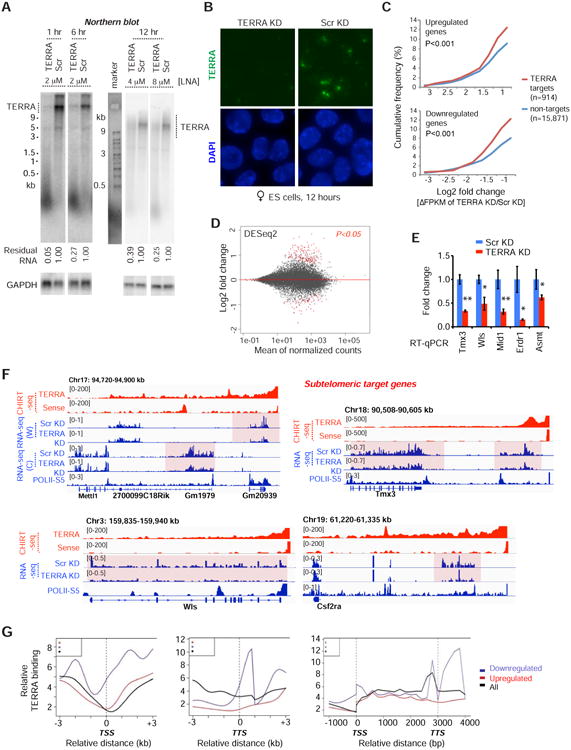
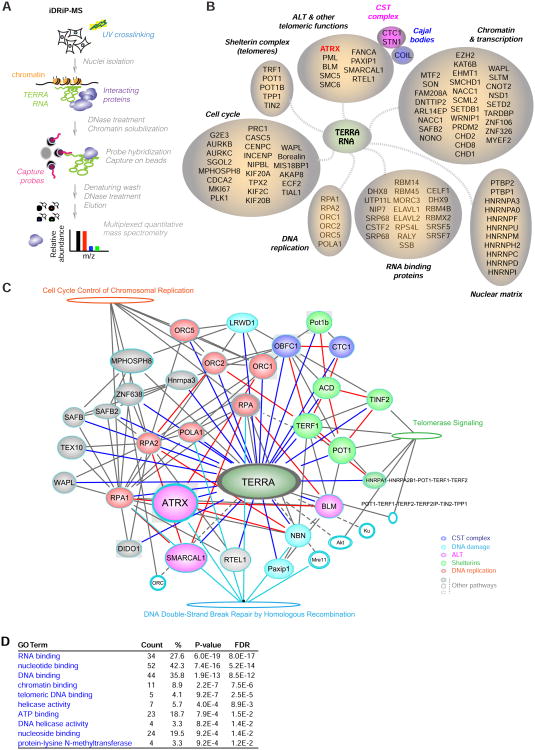
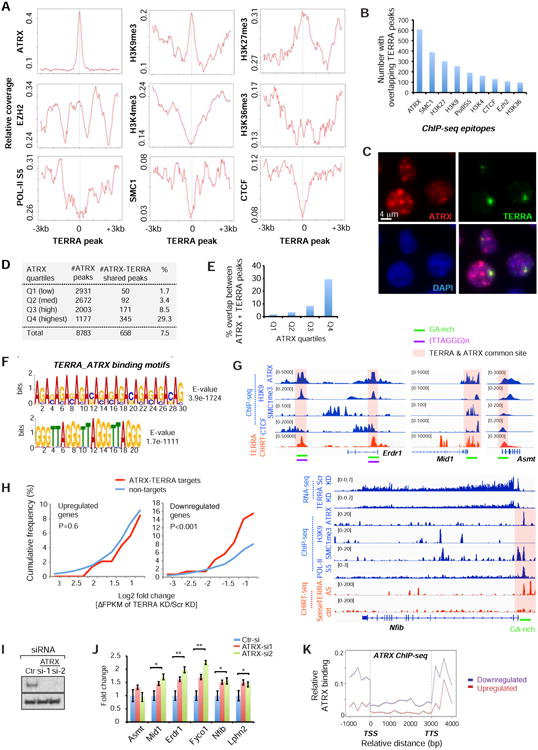
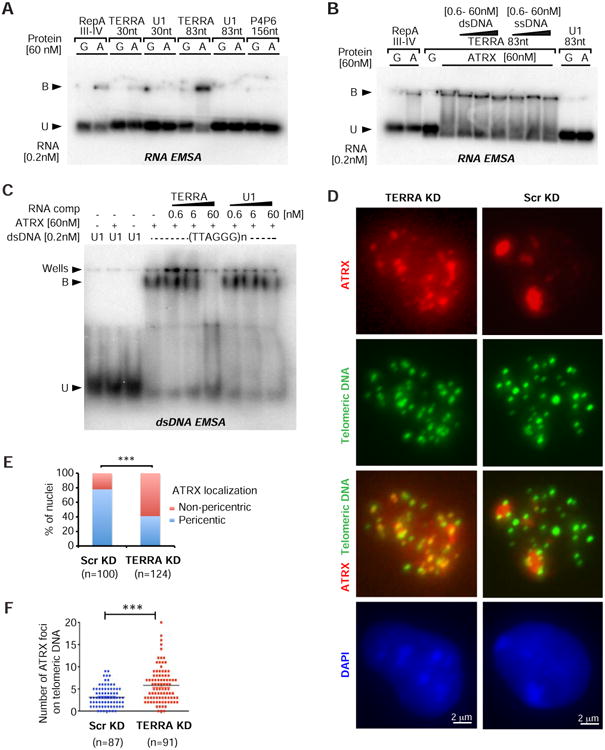
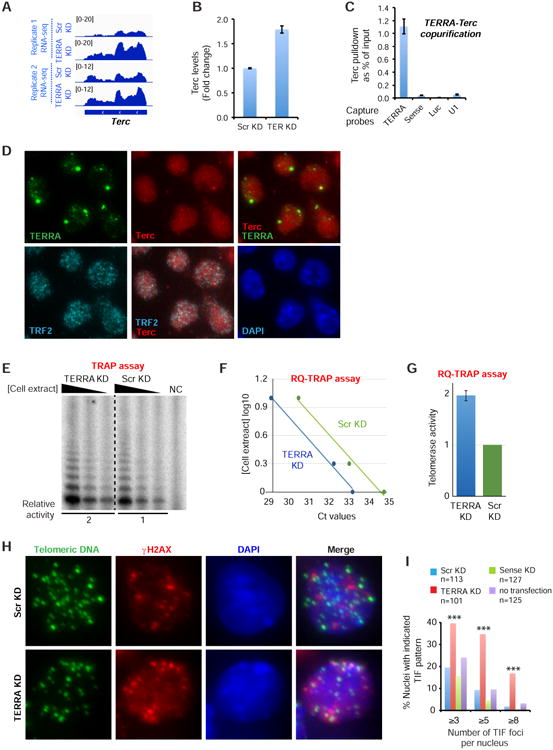
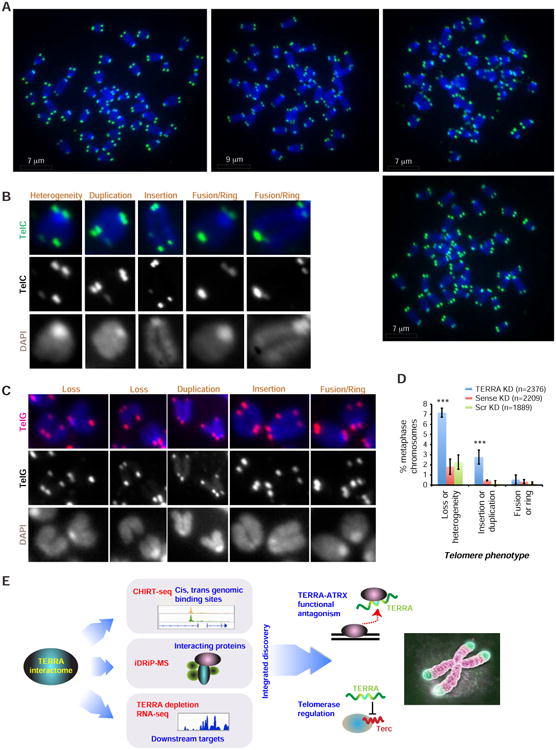
Through an integration of genomic and proteomic approaches to advance understanding of long noncoding RNAs, we investigate the function of the telomeric transcript, TERRA. By identifying thousands of TERRA target sites in the mouse genome, we demonstrate that TERRA can bind both in cis to telomeres and in trans to genic targets. We then define a large network of interacting proteins, including epigenetic factors, telomeric proteins, and the RNA helicase, ATRX. TERRA and ATRX share hundreds of target genes and are functionally antagonistic at these loci: whereas TERRA activates, ATRX represses gene expression. At telomeres, TERRA competes with telomeric DNA for ATRX binding, suppresses ATRX localization, and ensures telomeric stability. Depleting TERRA increases telomerase activity and induces telomeric pathologies, including formation of telomere-induced DNA damage foci and loss or duplication of telomeric sequences. We conclude that TERRA functions as an epigenomic modulator in trans and as an essential regulator of telomeres in cis.


Figures

Figure 1
Figure 1. CHIRT-seq analysis shows that TERRA RNA binds chromatin on a global scale and is not confined to telomeres
A. RNA FISH shows TERRA foci (green) at low and high exposures in mouse ES cells. DAPI detects nuclear DNA. B. TERRA prominent spots are associated with the ends of sex chromosomes. TERRA RNA FISH (green) followed by the DNA FISH using the probes (red) derived from the pseudoautosomal regions (PAR) of sex chromosomes. The percentage of TERRA RNA foci colocalized with PAR DNA is shown in the right panel. C. Partial colocalization of TERRA and telomeres. RNA immunoFISH of TERRA (green) and TRF2 (red, top) or RAP1 (red, bottom). Colocalization counts shown in Fig. S1A. D. Modified CHIRT protocol to capture TERRA binding sites in chromatin. E. CHIRT results: Number of significant TERRA peaks with 10-fold enrichment over background and the length greater than 1 kb in ES cells. F. TERRA CHIRT-seq showed enrichment for telomeric repeats DNA over input in female ES cells. Samples captured by TERRA-AS or TERRA-S. No-RNaseH for the TERRA-AS capture is also shown as a control. Raw read counts are normalized to spike-in control. G. CEAS analysis: Pie CHIRT shows relative representation of various genomic regions for TERRA binding sites. H. CEAS analysis: Pie chart of genomic regions containing telomeric repeats shows that only ∼21% of such regions are bound by TERRA RNA. I,J. Views of TERRA-binding sites within subtelomeric regions (I) and internal genes (J) of multiple chromosomes.
Figure 2
Figure 2. TERRA depletion results in dysregulation of gene expression at target sites
A. Northern blot analysis of TERRA RNA shows depletion by treatment with gapmer LNA at indicated time points and LNA concentrations in ES cells. Scr, scramble LNA control. GAPDH RNA is used as loading control and % remaining TERRA RNA is indicated. B. RNA FISH confirming TERRA depletion after 12 hours of LNA treatment. Photos taken with the same exposure. C. Cumulative frequency plots for up- and down-regulated genes, showing Log2 fold-changes (ΔFPKM) after TERRA KD for the 914 genes with or 15,871 genes without TERRA sites. P-values determined by 2-tailed Chi-square test with Yate's correction. D. MA Bland–Altman plot to visualize RNA-seq data transformed onto the M (log2 fold-change) and A (mean average) scale. Log2 fold change represents TERRA KD vs Scr KD. Red dots, genes with significant change (P-adjust<0.05) using DESeq2 analysis. E. RT-qPCR of sub-telomeric genes following TERRA KD. P-values (** <0.01; * <0.05) determined by the Student t-test. Error bars, S.D. F. RNA-seq analysis. Examples of downregulated subtelomeric genes following TERRA KD. All CHIRT data are normalized to input. For all RNA-seq tracks, only the relevant strand is shown, with exception of Chr17 subtelomeric end where both are shown: W, Watson strand; C, Crick strand. RNA-seq coverage was normalized to total mapped fragments. G. Average metasite (left, middle) and metagene (right) profiles for TERRA binding relative to the TSS, TTS, and gene body. Profiles shown for downregulated (blue), upregulated (red), and all (black) genes in TERRA KD.
Figure 3
Figure 3. iDRiP-mass spectrometry analysis reveals an extensive TERRA proteome
A. The iDRiP-MS approach to define the TERRA interactome. B. TERRA-interacting proteins subclassified into functional groups. C. Connectivity map for the TERRA interactome using IPA® software (QIAGEN). Solid lines, strong direct interactions. Dashed lines, no current evidence for direct interaction. Solid oval, TERRA interactors. Empty ovals, TERRA non-interactors. D. GO analysis identified enriched pathways by DAVID bioinformatics resources. P values determined by Fisher Exact test. Benjamini FDR shown.
Figure 4
Figure 4. TERRA and ATRX target a common set of genes and are functionally antagonistic
A. Metasite analysis: ChIP-seq coverage of indicated epitopes (y-axis) relative to the averaged genomic TERRA-binding site (x=0). B. Number of ChIP-seq enriched regions (of indicated epitopes) with an overlapping TERRA peak. C. Immuno-RNA FISH performed with anti-ATRX antibodies (red) and TERRA-specific probes (green) reveals colocalization of TERRA with a subset of ATRX domains. D. ATRX chromatin targets in ES cells (ChIP-seq) are divided into four quartiles on the basis of coverage densities (Q4 highest). The number of ATRX peaks and those shared with TERRA are shown, along with the % ATRX peaks shared with TERRA peaks. E. Percentage of ATRX peaks shared with TERRA is shown for each ATRX quartile. F. De novo motif analysis using MEME reveals two dominant motifs for TERRA-ATRX target sites. E-values indicate how well each occurrence matches motif. G. Genome browser shots of TERRA CHIRT-seq and ChIP-seq data for TERRA-ATRX target genes. RNA-seq shows downregulation of Nfib after TERRA depletion. H. TERRA depletion decreases expression of ATRX-TERRA target genes. Cumulative frequency plots of Log2 fold-changes (ΔFPKM) for upregulated (Log2>0.75) and downregulated (Log2<- 0.75) genes after TERRA KD. Profiles for shared ATRX-TERRA targets versus non-targets are graphed. P-values determined by two-tailed Chi-squared test. I. Western analysis of ATRX protein after ATRX knockdown (KD) by two gene-specific siRNAs. No protein is detectable after KD. J. ATRX depletion increases expression of ATRX-TERRA target genes. RT-qPCR assay shows fold changes in expression of indicated genes in ES cells after 48 h. ATRX siRNA knockdown. Results from several biological replicates. **, P<0.01; *, P<0.05 two-tailed student t-test. Error bars, S.D. K. Metagene analysis of ATRX binding. Profiles for genes that are upregulated (red) or downregulated (blue) after TERRA depletion are graphed separately.
Figure 5
Figure 5. TERRA competes with telomeric DNA for ATRX binding and regulates ATRX distribution
A. TERRA binds to ATRX in vitro. RNA EMSA with 0.2 nM RNA probes from indicated transcripts (top) and 60nM GST (G, control) or ATRX (A) protein. Bound probe (shifted), B. Unbound, U. RepA derived form Xist RNA as a positive control for ATRX binding. U1 RNA and P4P6 are negative controls. B. Competition assay: TERRA RNA shifted by ATRX cannot be competed away by increasing concentrations (0.6, 6, 60nM) of dsDNA (80bp) or ssDNA (80nt) of corresponding TERRA sequence (83nt). RNA EMSA as described in (A). C. TERRA RNA competes away the telomeric dsDNA shifted by ATRX. EMSA with double-stranded U1 or (TTAGGG)n telomeric sequence (80bp), in the presence of TERRA or U1 RNA competitor (comp), as indicated. D. TERRA depletion (6hr knockdown) causes ATRX dispersal from pericentric heterochromatin and relocalization to telomeres in ES cells. Immuno-DNA-FISH staining for ATRX and telomeric DNA reveals large ATRX foci (red) on pericentric heterochromatin (dense DAPI staining) in control cells. TERRA depletion cells show dispersed ATRX signals that coincide with telomeric DNA (green). Asterisks are ATRX foci at pericentric heterochromatin. Arrowheads are ATRX foci at telomeres. E. The nucleus with intensive ATRX foci on pericentric chromatin was counted in panel (D). P value (***<0.001) was determined by Fisher exact test. N, sample size. F. Dot plot representative of two biological replicates shows the number of ATRX foci on telomeric DNA counted in each nucleus in panel (D). P value (***<0.001) was determined by student's t-test. N, sample size.
Figure 6
Figure 6. TERRA associates with Terc and inhibits telomerase activity in ES cells
A. RNA-seq of two biological replicates shows that Terc is upregulated after TERRA knockdown for 12 hours in ES cells. B. RT-qPCR assay confirms that telomerase RNA is upregulated after TERRA knockdown for 12 hours in ES cells. Error bars, S.D. C. TERRA is associated with Terc in vivo. RT-qPCR for Terc after TERRA capture from UV-cross-linked cell extracts. Control probes for RNA capture: sense, luciferase and U1. Error bars, S.D. D. RNA immunoFISH shows that 57% of Terc RNA localized with TERRA RNA (n=116). Terc also partially colocalized with TRF2 protein, which identifies all telomeric ends. E. Representative TRAP assay validating the increase in telomerase activity upon TERRA knockdown. Three dilutions of the cellular extract are shown. Relative telomerase activity was calculated from the three dilutions. NC: negative control lacking cell extract. An equivalent amount of total cellular protein was used for each sample. F. Linear regression of Ct values and cell extract concentration is shown. Each value represents the average from two biological replicates. G. Relative telomerase activity upon TERRA knockdown (8 hours) determined by RQ-TRAP in ES cells. Values were calculated from two independent biological replicates and three dilutions of each extract shown in (E). S.E. is indicated (n=6). Values are normalized to total cellular protein. H. Immuno-DNA FISH performed with anti-γH2AX antibodies (red) and telomeric DNA probes (green) shows increased TIF formation in ES cells after TERRA depletion. Arrowheads, TIFs. N, sample size. I. Bar graph showing the number of TIFs with indicated pattern in ES cells following Scr, Sense or TERRA LNA KD. P values (***<0.001) determined by Fisher Exact test comparing the numbers of nuclei with ≥3, ≥5, and ≥8 TIFs between Scr KD and TERRA KD. n, sample size.
Figure 7
Figure 7. TERRA maintains telomere integrity in ES cells
A. DNA FISH analysis using telomeric repeat probes of ES cell metaphase spreads. Telomeric DNA, green. Metaphase chromosomes, blue. A single cell is shown in each panel. ES cells were harvested after 24-hr knockdown with TERRA LNA versus control (Scr and sense) LNAs. Arrows, loss of telomeric cap on one (heterogeneous) or both sister chromatids. Asterisks, insertion or duplication. R, ring or fused telomeres. B. Magnified examples of each aberrant telomere phenotype. DNA FISH performed using C-rich telomeric PNA probes (TelC). Black and white images shown for the TelC and DAPI signals are merged in the color image. C. Magnified examples of each aberrant telomere phenotype. DNA FISH performed using G-rich telomeric PNA probes (TelG). Black and white images shown for the TelG and DAPI signals are merged in the color image. D. Quantitation of each telomeric pathology. Two biological replicates of each knockdown were averaged. Error bars are S.D. ***, P< 0.001, compared to Scr KD. P values determined by twotailed Chi-square analysis. Number of counted chromosomes is indicated. E. Summary: The TERRA interactome revealed by combining CHIRT, iDRiP, and LNA-mediated knockdown enabled determination of TERRA function. TERRA plays a critical role in telomere function by antagonizing ATRX, controlling telomerase activity, and maintaining telomeric integrity. Chromosome image adapted from http://med.stanford.edu/content/dam/smnews/images/2015/01/telomeres.jpg.

Comment in

References

    1. Anders S, Pyl PT, Huber W. HTSeq--a Python framework to work with high-throughput sequencing data. Bioinformatics. 2015;31:166–169. - PMC - PubMed
    1. Azzalin CM, Lingner J. Telomeres: the silence is broken. Cell Cycle. 2008;7:1161–1165. - PubMed
    1. Azzalin CM, Lingner J. Telomere functions grounding on TERRA firma. Trends Cell Biol. 2015;25:29–36. - PubMed
    1. Azzalin CM, Reichenbach P, Khoriauli L, Giulotto E, Lingner J. Telomeric Repeat Containing RNA and RNA Surveillance Factors at Mammalian Chromosome Ends. Science. 2007;318:798–801. - PubMed
    1. Balk B, Maicher A, Dees M, Klermund J, Luke-Glaser S, Bender K, Luke B. Telomeric RNA-DNA hybrids affect telomere-length dynamics and senescence. Nat Struct Mol Biol. 2013;20:1199–1205. - PubMed