. 2017 Aug 7;214(8):2243-2255.
doi: 10.1084/jem.20161950. Epub 2017 Jun 30.

Predicting the response to CTLA-4 blockade by longitudinal noninvasive monitoring of CD8 T cells

Affiliations

Predicting the response to CTLA-4 blockade by longitudinal noninvasive monitoring of CD8 T cells

Mohammad Rashidian et al. J Exp Med. .

Abstract

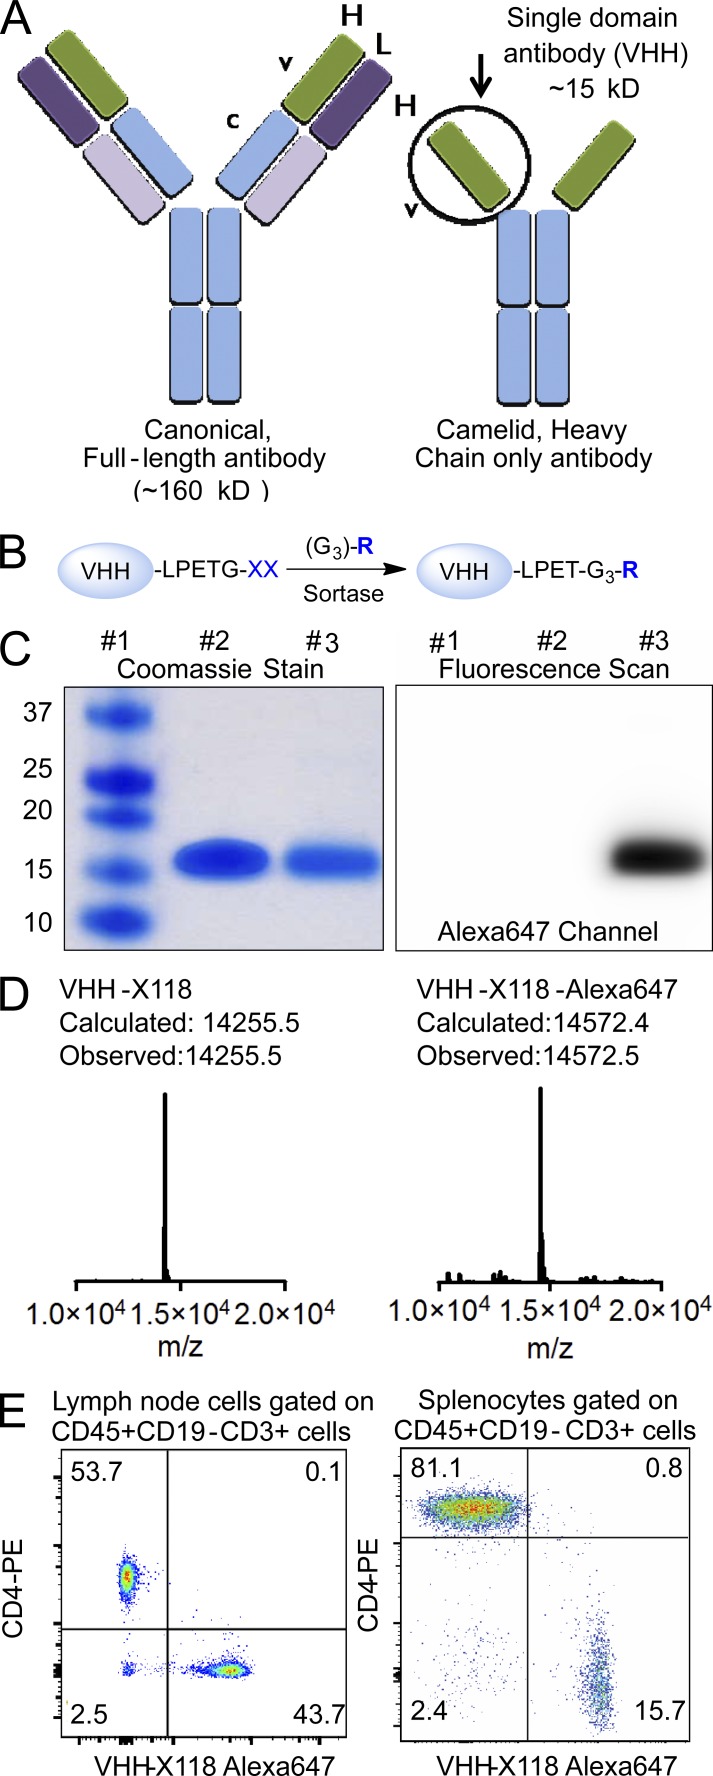
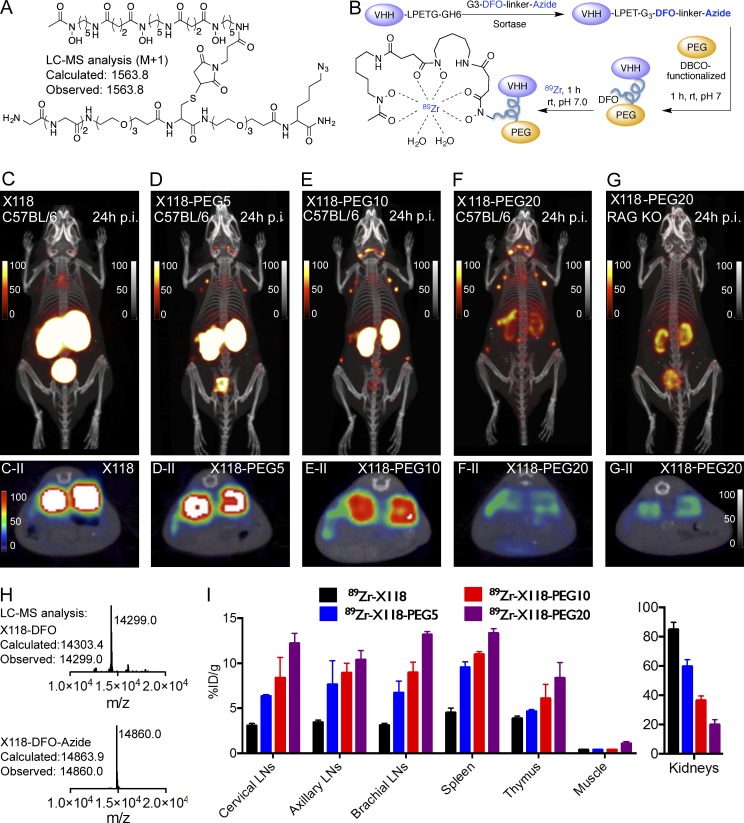
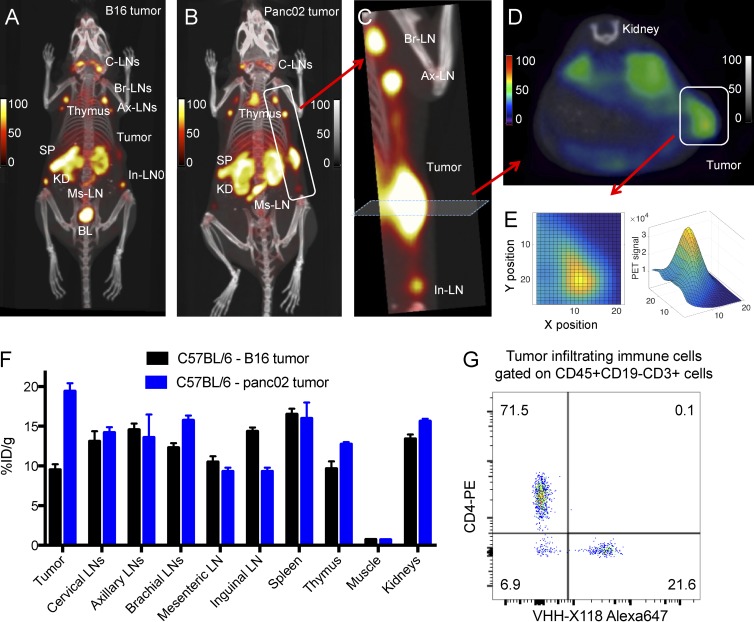
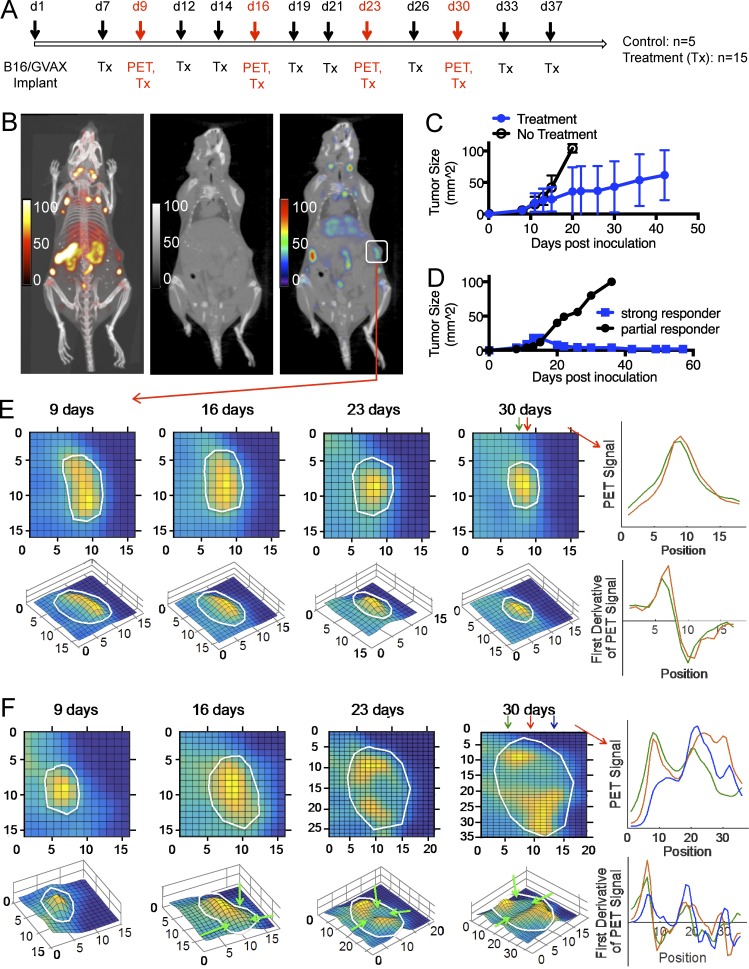
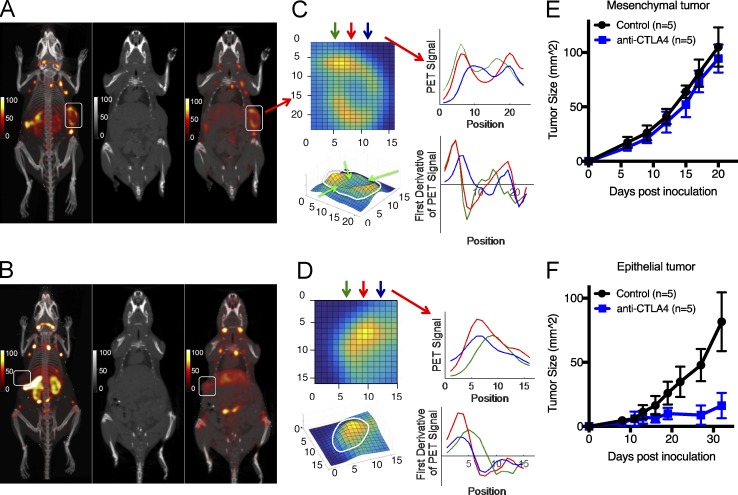
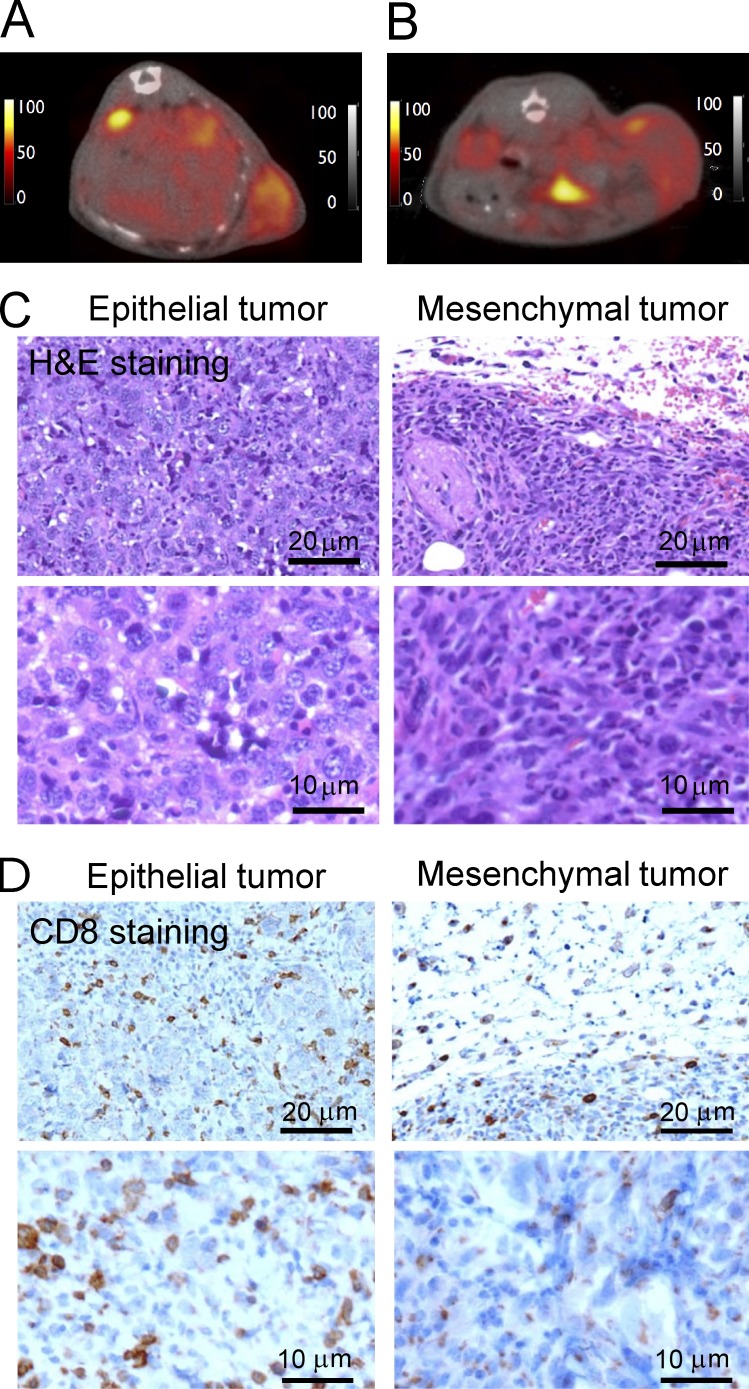
Immunotherapy using checkpoint-blocking antibodies against targets such as CTLA-4 and PD-1 can cure melanoma and non-small cell lung cancer in a subset of patients. The presence of CD8 T cells in the tumor correlates with improved survival. We show that immuno-positron emission tomography (immuno-PET) can visualize tumors by detecting infiltrating lymphocytes and, through longitudinal observation of individual animals, distinguish responding tumors from those that do not respond to therapy. We used 89Zr-labeled PEGylated single-domain antibody fragments (VHHs) specific for CD8 to track the presence of intratumoral CD8+ T cells in the immunotherapy-susceptible B16 melanoma model in response to checkpoint blockade. A 89Zr-labeled PEGylated anti-CD8 VHH detected thymus and secondary lymphoid structures as well as intratumoral CD8 T cells. Animals that responded to CTLA-4 therapy showed a homogeneous distribution of the anti-CD8 PET signal throughout the tumor, whereas more heterogeneous infiltration of CD8 T cells correlated with faster tumor growth and worse responses. To support the validity of these observations, we used two different transplantable breast cancer models, yielding results that conformed with predictions based on the antimelanoma response. It may thus be possible to use immuno-PET and monitor antitumor immune responses as a prognostic tool to predict patient responses to checkpoint therapies.


Figures

Figure 1.
Figure 1.
Characterization of CD8-specific single domain antibody. (A) Representation of a camelid heavy-chain-only antibody and a conventional IgG. The VHH portion is indicated. (B) Site-specific labeling of VHHs using sortase. (C and D) characterization of X118-VHH and Alexa647-labeled X118-VHH, where SDS-PAGE (C) and LC-MS (D) analysis confirming the identity of the final products (lane 1, marker; lane 2, VHH-X118; lane 3, VHH-X118-Alexa647). (E) FACS analysis of splenocytes and lymph nodes gated on CD45+CD19CD3+ cells confirming that X118-VHH stains CD8+ cells. Results are representative of three to four experiments with similar results.
Figure 2.
Figure 2.
89Zr-labeled PEGylated anti-CD8 VHH detects CD8 T cells. (A) Structure of the biorthogonal sortase substrate. The azide functionality allows installation of PEG groups, and the DFO chelator is used to install 89Zr for PET imaging. (B) Schematic representation of preparing PEGylated 89Zr-labeled VHHs for PET imaging. (C–G and C-II–G-II) PET-CT images of anti-CD8 89Zr-labeled X118-VHH with and without different-size PEG functionalities in wild-type C57BL/6 and RAG-KO mice (n = 3 for each experiment). Images were acquired 24 h p.i. of radiolabeled VHHs. (C-II–G-II, top) Whole-body maximum intensity projections. (C-II–G-II, bottom) Transverse PET-CT images of cross sections through the spleen, showing specific staining and a reduction in accumulation of label in the kidney with increasing PEG size. (H) Characterization of functionalized VHHs. LC-MS analysis confirms formation of X118-DFO and X118-DFO-azide. (I) Biodistribution of anti-CD8 X118-VHH with and without different-size PEGs 24 h p.i. (n = 3 for each cohort). Error bars represent standard deviation.
Figure 3.
Figure 3.
Anti-CD8 89Zr-labeled PEG20-X118-VHH detects lymphoid organs and tumor-infiltrating CD8+ lymphocytes. (A and B) PET-CT images of tumor-bearing mice (A, B16 tumor; B, Panc02 tumor) injected with 89Zr-PEGylated VHH (n = 3 for each experiment). (C) Enlarged view of the tumor and draining lymph nodes. (D) A cross-section of the tumor shows the intratumoral distribution of infiltrated CD8+ T cells. (E) Enlarged view 2D and 3D representation of the cross section in D shows CD8+ T cells deep inside the tumor. (F) Biodistribution of PET signals in different organs and in the tumors. Error bars represent standard deviation. (G) Flow cytometry analysis on the Panc02-infiltrating immune cells confirmed infiltration by CD8+ T cells (n = 3).
Figure 4.
Figure 4.
Dynamics of CD8 T cell response and characterization of response patterns to immunotherapy. (A) C57BL/6 mice were inoculated with B16 melanoma cells and GVAX simultaneously. Treatment with anti-CTLA4 (clone 9H10) started 1 wk after inoculation to produce a heterogeneous response. Mice received therapy and were subjected to PET imaging according to the schedule shown in scheme A. (B) PET-CT images of a B6 mouse, injected with 89Zr-PEG20-VHH X118, 9 d after inoculation of the tumor. (left) PET-CT maximum intensity projection of the mouse. (middle and right) A coronal cross section CT (middle) or PET-CT (right) image of the mouse. The images are taken through a cross section of the tumor. The box shows the tumor. (C) Mean growth of the tumor in the two cohorts, with or without therapy. Every mouse receiving therapy showed some level of response compared with the untreated cohort, albeit with significant heterogeneity, as evident from the standard deviations. Error bars represent standard deviation. (D) Comparison of the growth of tumors in two mice receiving therapy with a strong or a partial response. (E and F) for animals that received CTLA4 therapy, PET images of the tumors are shown. Tumors, as identified by CT, are delineated by the outline. The PET signals in the tumor are rendered as a heatmap. Below each image is the corresponding 3D graph, in which the z axis represents the strength of the PET signal (arbitrary units). On the right side of the PET images are shown PET signal intensities and their first derivatives (below each graph). Two (E) or three (F) different columns, as indicated with arrows, were picked, and graphs were drawn to show the local minima and maxima. The CD8 T cell signal was more homogenously distributed in mice with a strong response to CTLA4 treatment with no local minima throughout the tumor, whereas partial responders showed a more heterogeneous signal distribution with one or more local minima. Where relevant, areas with lower PET signals are indicated by arrows. The images show the dynamics of CD8 T cell throughout the tumors during 4 wk of imaging performed at 9, 16, 23, and 30 d after inoculation of the tumors. The images are representative of multiple experiments with similar results (Fig. S4; n = 15, P = 0.035).
Figure 5.
Figure 5.
Predicting the response of immunotherapy in two different breast cancer models. WT C57BL/6 mice were inoculated with one million breast cancer cells (mesenchymal PB3 cells in A or epithelial PB2 cells in B). 2 wk p.i., mice were imaged by PET/CT using anti-CD8 89Zr-PEG20-VHH X118. (A) PET-CT images of the mesenchymal tumor-bearing mouse (n = 3); (left) PET/CT maximum intensity projection; (middle and right) coronal CT (middle) and PET-CT (right) images taken through a cross section of the tumor. The box outlines the tumor. (B) PET-CT images of the epithelial PB2 tumor-bearing mice (n = 3). (left) PET-CT maximum intensity projection. (middle and right) Coronal CT (middle) and PET-CT (right) images taken through a cross section of the tumor. (C and D) PET images of the tumors are shown. The PET signals in the tumor are rendered as a heat map. Below each image is the corresponding 3D graph, in which the z axis represents the strength of the PET signal (arbitrary units). The CD8 T cell signal was more homogenously distributed in epithelial tumors, whereas mesenchymal tumors showed a more heterogeneous signal distribution. Where relevant, areas with lower PET signals are indicated by arrows. On the right are graphs that show three randomly chosen transects (arrows) across each of the tumors, plotting the intensity of the PET signal along that transect. The first derivative of this function is shown below each graph to record the presence of local maxima. (E and F) Mean tumor growth with or without receiving therapy. Mice were injected subcutaneously with one million cells (mesenchymal cells in E or epithelial cells in F), followed by 200 µg anti-CTLA4 therapy (clone 9H10) three times per week for 20 d. The epithelial tumors showed a strong response, whereas the mesenchymal tumors did not (n = 5 for each cohort). Error bars represent standard deviation.
Figure 6.
Figure 6.
Correlation of CD8 PET images with immunostaining and histology of tumor sections. Wild-type C57BL/6 mice were inoculated with one million breast cancer cells (epithelial PB2 cells in A or mesenchymal PB3 cells in B). Mice were imaged 2 wk after inoculation by PET/CT using anti-CD8 89Zr-PEG20-VHH X118. (A and B) A transverse PET-CT image taken through a cross section of the tumor in mice bearing an epithelial (A) or mesenchymal (B) tumor (n = 5 for each cohort; one representative animal shown). (C) Hematoxylin and eosin (H&E) staining of tumor samples. (D) Immunohistochemistry (CD8+ cells) of paraffin-embedded, formalin-fixed tumor sections shows homogeneous infiltration of CD8+ T cells into PB2 (epithelial tumor). For PB3 (mesenchymal tumor), CD8+ T cells remained mostly peripheral. Top and bottom panels are from the same sections at different magnifications. See supporting information in Fig. S5 for full-size immunohistology and H&E images.

References

    1. Baumeister S.H., Freeman G.J., Dranoff G., and Sharpe A.H.. 2016. Coinhibitory pathways in immunotherapy for cancer. Annu. Rev. Immunol. 34:539–573. 10.1146/annurev-immunol-032414-112049 - DOI - PubMed
    1. Chen I., Dorr B.M., and Liu D.R.. 2011. A general strategy for the evolution of bond-forming enzymes using yeast display. Proc. Natl. Acad. Sci. USA. 108:11399–11404. 10.1073/pnas.1101046108 - DOI - PMC - PubMed
    1. Curran M.A., Montalvo W., Yagita H., and Allison J.P.. 2010. PD-1 and CTLA-4 combination blockade expands infiltrating T cells and reduces regulatory T and myeloid cells within B16 melanoma tumors. Proc. Natl. Acad. Sci. USA. 107:4275–4280. 10.1073/pnas.0915174107 - DOI - PMC - PubMed
    1. D’Huyvetter M., Xavier C., Caveliers V., Lahoutte T., Muyldermans S., and Devoogdt N.. 2014. Radiolabeled nanobodies as theranostic tools in targeted radionuclide therapy of cancer. Expert Opin. Drug Deliv. 11:1939–1954. 10.1517/17425247.2014.941803 - DOI - PMC - PubMed
    1. Dougan M., and Dranoff G.. 2009. Immune therapy for cancer. Annu. Rev. Immunol. 27:83–117. 10.1146/annurev.immunol.021908.132544 - DOI - PubMed

Publication types

MeSH terms