. 2017 Aug 7;7(8):2439-2460.
doi: 10.1534/g3.117.040907.

Retrotransposons Are the Major Contributors to the Expansion of the Drosophila ananassae Muller F Element

Wilson Leung  1 Christopher D Shaffer  2 Elizabeth J Chen  2 Thomas J Quisenberry  2 Kevin Ko  2 John M Braverman  3 Thomas C Giarla  4 Nathan T Mortimer  5 Laura K Reed  6 Sheryl T Smith  7 Srebrenka Robic  8 Shannon R McCartha  8 Danielle R Perry  8 Lindsay M Prescod  8 Zenyth A Sheppard  8 Ken J Saville  9 Allison McClish  9 Emily A Morlock  9 Victoria R Sochor  9 Brittney Stanton  9 Isaac C Veysey-White  9 Dennis Revie  10 Luis A Jimenez  10 Jennifer J Palomino  10 Melissa D Patao  10 Shane M Patao  10 Edward T Himelblau  11 Jaclyn D Campbell  11 Alexandra L Hertz  11 Maddison F McEvilly  11 Allison R Wagner  11 James Youngblom  12 Baljit Bedi  12 Jeffery Bettincourt  12 Erin Duso  12 Maiye Her  12 William Hilton  12 Samantha House  12 Masud Karimi  12 Kevin Kumimoto  12 Rebekah Lee  12 Darryl Lopez  12 George Odisho  12 Ricky Prasad  12 Holly Lyn Robbins  12 Tanveer Sandhu  12 Tracy Selfridge  12 Kara Tsukashima  12 Hani Yosif  12 Nighat P Kokan  13 Latia Britt  13 Alycia Zoellner  13 Eric P Spana  14 Ben T Chlebina  14 Insun Chong  14 Harrison Friedman  14 Danny A Mammo  14 Chun L Ng  14 Vinayak S Nikam  14 Nicholas U Schwartz  14 Thomas Q Xu  14 Martin G Burg  15 Spencer M Batten  15 Lindsay M Corbeill  15 Erica Enoch  15 Jesse J Ensign  15 Mary E Franks  15 Breanna Haiker  15 Judith A Ingles  15 Lyndsay D Kirkland  15 Joshua M Lorenz-Guertin  15 Jordan Matthews  15 Cody M Mittig  15 Nicholaus Monsma  15 Katherine J Olson  15 Guillermo Perez-Aragon  15 Alen Ramic  15 Jordan R Ramirez  15 Christopher Scheiber  15 Patrick A Schneider  15 Devon E Schultz  15 Matthew Simon  15 Eric Spencer  15 Adam C Wernette  15 Maxine E Wykle  15 Elizabeth Zavala-Arellano  15 Mitchell J McDonald  15 Kristine Ostby  15 Peter Wendland  15 Justin R DiAngelo  16 Alexis M Ceasrine  16 Amanda H Cox  16 James E B Docherty  16 Robert M Gingras  16 Stephanie M Grieb  16 Michael J Pavia  16 Casey L Personius  16 Grzegorz L Polak  16 Dale L Beach  17 Heaven L Cerritos  17 Edward A Horansky  17 Karim A Sharif  18 Ryan Moran  18 Susan Parrish  19 Kirsten Bickford  19 Jennifer Bland  19 Juliana Broussard  19 Kerry Campbell  19 Katelynn E Deibel  19 Richard Forka  19 Monika C Lemke  19 Marlee B Nelson  19 Catherine O'Keeffe  19 S Mariel Ramey  19 Luke Schmidt  19 Paola Villegas  19 Christopher J Jones  20 Stephanie L Christ  20 Sami Mamari  20 Adam S Rinaldi  20 Ghazal Stity  20 Amy T Hark  21 Mark Scheuerman  21 S Catherine Silver Key  22 Briana D McRae  22 Adam S Haberman  23 Sam Asinof  23 Harriette Carrington  23 Kelly Drumm  23 Terrance Embry  23 Richard McGuire  23 Drew Miller-Foreman  23 Stella Rosen  23 Nadia Safa  23 Darrin Schultz  23 Matt Segal  23 Yakov Shevin  23 Petros Svoronos  23 Tam Vuong  23 Gary Skuse  24 Don W Paetkau  25 Rachael K Bridgman  25 Charlotte M Brown  25 Alicia R Carroll  25 Francesca M Gifford  25 Julie Beth Gillespie  25 Susan E Herman  25 Krystal L Holtcamp  25 Misha A Host  25 Gabrielle Hussey  25 Danielle M Kramer  25 Joan Q Lawrence  25 Madeline M Martin  25 Ellen N Niemiec  25 Ashleigh P O'Reilly  25 Olivia A Pahl  25 Guadalupe Quintana  25 Elizabeth A S Rettie  25 Torie L Richardson  25 Arianne E Rodriguez  25 Mona O Rodriguez  25 Laura Schiraldi  25 Joanna J Smith  25 Kelsey F Sugrue  25 Lindsey J Suriano  25 Kaitlyn E Takach  25 Arielle M Vasquez  25 Ximena Velez  25 Elizabeth J Villafuerte  25 Laura T Vives  25 Victoria R Zellmer  25 Jeanette Hauke  26 Charles R Hauser  27 Karolyn Barker  27 Laurie Cannon  27 Perouza Parsamian  27 Samantha Parsons  27 Zachariah Wichman  27 Christopher W Bazinet  28 Diana E Johnson  29 Abubakarr Bangura  29 Jordan A Black  29 Victoria Chevee  29 Sarah A Einsteen  29 Sarah K Hilton  29 Max Kollmer  29 Rahul Nadendla  29 Joyce Stamm  30 Antoinette E Fafara-Thompson  30 Amber M Gygi  30 Emmy E Ogawa  30 Matt Van Camp  30 Zuzana Kocsisova  30 Judith L Leatherman  31 Cassie M Modahl  31 Michael R Rubin  32 Susana S Apiz-Saab  32 Suzette M Arias-Mejias  32 Carlos F Carrion-Ortiz  32 Patricia N Claudio-Vazquez  32 Debbie M Espada-Green  32 Marium Feliciano-Camacho  32 Karina M Gonzalez-Bonilla  32 Mariela Taboas-Arroyo  32 Dorianmarie Vargas-Franco  32 Raquel Montañez-Gonzalez  32 Joseph Perez-Otero  32 Myrielis Rivera-Burgos  32 Francisco J Rivera-Rosario  32 Heather L Eisler  33 Jackie Alexander  33 Samatha K Begley  33 Deana Gabbard  33 Robert J Allen  2 Wint Yan Aung  2 William D Barshop  2 Amanda Boozalis  2 Vanessa P Chu  2 Jeremy S Davis  2 Ryan N Duggal  2 Robert Franklin  2 Katherine Gavinski  2 Heran Gebreyesus  2 Henry Z Gong  2 Rachel A Greenstein  2 Averill D Guo  2 Casey Hanson  2 Kaitlin E Homa  2 Simon C Hsu  2 Yi Huang  2 Lucy Huo  2 Sarah Jacobs  2 Sasha Jia  2 Kyle L Jung  2 Sarah Wai-Chee Kong  2 Matthew R Kroll  2 Brandon M Lee  2 Paul F Lee  2 Kevin M Levine  2 Amy S Li  2 Chengyu Liu  2 Max Mian Liu  2 Adam P Lousararian  2 Peter B Lowery  2 Allyson P Mallya  2 Joseph E Marcus  2 Patrick C Ng  2 Hien P Nguyen  2 Ruchik Patel  2 Hashini Precht  2 Suchita Rastogi  2 Jonathan M Sarezky  2 Adam Schefkind  2 Michael B Schultz  2 Delia Shen  2 Tara Skorupa  2 Nicholas C Spies  2 Gabriel Stancu  2 Hiu Man Vivian Tsang  2 Alice L Turski  2 Rohit Venkat  2 Leah E Waldman  2 Kaidi Wang  2 Tracy Wang  2 Jeffrey W Wei  2 Dennis Y Wu  2 David D Xiong  2 Jack Yu  2 Karen Zhou  2 Gerard P McNeil  34 Robert W Fernandez  34 Patrick Gomez Menzies  34 Tingting Gu  2 Jeremy Buhler  35 Elaine R Mardis  36 Sarah C R Elgin  2
Affiliations

Retrotransposons Are the Major Contributors to the Expansion of the Drosophila ananassae Muller F Element

Wilson Leung et al. G3 (Bethesda). .

Abstract

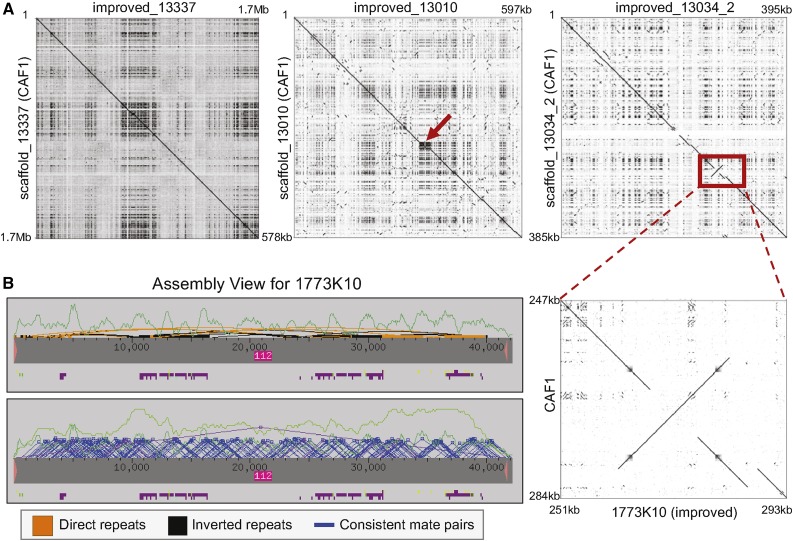
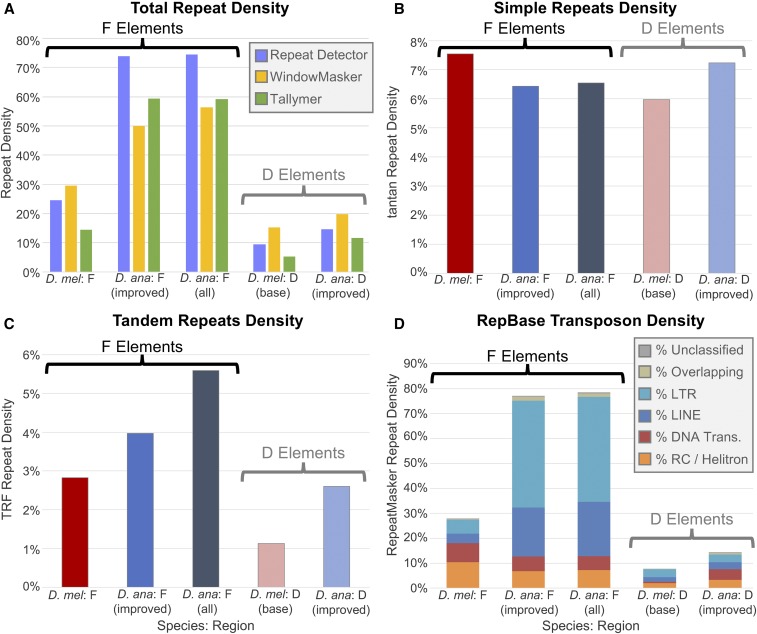
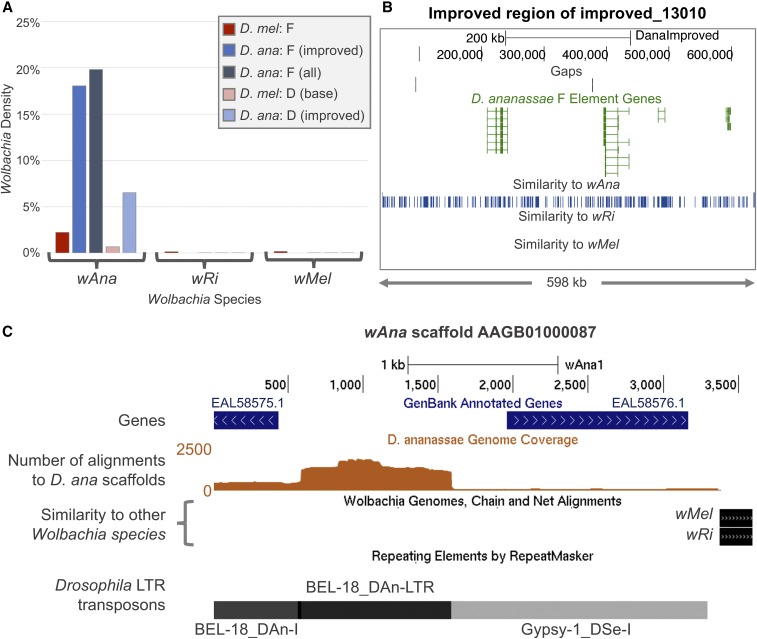
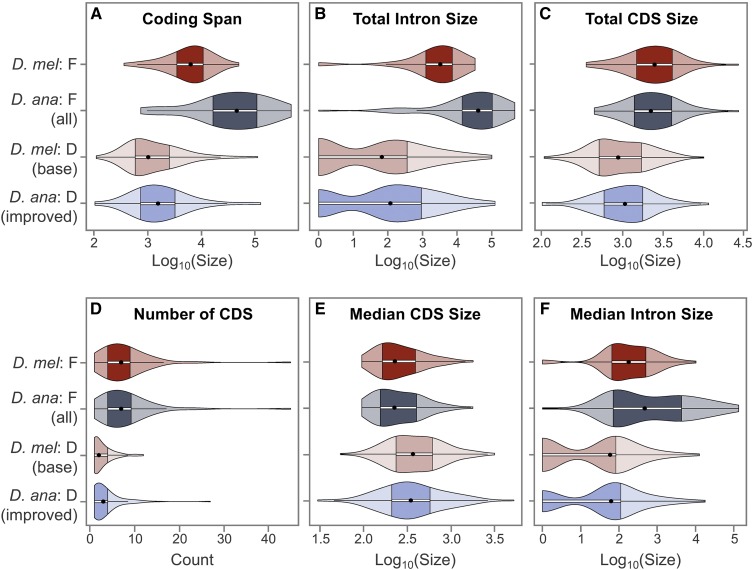
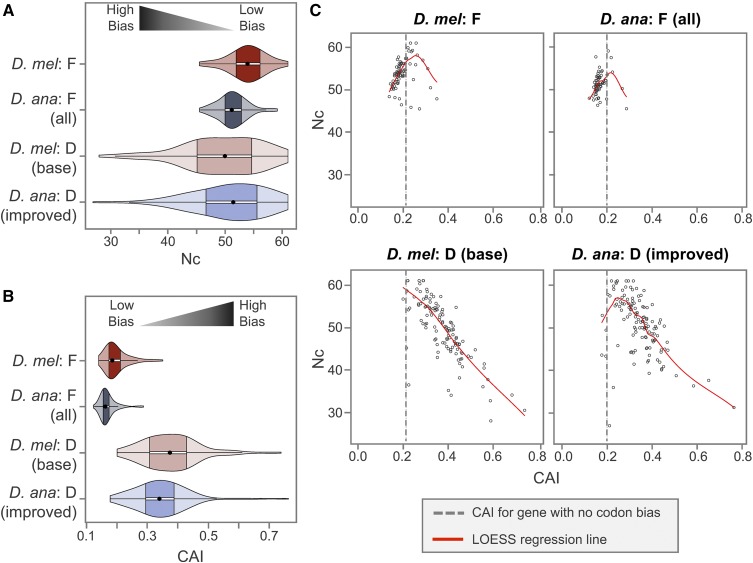
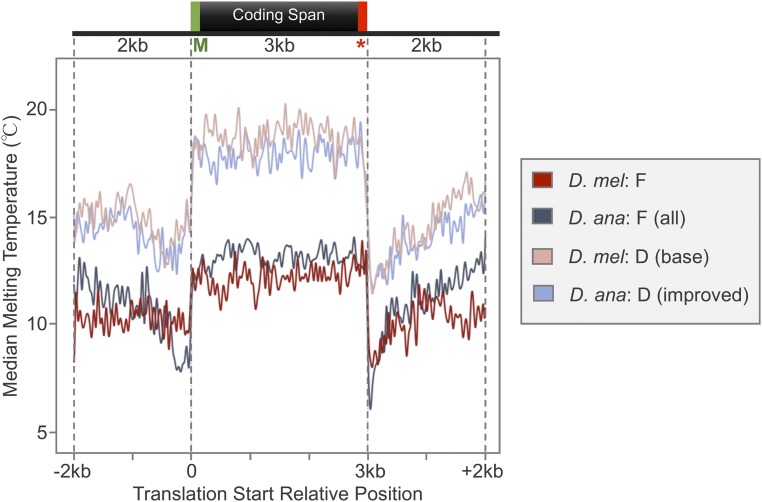
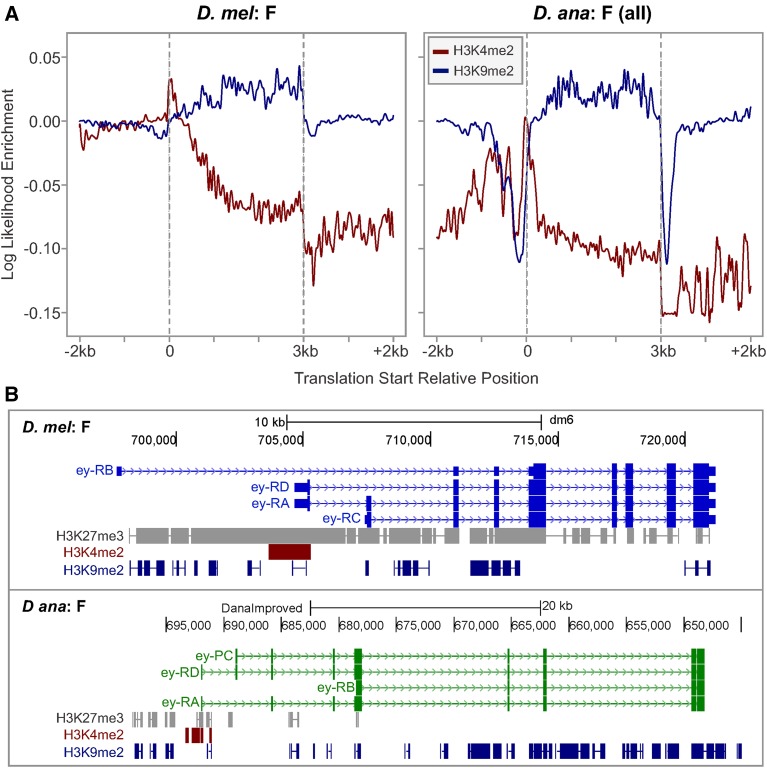
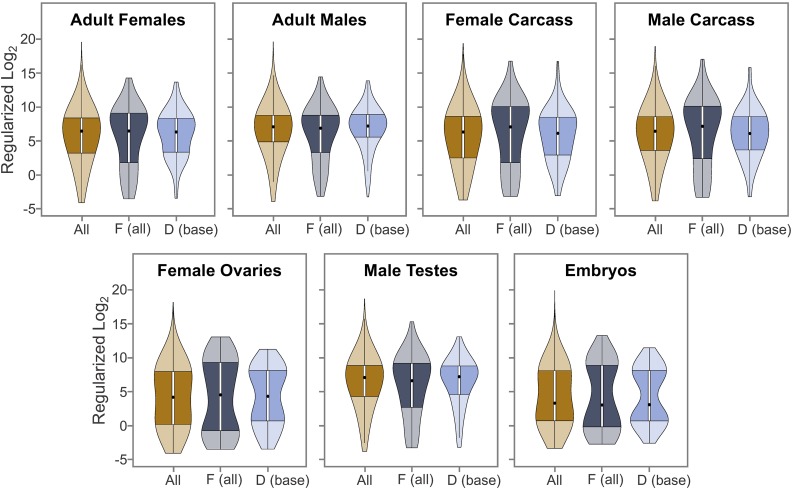
The discordance between genome size and the complexity of eukaryotes can partly be attributed to differences in repeat density. The Muller F element (∼5.2 Mb) is the smallest chromosome in Drosophila melanogaster, but it is substantially larger (>18.7 Mb) in D. ananassae To identify the major contributors to the expansion of the F element and to assess their impact, we improved the genome sequence and annotated the genes in a 1.4-Mb region of the D. ananassae F element, and a 1.7-Mb region from the D element for comparison. We find that transposons (particularly LTR and LINE retrotransposons) are major contributors to this expansion (78.6%), while Wolbachia sequences integrated into the D. ananassae genome are minor contributors (0.02%). Both D. melanogaster and D. ananassae F-element genes exhibit distinct characteristics compared to D-element genes (e.g., larger coding spans, larger introns, more coding exons, and lower codon bias), but these differences are exaggerated in D. ananassae Compared to D. melanogaster, the codon bias observed in D. ananassae F-element genes can primarily be attributed to mutational biases instead of selection. The 5' ends of F-element genes in both species are enriched in dimethylation of lysine 4 on histone 3 (H3K4me2), while the coding spans are enriched in H3K9me2. Despite differences in repeat density and gene characteristics, D. ananassae F-element genes show a similar range of expression levels compared to genes in euchromatic domains. This study improves our understanding of how transposons can affect genome size and how genes can function within highly repetitive domains.

Keywords: Drosophila; Wolbachia; genome size; heterochromatin; retrotransposons.


Figures

Figure 1
Figure 1
Results of the manual sequence improvement of the D. ananassae D and F elements. (A) Dot plot comparisons of the scaffolds in the original CAF1 assembly (y-axis) vs. the scaffolds in the improved assembly (x-axis). Dots within each dot plot denote regions of similarity between the CAF1 assembly and the improved assembly. The diagonal lines in the dot plots for the D-element scaffold improved_13337 (left) and the F-element scaffold improved_13010 (middle) show that the overall CAF1 assemblies for these regions are consistent with the corresponding assemblies following manual sequence improvement. However, the high density of dots in the middle of the dot plot for improved_13010 corresponds to a collapsed repeat within the CAF1 assembly (red ←). Manual sequence improvement also identified a major misassembly in the second improved region (improved_13034_2) within the F-element scaffold_13034 (right), where part of the scaffold was inverted compared to the final assembly (red box). The misassembled region is part of the fosmid 1773K10 (bottom inset). (B) The Consed Assembly View for the improved fosmid project 1773K10 shows that the misassembled region contains multiple tandem and inverted repeats. (Top) The gray bar within the Assembly View corresponds to the improved fosmid assembly, and the pink Δ’s denote the ends of the fosmid. The purple and green boxes underneath the gray box correspond to tags (e.g., repeats and comments), and the dark green line corresponds to the read depth. The orange and black boxes above the gray bar correspond to tandem and inverted repeats, respectively. These orange and black boxes indicate that the improved assembly contains multiple tandem and inverted repeats that are located adjacent to each other. (Bottom) The improved assembly for this fosmid was supported by consistent forward-reverse mate pairs (blue Δ’s) and by multiple restriction digests (Figure S2A in File S7).
Figure 2
Figure 2
Expansion of the D. ananassae F element can primarily be attributed to the high density of LTR and LINE retrotransposons. (A) Total repeat density estimates from de novo repeat finders (Red, WindowMasker, and Tallymer) show that the D. ananassae F element has higher repeat density than the D. melanogaster F element (56.4–74.5% vs. 14.4–29.5%). Both F elements show higher repeat density than the euchromatic reference regions from the base of the D elements in D. ananassae (11.6–19.8%) and in D. melanogaster (5.4–15.2%). The repeat densities of the improved D. ananassae F-element scaffolds [D. ana: F (improved)] are similar to the repeat densities for all D. ananassae F-element scaffolds [D. ana: F (all)]. (B) Results from the tantan analysis show that the five analysis regions from D. melanogaster and D. ananassae have similar simple repeat density (6.0–7.5%). (C) TRF analysis shows that D. ananassae has higher tandem repeats density than D. melanogaster on both the F (5.6 vs. 2.8%) and the D elements (2.6 vs. 1.1%). (D) RepeatMasker analysis using the Drosophila RepBase library shows that the F element has higher transposon density than the D element both in D. melanogaster (28.0 vs. 7.7%) and in D. ananassae (78.6 vs. 14.4%). There is a substantial increase in the density of LTR and LINE retrotransposons on the D. ananassae F element compared to the D. melanogaster F element (42.1 vs. 5.5% and 21.8 vs. 3.8%, respectively). The D. ananassae euchromatic reference region also shows higher transposon density than D. melanogaster, but most of the difference can be attributed to the density of DNA transposons (4.3 vs. 0.6%). The region of overlap between two repeat fragments is classified as “Overlapping” if the two repeats belong to different repeat classes.
Figure 3
Figure 3
The high density of “Wolbachia” sequences in the D. ananassae F element can be attributed to Drosophila transposons in the wAna assembly. (A) RepeatMasker analysis shows that 19.8% of the D. ananassae F element matches the genome assembly for wAna. By contrast, 0.02% of the D. ananassae F element matches the genome assemblies for wRi and wMel. Similarly, the D. ananassae D element and the D. melanogaster F and D elements show a substantially higher density of regions that exhibit sequence similarity to the wAna assembly (0.68–6.51%) than the wRi and wMel assemblies (0.00–0.18%). (B) Distribution of regions with matches to the wAna, wRi, and wMel assemblies in the manually improved region of the D. ananassae F-element scaffold improved_13010. The matches to the wAna assembly are distributed throughout the improved scaffold (blue boxes) but there are no matches to either the wRi or the wMel assemblies. (C) The portions of the 3.6-kb wAna scaffold AAGB01000087 (x-axis) with large numbers of alignments to D. ananassae scaffolds show similarity to Drosophila transposons. The portions of the wAna scaffolds that show similarity to D. ananassae scaffolds were extracted from the RepeatMasker output and collated into an alignment coverage track relative to the wAna assembly (brown graph). Whole-genome Chain and Net alignments show that only the last 216 bp of this wAna scaffold has sequence similarity to the wRi and wMel assemblies. RepeatMasker analysis using the Drosophila RepBase library shows that the first 3.4 kb of this wAna scaffold has sequence similarity to the internal and long terminal repeat portions of the BEL-18 LTR retrotransposon (BEL-18_DAn-I and BEL-18_DAn-LTR), as well the internal portion of the Gypsy-1 LTR retrotransposon from D. sechellia (Gypsy-1_DSe-I). Most of the alignments can be attributed to BEL-18_DAn-LTR, with a maximum of 1835 alignments between the wAna scaffold AAGB01000087 and the D. ananassae scaffolds.
Figure 4
Figure 4
F-element genes show distinct gene characteristics compared to D-element genes. Each violin plot is comprised of a box plot and a kernel density plot. The ● in each violin plot denotes the median and the darker region demarcates the IQR, which spans from the first (Q1) to the third (Q3) quartiles. The whiskers extending from the darker region spans from Q1 = −1.5 × IQR to Q3 = +1.5 × IQR; data points beyond the whiskers are classified as outliers. (A) D. ananassae F-element genes have larger coding spans (start codon to stop codon, including introns) than D. melanogaster F-element genes. (B) The D. ananassae F-element genes have larger coding spans because they have larger total intron sizes than D. melanogaster F-element genes. (C) F-element genes have larger total coding exon (CDS) sizes than D-element genes in both D. ananassae and D. melanogaster. (D) F-element genes have more CDS than D-element genes. (E) F-element genes have smaller median CDS size than D-element genes. (F) The median intron size for D. ananassae and D. melanogaster F-element genes shows a bimodal distribution; this distribution pattern indicates that the expansion of the coding spans of D. ananassae F-element genes compared to D. melanogaster F-element genes can be attributed to the substantial expansion of a subset of introns.
Figure 5
Figure 5
Codon bias in D. ananassae F-element genes can primarily be attributed to mutational biases instead of selection. (A) Violin plots of the Nc show that D. ananassae F-element genes exhibit stronger deviations from equal usage of synonymous codons (lower Nc) than D. melanogaster F-element genes. (B) Violin plots of the CAI show that D. ananassae F-element genes exhibit less optimal codon usage (lower CAI) than D. melanogaster F-element genes. F-element genes in both D. ananassae and D. melanogaster show less optimal codon usage (lower CAI) than D-element genes. (C) Scatterplot of Nc vs. CAI suggests that the codon bias in most D. ananassae and D. melanogaster F-element genes can be attributed to mutational bias instead of selection, as indicated by the placement of most of the genes in the portion of the LOESS regression line (red line) with a positive slope. By contrast, the codon bias in most D. ananassae and D. melanogaster D-element genes can be attributed to selection, as denoted by the LOESS regression line with a negative slope. The dotted line in each Nc vs. CAI scatterplot corresponds to the CAI value for a gene with equal codon usage relative to the species-specific reference gene sets constructed by the program scnRCA (0.200 for D. ananassae and 0.213 for D. melanogaster). Hence this species-specific threshold corresponds to the CAI value when the strengths of mutational bias and selection on codon bias are the same. A smaller percentage of F-element genes in D. ananassae (6/64; 9.4%) have CAI values above this species-specific CAI threshold compared to D. melanogaster (18/79; 22.8%).
Figure 6
Figure 6
Metagene analysis shows that the coding spans of F-element genes have lower median 9-bp Tm than the genes at the base of the D element. The Tm profiles were determined using a 9-bp sliding window with a step size of 1 bp. The metagene consists of the 2-kb region upstream and downstream of the coding span, with the length of the coding spans normalized to 3 kb. While the codons in D. ananassae F-element genes have lower GC content, D. ananassae F-element genes exhibit a Tm profile that is similar to the D. melanogaster F-element genes. The green “M” below the coding span denotes the Methionine at the translation start site, and the red star denotes the stop codon.
Figure 7
Figure 7
Histone modification profiles for D. ananassae and D. melanogaster F-element genes at the third instar larval stage of development. (A) Metagene analysis shows that the region surrounding the 5′ end of F-element genes is enriched in H3K4me2 while the body of the coding span is enriched in H3K9me2. The values in the y-axis within each metagene plot correspond to the log-likelihood ratio between each ChIP sample and input control (assuming a dynamic Poisson model) as determined by MACS2. (B) Differences in the H3K27me3 enrichment patterns for the D. melanogaster ey gene and its ortholog in D. ananassae. The entire coding span of the ey gene is enriched in H3K27me3 in D. melanogaster (top) (for the D. melanogaster gene models, the thick boxes denote the coding exons and the thin boxes denote the untranslated regions). By contrast, only the region surrounding the 5′ end of the ey ortholog in D. ananassae shows H3K27me3 enrichment. The 5′ ends of the A and D isoforms of ey shows enrichment of H3K4me2 and H3K27me3 in both D. melanogaster and D. ananassae. These bivalent domains suggest that these two isoforms of ey are poised for activation at the third instar larval stage of development in both species.
Figure 8
Figure 8
D. ananassae F-element genes show similar expression patterns compared to genes on other Muller elements. RNA-Seq reads from seven samples (adult females, adult males, female carcass, male carcass, female ovaries, male testes, and embryos) were mapped against the improved D. ananassae genome assembly and the read counts for the Gnomon gene predictions were tabulated by htseq-count. The read counts for the seven samples were normalized by library size and then transformed using Tikhonov/ridge regularization in the DESeq2 package to stabilize the variances among the samples. The violin plots compare the distributions of the regularized log2 expression values for the D. ananassae Gnomon gene predictions on all scaffolds (All), on the F-element scaffolds [F (all)], and on the base of the D element [D (base)] for these different developmental stages and tissues.

Comment in

References

    1. Adler, D., 2005 vioplot: Violin plot. Available at: https://CRAN.R-project.org/package=vioplot.
    1. Anders S., Pyl P. T., Huber W., 2015. HTSeq — a python framework to work with high-throughput sequencing data. Bioinformatics 31: 166–169. - PMC - PubMed
    1. Angov E., 2011. Codon usage: nature’s roadmap to expression and folding of proteins. Biotechnol. J. 6: 650–659. - PMC - PubMed
    1. Arguello J. R., Zhang Y., Kado T., Fan C., Zhao R., et al. , 2010. Recombination yet inefficient selection along the Drosophila melanogaster subgroup’s fourth chromosome. Mol. Biol. Evol. 27: 848–861. - PMC - PubMed
    1. Attrill H., Falls K., Goodman J. L., Millburn G. H., Antonazzo G., et al. , 2016. FlyBase: establishing a gene group resource for Drosophila melanogaster. Nucleic Acids Res. 44: D786–D792. - PMC - PubMed

Publication types