

Distribution, Community Composition, and Potential Metabolic Activity of Bacterioplankton in an Urbanized Mediterranean Sea Coastal Zone
- PMID: 28667110
- PMCID: PMC5561294
- DOI: 10.1128/AEM.00494-17
Distribution, Community Composition, and Potential Metabolic Activity of Bacterioplankton in an Urbanized Mediterranean Sea Coastal Zone
Abstract
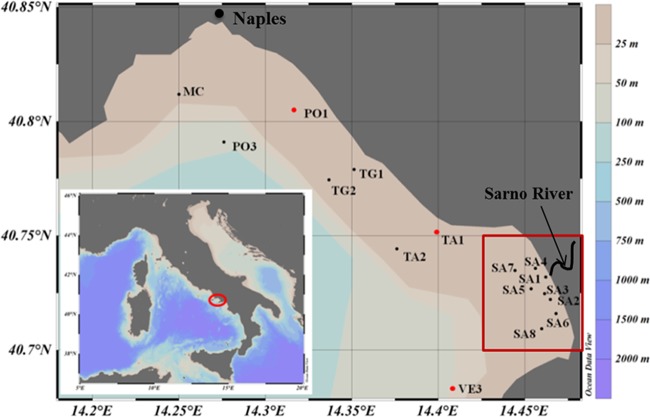
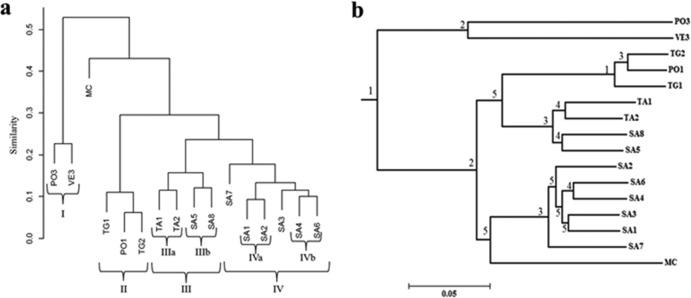
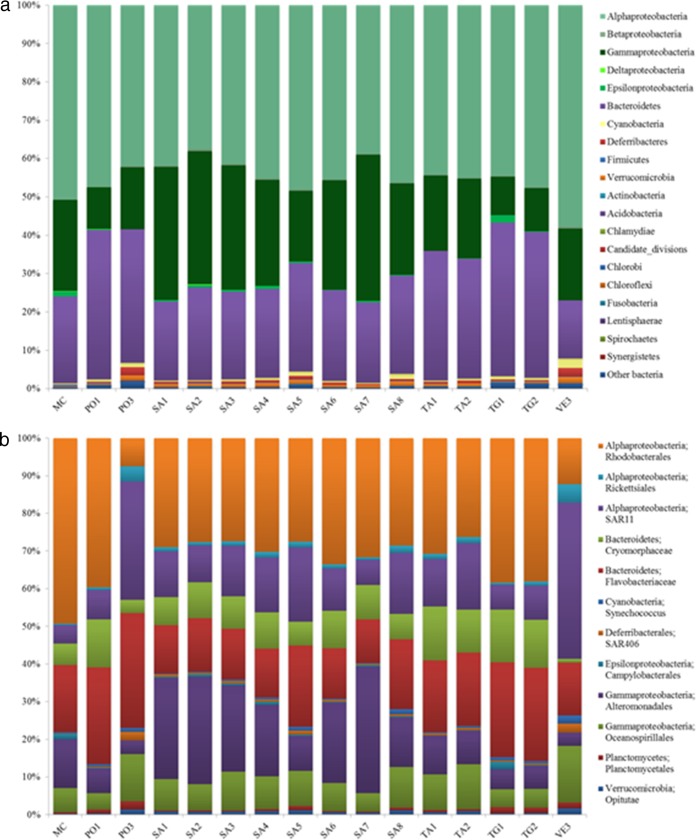
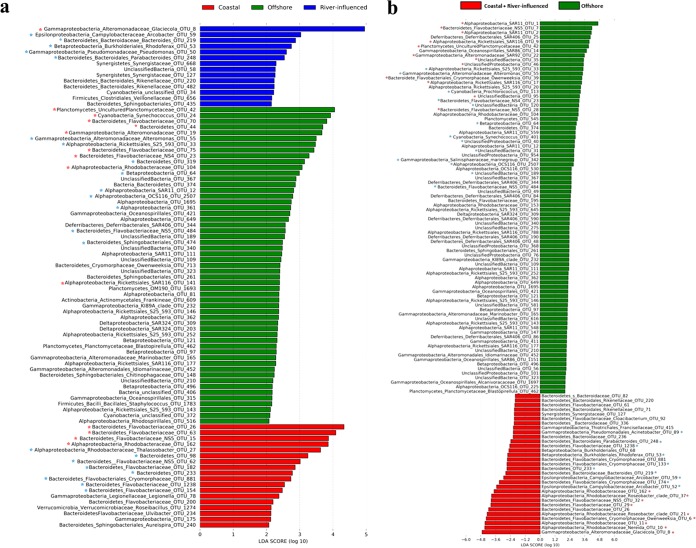
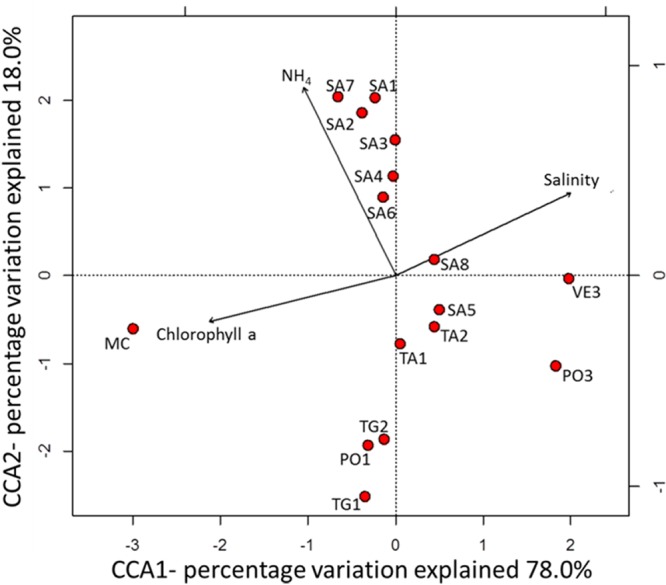
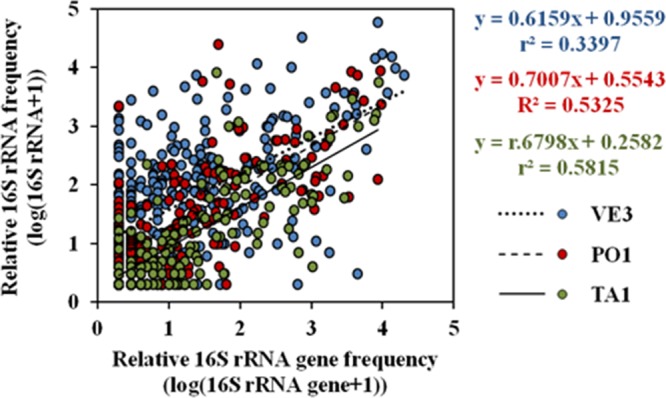
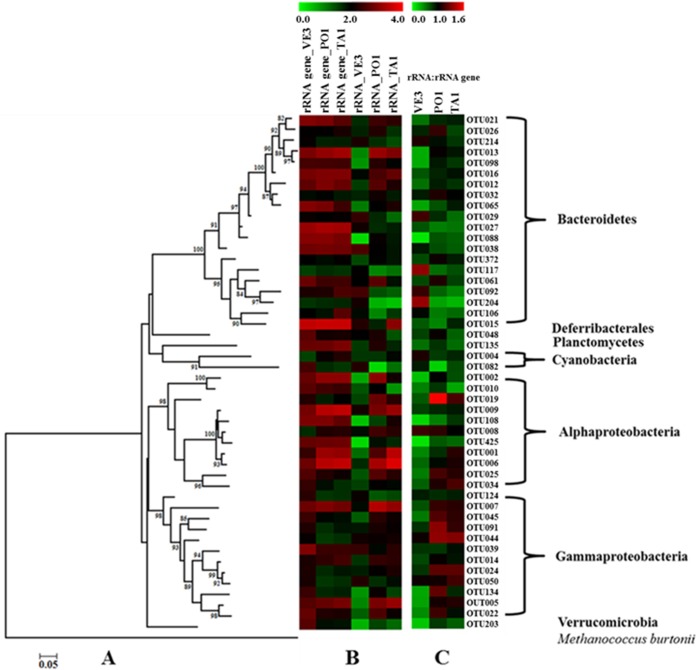
Bacterioplankton are fundamental components of marine ecosystems and influence the entire biosphere by contributing to the global biogeochemical cycles of key elements. Yet, there is a significant gap in knowledge about their diversity and specific activities, as well as environmental factors that shape their community composition and function. Here, the distribution and diversity of surface bacterioplankton along the coastline of the Gulf of Naples (GON; Italy) were investigated using flow cytometry coupled with high-throughput sequencing of the 16S rRNA gene. Heterotrophic bacteria numerically dominated the bacterioplankton and comprised mainly Alphaproteobacteria, Gammaproteobacteria, and Bacteroidetes Distinct communities occupied river-influenced, coastal, and offshore sites, as indicated by Bray-Curtis dissimilarity, distance metric (UniFrac), linear discriminant analysis effect size (LEfSe), and multivariate analyses. The heterogeneity in diversity and community composition was mainly due to salinity and changes in environmental conditions across sites, as defined by nutrient and chlorophyll a concentrations. Bacterioplankton communities were composed of a few dominant taxa and a large proportion (92%) of rare taxa (here defined as operational taxonomic units [OTUs] accounting for <0.1% of the total sequence abundance), the majority of which were unique to each site. The relationship between 16S rRNA and the 16S rRNA gene, i.e., between potential metabolic activity and abundance, was positive for the whole community. However, analysis of individual OTUs revealed high rRNA-to-rRNA gene ratios for most (71.6% ± 16.7%) of the rare taxa, suggesting that these low-abundance organisms were potentially active and hence might be playing an important role in ecosystem diversity and functioning in the GON.IMPORTANCE The study of bacterioplankton in coastal zones is of critical importance, considering that these areas are highly productive and anthropogenically impacted. Their richness and evenness, as well as their potential activity, are very important to assess ecosystem health and functioning. Here, we investigated bacterial distribution, community composition, and potential metabolic activity in the GON, which is an ideal test site due to its heterogeneous environment characterized by a complex hydrodynamics and terrestrial inputs of varied quantities and quality. Our study demonstrates that bacterioplankton communities in this region are highly diverse and strongly regulated by a combination of different environmental factors leading to their heterogeneous distribution, with the rare taxa contributing to a major proportion of diversity and shifts in community composition and potentially holding a key role in ecosystem functioning.
Keywords: 16S rRNA gene and rRNA; Gulf of Naples; Illumina sequencing; bacterioplankton; potential metabolic activity.
Copyright © 2017 American Society for Microbiology.
Figures
Similar articles
-
Diversity of rare and abundant bacteria in surface waters of the Southern Adriatic Sea.Mar Genomics. 2014 Oct;17:9-15. doi: 10.1016/j.margen.2014.04.002. Epub 2014 Apr 13. Mar Genomics. 2014. PMID: 24736045
-
Richness and diversity of bacterioplankton species along an estuarine gradient in Moreton Bay, Australia.Appl Environ Microbiol. 2004 Jun;70(6):3425-33. doi: 10.1128/AEM.70.6.3425-3433.2004. Appl Environ Microbiol. 2004. PMID: 15184140 Free PMC article.
-
Impact of a phytoplankton bloom on the diversity of the active bacterial community in the southern North Sea as revealed by metatranscriptomic approaches.FEMS Microbiol Ecol. 2014 Feb;87(2):378-89. doi: 10.1111/1574-6941.12230. Epub 2013 Oct 25. FEMS Microbiol Ecol. 2014. PMID: 24111503
-
Marine Bacterioplankton Seasonal Succession Dynamics.Trends Microbiol. 2017 Jun;25(6):494-505. doi: 10.1016/j.tim.2016.12.013. Epub 2017 Jan 17. Trends Microbiol. 2017. PMID: 28108182 Review.
-
Microbial ecology of deep-sea hypersaline anoxic basins.FEMS Microbiol Ecol. 2018 Jul 1;94(7). doi: 10.1093/femsec/fiy085. FEMS Microbiol Ecol. 2018. PMID: 29905791 Review.
Cited by
-
Ecological processes shaping highly connected bacterial communities along strong environmental gradients.FEMS Microbiol Ecol. 2024 Nov 23;100(12):fiae146. doi: 10.1093/femsec/fiae146. FEMS Microbiol Ecol. 2024. PMID: 39479791 Free PMC article.
-
Heterogeneous selection dominated the temporal variation of the planktonic prokaryotic community during different seasons in the coastal waters of Bohai Bay.Sci Rep. 2022 Nov 28;12(1):20475. doi: 10.1038/s41598-022-24892-1. Sci Rep. 2022. PMID: 36443487 Free PMC article.
-
Bacterioplankton community variation in Bohai Bay (China) is explained by joint effects of environmental and spatial factors.Microbiologyopen. 2020 Apr;9(4):e997. doi: 10.1002/mbo3.997. Epub 2020 Feb 5. Microbiologyopen. 2020. PMID: 32022464 Free PMC article.
-
Definition of the microbial rare biosphere through unsupervised machine learning.Commun Biol. 2025 Apr 2;8(1):544. doi: 10.1038/s42003-025-07912-4. Commun Biol. 2025. PMID: 40175529 Free PMC article.
-
Exploring Microbial Resource of Different Rhizocompartments of Dominant Plants Along the Salinity Gradient Around the Hypersaline Lake Ejinur.Front Microbiol. 2021 Jul 12;12:698479. doi: 10.3389/fmicb.2021.698479. eCollection 2021. Front Microbiol. 2021. PMID: 34322109 Free PMC article.
References
-
- Amaral-Zettler L, Artigas LF, Baross J, Bharathi L, Boetius A, Chandramohan D, Herndl G, Kogure K, Neal P, Pedrós-Alió C, Ramette A, Schouten S, Stal L, Thessen A, Leeuw JD, Sogin M. 2010. A global census of marine microbes, p 223–245. In McIntyre AD. (ed), Life in the world's oceans. Blackwell Publishing Ltd., Oxford, United Kingdom.
-
- Benner R, Herndl G. 2011. Bacterially derived dissolved organic matter in the microbial carbon pump, p 46–48. In Jiao N, Azam F, Sanders S (ed), Microbial carbon pump in the ocean. American Association for the Advancement of Science, Washington, DC.
MeSH terms
Substances
LinkOut - more resources
Full Text Sources
Other Literature Sources
Miscellaneous
