. 2017 Jun 30;7(1):4486.
doi: 10.1038/s41598-017-04823-1.

Fam64a is a novel cell cycle promoter of hypoxic fetal cardiomyocytes in mice

Affiliations

Fam64a is a novel cell cycle promoter of hypoxic fetal cardiomyocytes in mice

Ken Hashimoto et al. Sci Rep. .

Abstract

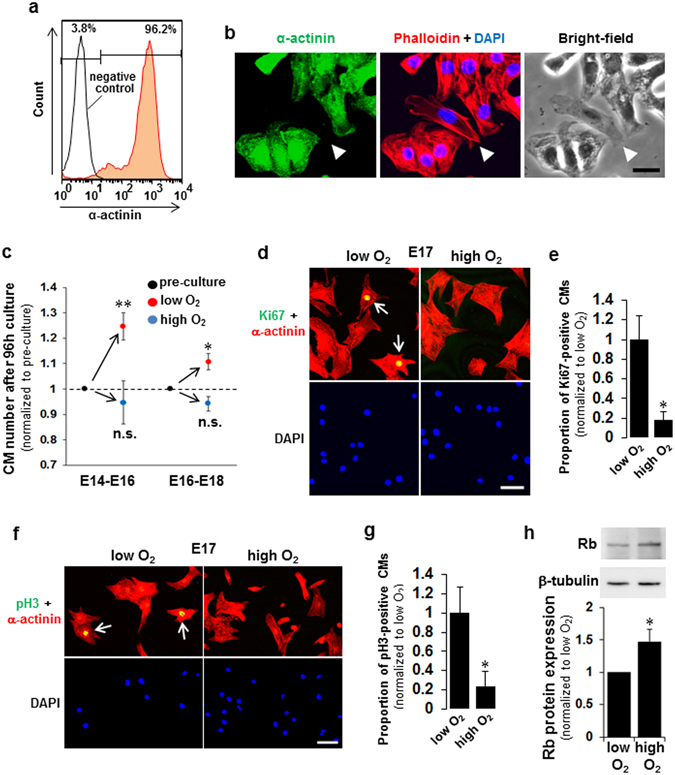
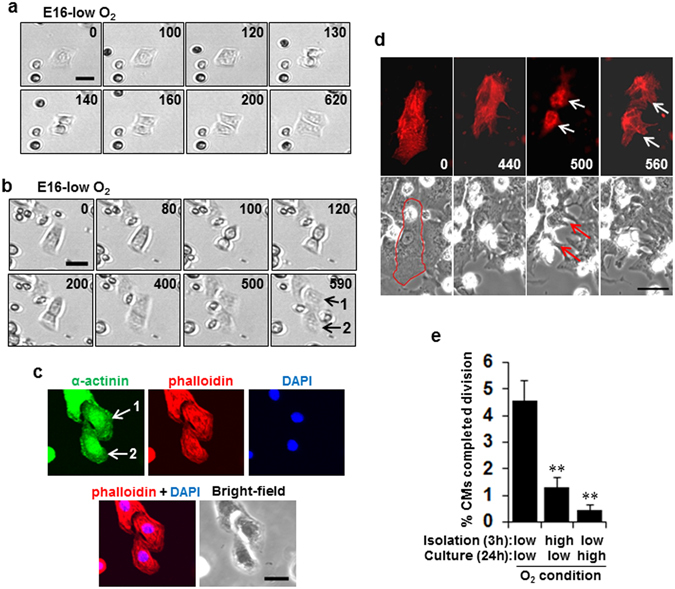
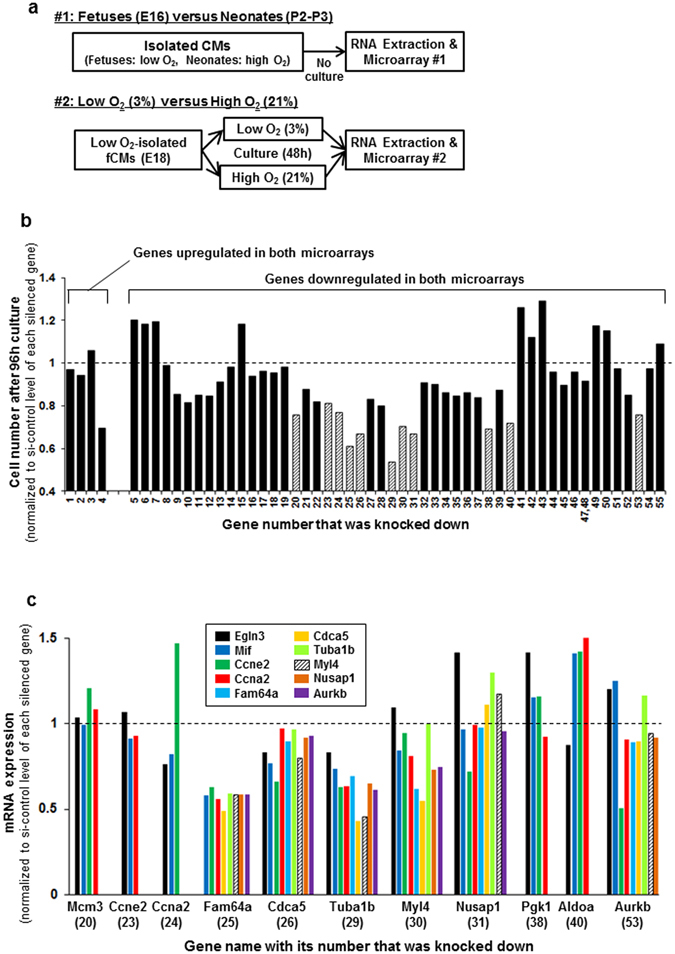
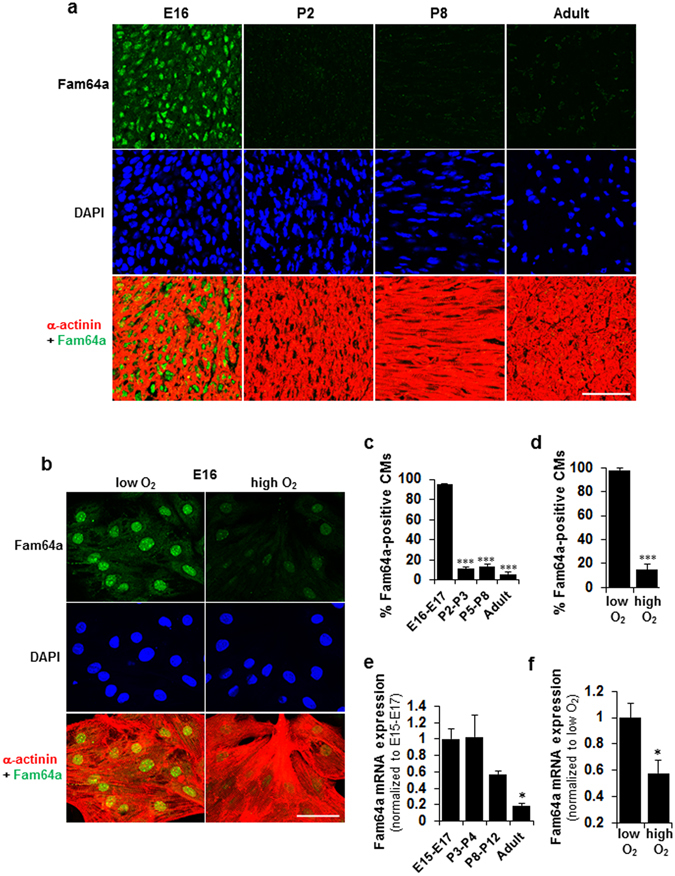
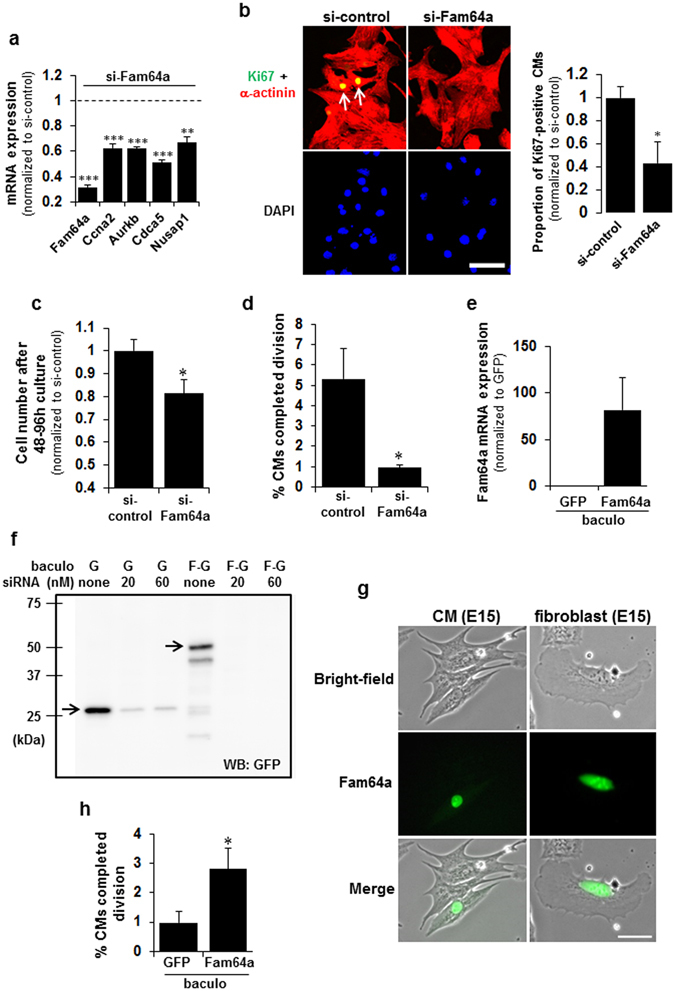
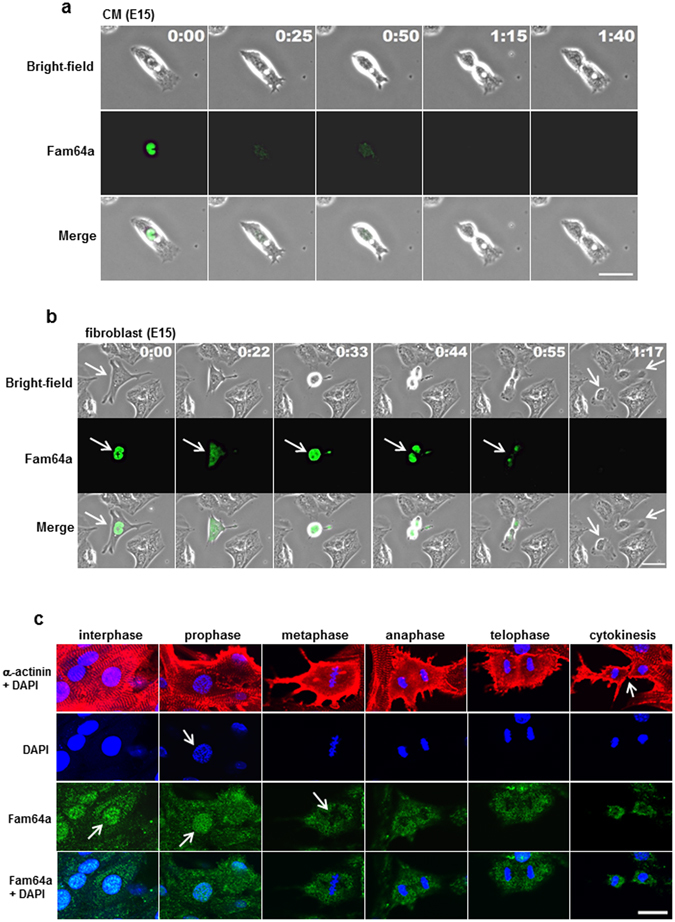
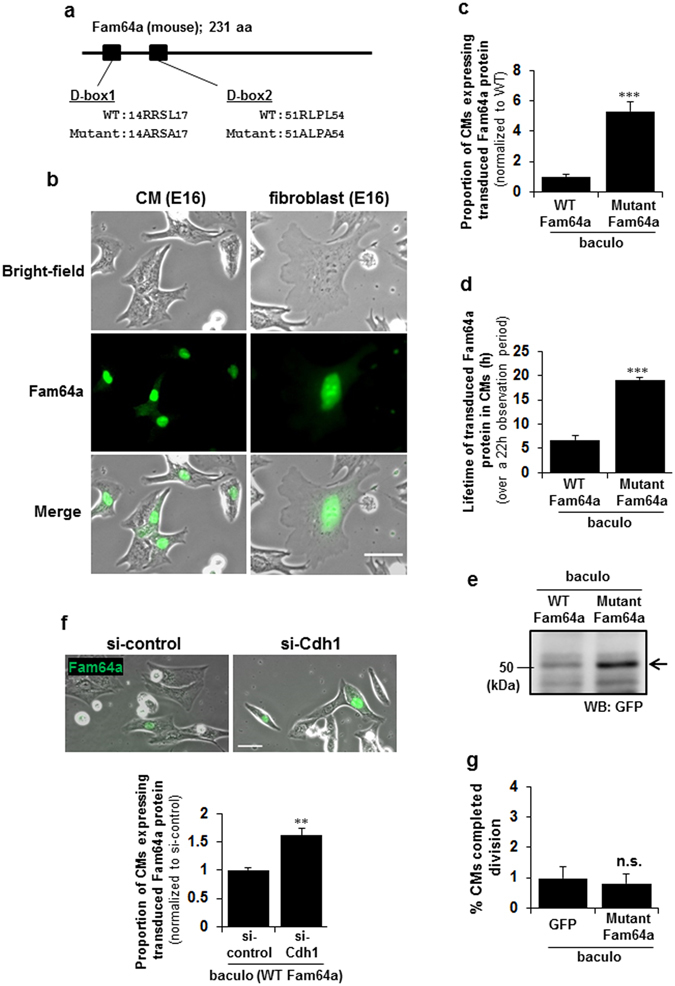
Fetal cardiomyocytes actively proliferate to form the primitive heart in utero in mammals, but they stop dividing shortly after birth. The identification of essential molecules maintaining this active cardiomyocyte proliferation is indispensable for potential adult heart regeneration. A recent study has shown that this proliferation depends on a low fetal oxygen condition before the onset of breathing at birth. We have established an isolation protocol for mouse fetal cardiomyocytes, performed under strict low oxygen conditions to mimic the intrauterine environment, that gives the highest proliferative activities thus far reported. Oxygen exposure during isolation/culture markedly inhibited cell division and repressed cell cycle-promoting genes, and subsequent genome-wide analysis identified Fam64a as a novel regulatory molecule. Fam64a was abundantly expressed in hypoxic fetal cardiomyocyte nuclei, but this expression was drastically repressed by oxygen exposure, and in postnatal cardiomyocytes following the onset of breathing and the resulting elevation of oxygen tension. Fam64a knockdown inhibited and its overexpression enhanced cardiomyocyte proliferation. Expression of a non-degradable Fam64a mutant suggested that optimum Fam64a expression and subsequent degradation by anaphase-promoting complex/cyclosome (APC/C) during the metaphase-to-anaphase transition are required for fetal cardiomyocyte division. We propose that Fam64a is a novel cell cycle promoter of hypoxic fetal cardiomyocytes in mice.


Conflict of interest statement

The authors declare that they have no competing interests.

Figures

Figure 1
Figure 1
Exposure of fetal cardiomyocytes (fCMs) to O2 inhibits proliferation and cell cycle activity. (a) FACS analyses of E16 fCMs stained for α-actinin indicate > 95% purity when isolated and cultured under low O2 conditions. (b) Immunofluorescence for α-actinin observed in phalloidin, DAPI, and bright-field images of E16 fCMs. The arrowhead indicates one of the few contaminating fibroblasts, which have a distinct phase appearance and are completely negative for α-actinin. (c) The fCMs (E14–E16 or E16–E18) isolated under low O2 conditions were cultured under low or high O2 conditions for 96 h. At the start and end of the culture, total cell numbers were counted, and the proportion of CMs and non-CMs were determined by FACS to obtain the absolute number of each cell type. n = 3–5 independent experiments. * P < 0.05 and ** P < 0.01 compared to pre-culture levels. n.s. = not significant. (d,f) Immunofluorescence for Ki67 (d) and pH3 (f) observed in α-actinin and DAPI of low O2-isolated fCMs cultured under low or high O2 conditions. Arrows denote Ki67- (d) and pH3- (f) positive fCMs. (e,g) Proportions of Ki67- (e) and pH3- (g) positive CMs in (d) and (f), respectively. n = 5 independent experiments. * P < 0.05. (h) Rb protein expressions in low O2-isolated fCMs (E16–E17) cultured under low or high O2 conditions. β-tubulin was used as a loading control. n = 5 independent experiments. * P < 0.05. Error bars = SEM. Scale bars = 20 µm in (b) and 50 µm in (d,f).
Figure 2
Figure 2
Direct observation reveals O2-induced inhibition of fetal cardiomyocyte (fCM) cell division. (a,b) Two representative time-lapse recordings of cell division dynamics of E16 fCMs under low O2 isolation and culture conditions. The number on each panel indicates the time (in minutes) elapsed from the time indicated in the first panel. (c) Post-imaging sample of (b) containing two daughter cells following cell division (numbered as 1 and 2 on the last panel of (b)). The sample was fixed and immunostained for α-actinin and observed in phalloidin, DAPI, and bright-field images. Two identical daughter cells were then imaged (numbered as 1 and 2 in the upper left panel of (c)). This correlative analysis confirmed that the dividing cells were unequivocally CMs. (d) A representative time-lapse recording of cell division dynamics of fCMs transduced with sarcomeric α-actinin-mCherry baculovirus observed in bright-field images. The number on each panel indicates the time (in minutes) elapsed from the time indicated in the first panel. The event of mitosis and cytokinesis was marked by arrows. The contour of the fCM at time 0 was outlined in red. (e) Percentage of E16 fCMs that completed cell division as determined by time-lapse imaging under the indicated conditions. n = 3–6 independent experiments and ~1700 cells were counted for each condition. ** P < 0.01 compared to low O2 isolation and low O2 culturing conditions. Error bars = SEM. Scale bars = 30 µm in (a,b and d) and 20 µm in (c).
Figure 3
Figure 3
Fam64a is identified as an essential molecule for fetal cardiomyocyte (fCM) proliferation at the late embryonic stage. (a) DNA microarrays were performed with two sample sets—array #1: fetuses versus neonates, and array #2: fCMs cultured under low versus high O2 conditions. For array #1, CMs were isolated from fetal hearts under low O2 conditions or from neonatal hearts under high O2 conditions, and total RNA was immediately obtained (with no further cell culturing). In array #2, fCMs isolated under low O2 conditions were separately cultured under low or high O2 conditions, and then total RNA was extracted. (b) Each of 55 selected genes was knocked down in late embryonic stage fCMs (E16–E17) isolated under low O2 conditions. The cells were cultured for 96 h, and proliferative activity was evaluated by cell counting. Eleven genes (hatched bars) were selected as showing strong proliferation-inhibiting effects when knocked down. The Hist1h2ao (No. 47) and Hist1h2af (No. 48) genes had no specific siRNA available; therefore, an siRNA targeting both genes was used. Data are shown as normalized to the si-control level of each silenced gene, set at 1. This experiment was performed once for screening purposes. (c) In fCMs (E16–E17) isolated under low O2 conditions, each of the 11 genes selected in (b) was knocked down and the mRNA levels of the indicated genes were evaluated by qPCR. Knockdown of Fam64a resulted in the strongest repression of cell cycle-promoting genes. Data are shown as normalized to the si-control level of each silenced gene, set at 1. This experiment was performed once for screening purposes.
Figure 4
Figure 4
Abundant nuclear Fam64a expression in hypoxic fetal cardiomyocytes (fCMs) is repressed by O2 exposure and in postnatal CMs. (a,b) Immunofluorescence staining of Fam64a and α-actinin in DAPI stained mouse heart sections (a) and in E16 fCMs isolated under low O2 conditions and cultured under low or high O2 conditions (b). (c,d) Percentage of Fam64a-positive fCMs in (a) and (b), respectively. n = 6–7 microscope images from 3 hearts (c) and 10 microscope images from 3 independent experiments (d). *** P < 0.001 compared to E16–E17 (c), or compared to low O2 conditions (d). (e,f) qPCR analysis of Fam64a mRNA expression in mouse hearts at indicated stages (e) and of E17 fCMs isolated under low O2 conditions and cultured under low or high O2 conditions (f). n = 4 hearts (e) and 3 independent experiments (f). * P < 0.05 compared to E15–17 (e), or compared to low O2 conditions (f). The reduction in Fam64a mRNA levels in (e) was statistically significant with respect to developmental stages, as determined by one-way ANOVA (P = 0.008). Error bars = SEM. Scale bars = 50 µm in (a,b).
Figure 5
Figure 5
Fam64a expression positively correlates with fetal cardiomyocyte (fCM) proliferation. (a) qPCR analysis of mRNA levels of the indicated genes in Fam64a-silenced fCMs (E16–E17) isolated under low O2 conditions. n = 3 independent experiments except for Fam64a knockdown evaluated with 2 independent experiments. ** P < 0.01 and *** P < 0.001 compared to the si-control levels of each gene. (b) Immunofluorescence staining for Ki67 observed in α-actinin and DAPI of Fam64a-silenced E16 fCMs isolated under low O2 conditions. Arrows denote Ki67-positive CMs. Quantitative analysis of the proportion of Ki67-positive CMs is shown on the right. n = 5 independent experiments. * P < 0.05. (c) Proliferative activity of Fam64a-silenced fCMs (E16–E17) evaluated by cell counting. The cells were isolated under low O2 conditions and cultured for 48–96 h. n = 5 independent experiments. * P < 0.05. (d) Percentage of Fam64a-silenced E16 fCMs that completed cell division, as determined by time-lapse imaging. The cells were isolated under low O2 conditions. n = 3 independent experiments and ~700 cells were counted for each condition. * P < 0.05. (e) qPCR analysis of Fam64a mRNA expression in fCMs (E15–E16) isolated under high O2 conditions and transduced with a Fam64a-GFP-baculovirus or a control GFP-expressing baculovirus. n = 3 independent experiments. (f) Immunoblot analysis of fCMs (E15–E16) isolated under high O2 conditions and transduced with a Fam64a-GFP-baculovirus or a control GFP-expressing baculovirus (denoted as F-G and G, respectively). A GFP antibody was used as this correctly detected overexpressed Fam64a (28 kDa) as a GFP-tagged protein (28 + 27 kDa). The band specificity was confirmed by co-transfection of siRNA targeting GFP at the indicated doses. (g) Localization of transduced Fam64a-GFP protein in fCMs and fibroblasts, as observed in bright-field images. (h) Percentage of Fam64a-overexpressed fCMs (E14–E17) that completed cell division, as determined by time-lapse imaging. The cells were isolated under high O2 conditions. n = 4–5 independent experiments and ~1800 cells were counted for each condition. * P < 0.05. Error bars = SEM. Scale bars = 50 µm in (b) and 30 µm in (g).
Figure 6
Figure 6
Nuclear Fam64a in dividing fetal cardiomyocytes (fCMs) rapidly disappears during metaphase-to-anaphase transition. (a) A representative time-lapse recording of cell division dynamics of E15 fCMs transduced with Fam64a-GFP baculovirus. A steady nuclear signal of Fam64a in an interphase fCM at time 0 rapidly disappeared before the onset of anaphase at 25 min. The fCM subsequently completed mitosis and cytokinesis, but the Fam64a signal never reappeared. (b) A representative time-lapse recording of cell division dynamics of E15 fibroblasts transduced with Fam64a-GFP baculovirus. The Fam64a signal disappeared upon completion of mitosis (arrows), which was a later time point than observed for the fCMs in (a). (c) Isolated E16 fCMs were triple-stained with Fam64a, α-actinin, and DAPI. DAPI staining clearly defined each phase in mitosis, including prophase, metaphase, anaphase, telophase, and subsequent cytokinesis. In interphase CMs, Fam64a expression was restricted to nuclei (arrow) with a faint background signal in the cytoplasm. At this time point, the sarcomere structure was intact, as indicated by α-actinin staining. In prophase, when chromosome condensation was visible as dot-like puncta by DAPI staining (arrow), Fam64a was still expressed in the CM nuclei (arrow). However, during the metaphase-to-anaphase transition, the Fam64a signal rapidly disappeared (arrow) and never reappeared thereafter, while the background signal remained unchanged. Sarcomere structure was grossly perturbed during cell division. Scale bars = 30 µm in (a,b) and 20 µm in (c). In (a) and (b), the number on each panel indicates the time in (hours: minutes) elapsed from the time indicated in the first panel.
Figure 7
Figure 7
Fam64a degradation by the APC/C during the metaphase-to-anaphase transition is required for fetal cardiomyocyte (fCM) cell division. (a) A non-degradable mutant of Fam64a, in which two recognition sites by APC/C complex (D-box1 and D-box2) were mutated (RxxL to AxxA). (b) Localization of the transduced mutant Fam64a-GFP protein in fCMs and fibroblasts observed in bright-field images. (c) Proportion of fCMs (E15–E17) expressing transduced Fam64a protein out of total fCMs, as detected by GFP fluorescence. n = 3–4 independent experiments, and ~700 cells were counted for each condition. *** P < 0.001. (d) Lifetime of transduced Fam64a protein in fCMs (E15–E17) over a 22 h observation period, as detected by GFP fluorescence. n = 41 and 66 cells for WT and mutant Fam64a-GFP expressing cells, respectively, from 3–4 independent experiments. *** P < 0.001. (e) A representative immunoblot analysis of E16 fCMs transduced with WT or mutant Fam64a-GFP baculovirus and then probed with GFP antibody, which correctly detects overexpressed Fam64a (28 kDa) as a GFP-tagged protein (28 + 27 kDa). (f) Proportion of Cdh1-silenced E16 fCMs expressing transduced WT Fam64a protein out of total fCMs, as detected by GFP fluorescence. n = 14–40 microscope images from 3 independent experiments, and ~800 cells were counted for each condition. ** P < 0.01. (g) Percentage of mutant Fam64a-overexpressed fCMs (E15–E17) that completed cell division, as determined by time-lapse imaging. The cells were isolated under high O2conditions. n = 5 independent experiments and ~2100 cells were counted for each condition. n.s. = not significant. Error bars = SEM. Scale bars = 30 µm in (b,f).

References

    1. Puente BN, et al. The oxygen-rich postnatal environment induces cardiomyocyte cell-cycle arrest through DNA damage response. Cell. 2014;157:565–579. doi: 10.1016/j.cell.2014.03.032. - DOI - PMC - PubMed
    1. Guimarães-Camboa N, et al. HIF1α represses cell stress pathways to allow proliferation of hypoxic fetal cardiomyocytes. Dev Cell. 2015;33:507–521. doi: 10.1016/j.devcel.2015.04.021. - DOI - PMC - PubMed
    1. Leone M, Magadum A, Engel FB. Cardiomyocyte proliferation in cardiac development and regeneration: a guide to methodologies and interpretations. Am J Physiol Heart Circ Physiol. 2015;309:H1237–H1250. doi: 10.1152/ajpheart.00559.2015. - DOI - PubMed
    1. Senyo SE, et al. Mammalian heart renewal by pre-existing cardiomyocytes. Nature. 2013;493:433–436. doi: 10.1038/nature11682. - DOI - PMC - PubMed
    1. Hashimoto H, et al. Time-lapse imaging of cell cycle dynamics during development in living cardiomyocyte. J Mol Cell Cardiol. 2014;72:241–249. doi: 10.1016/j.yjmcc.2014.03.020. - DOI - PubMed

Publication types

LinkOut - more resources