. 2017 Oct:13:393-401.
doi: 10.1016/j.redox.2017.06.010. Epub 2017 Jun 27.

Transcription factor NRF2 controls the fate of neural stem cells in the subgranular zone of the hippocampus

Affiliations

Transcription factor NRF2 controls the fate of neural stem cells in the subgranular zone of the hippocampus

Natalia Robledinos-Antón et al. Redox Biol. 2017 Oct.

Abstract

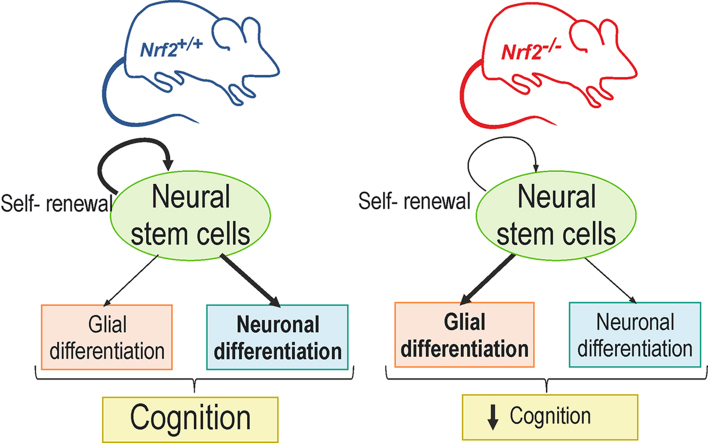
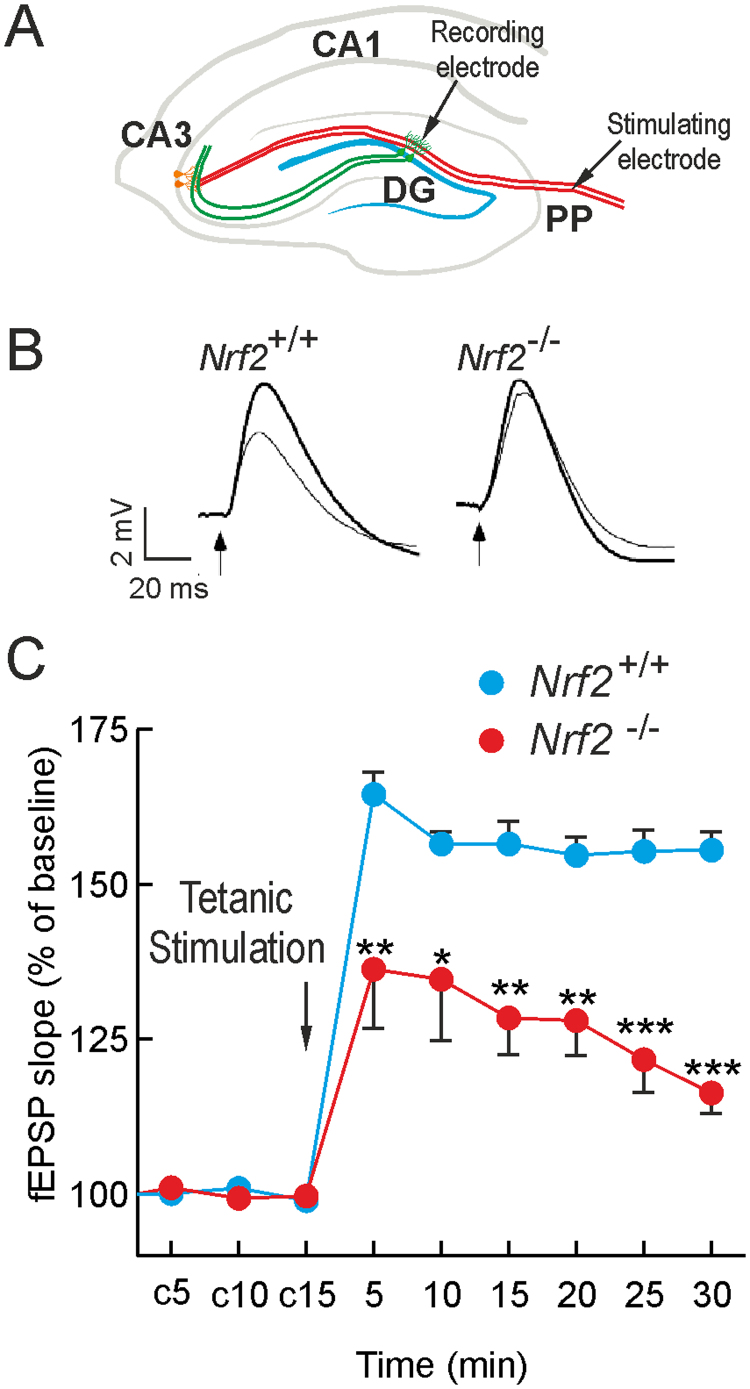
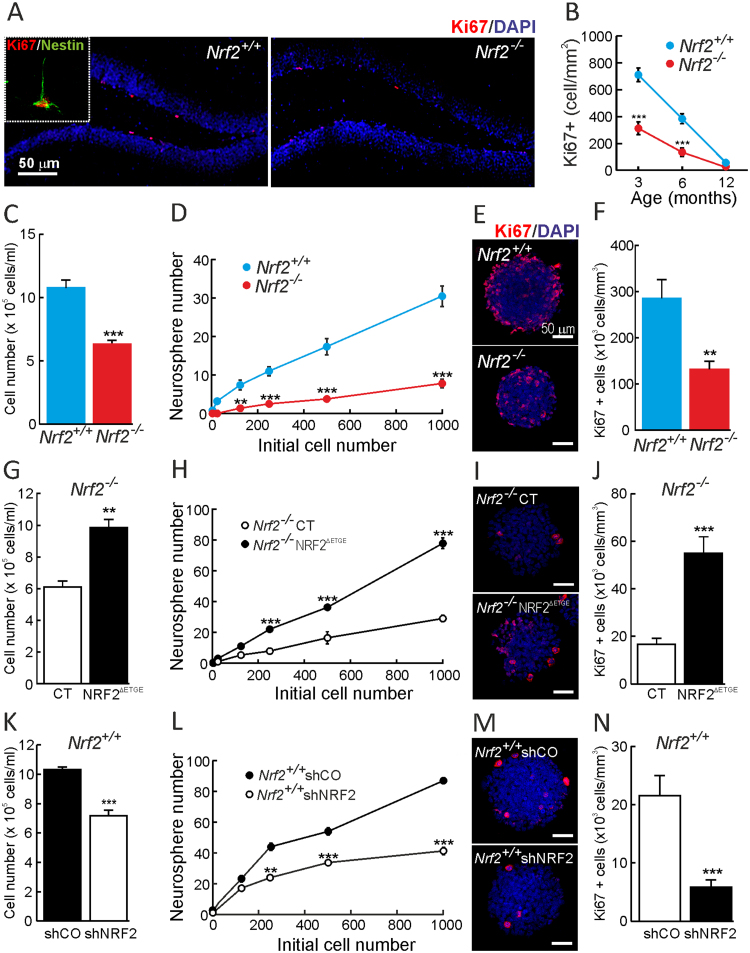
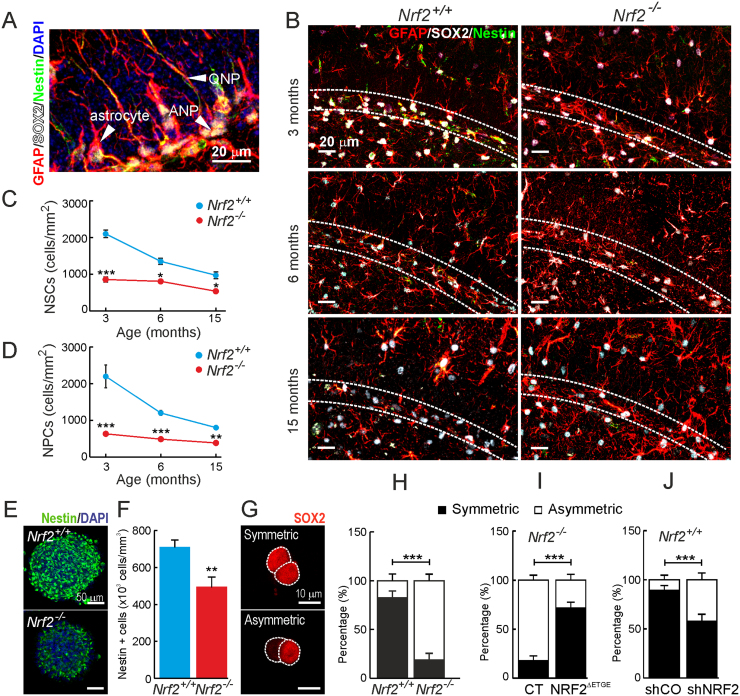
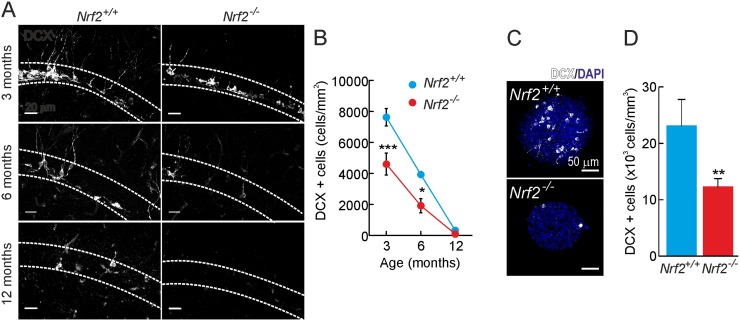
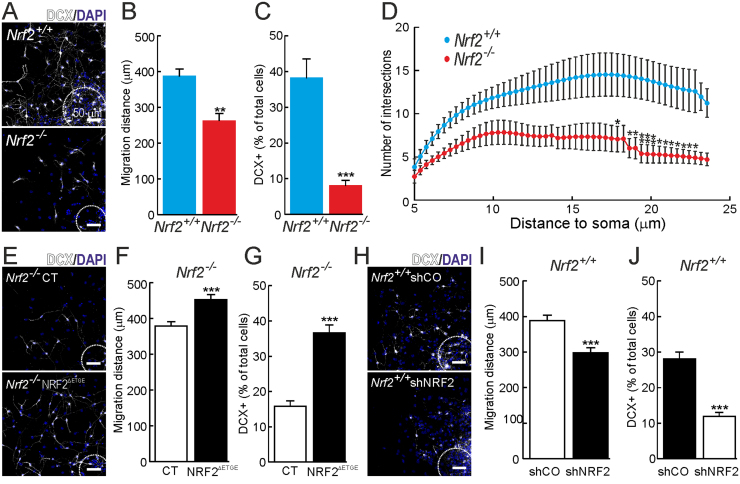
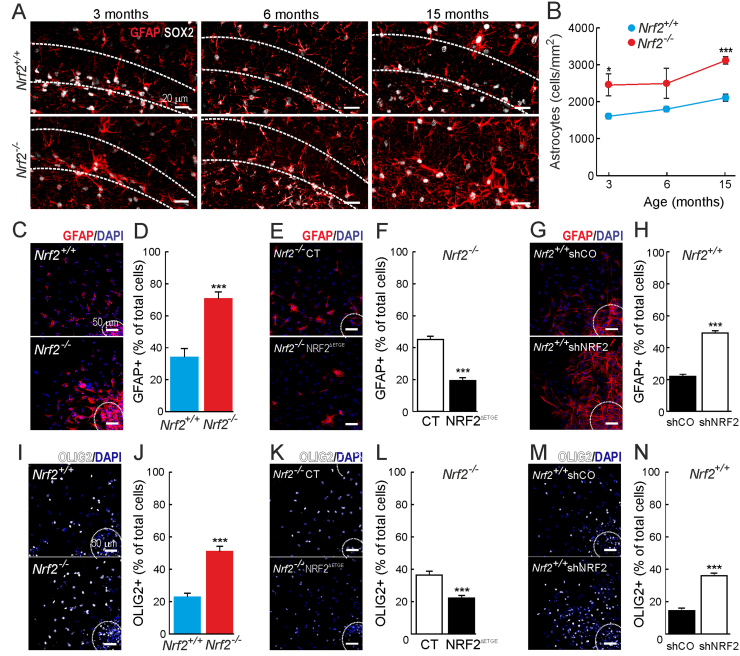
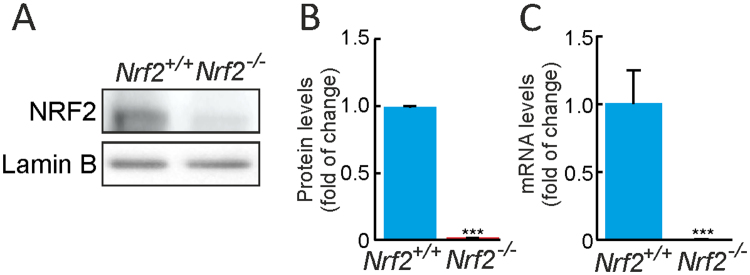
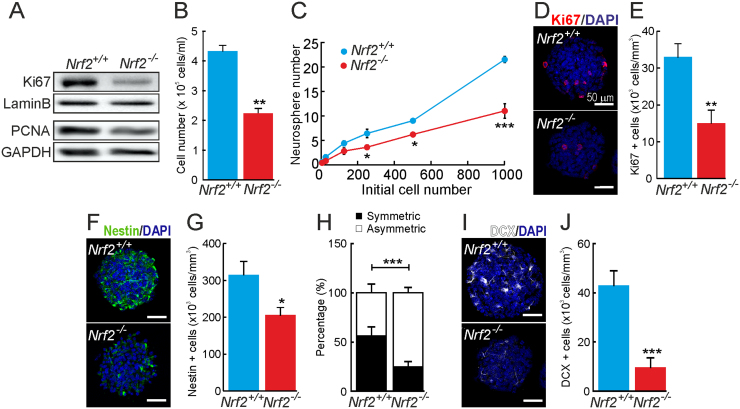
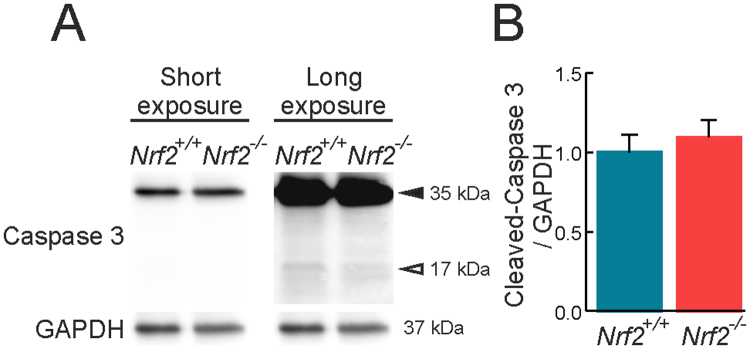
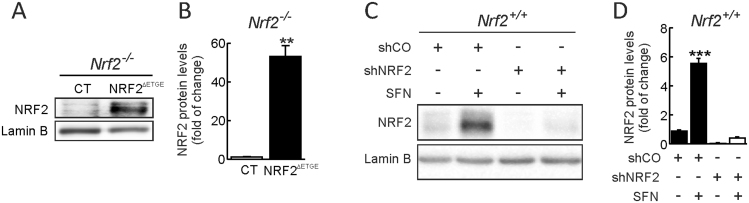
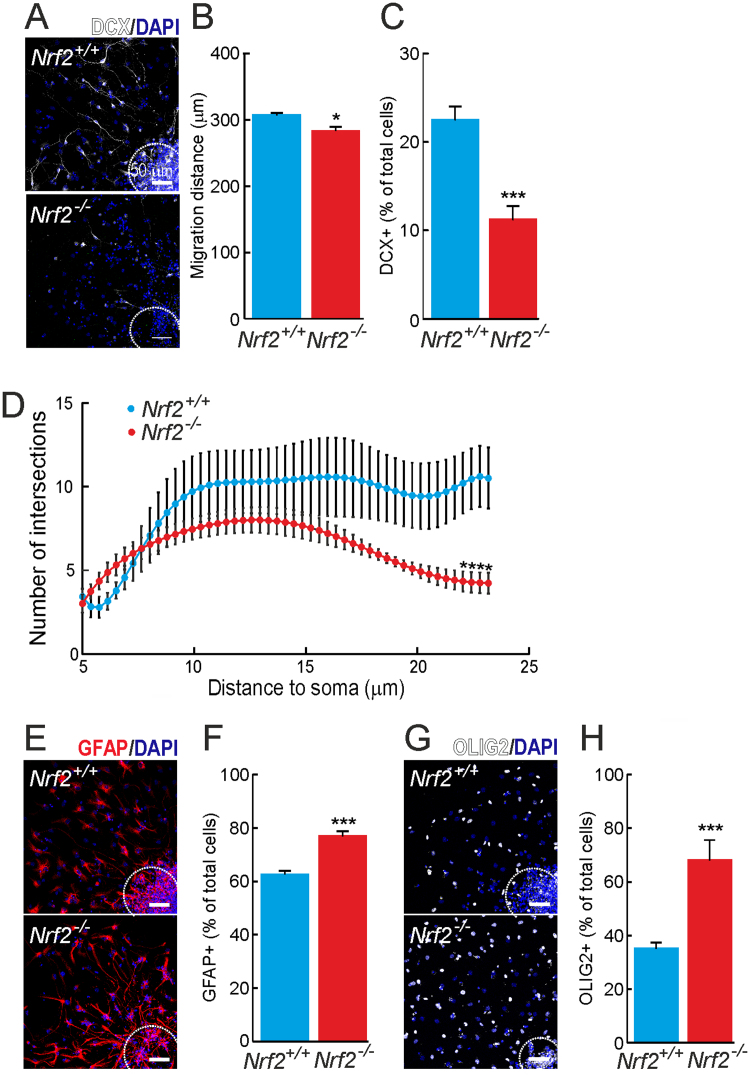
Neural stem/progenitor cells (NSPCs) located at the subgranular zone (SGZ) of the hippocampus participate in the maintenance of synaptic networks that ensure cognitive functions during life. Although it is known that this neurogenic niche losses activity with oxidative stress and ageing, the molecular events involved in its regulation are largely unknown. Here, we studied the role of transcription factor Nuclear Factor-Erythroid 2-Related Factor 2 (NRF2) in the control of NSPCs destinies in the SGZ. We first describe that NRF2-knockout (Nrf2-/-) mice exhibit impaired long term potentiation, a function that requires integrity of the SGZ, therefore suggesting a cognitive deficit that might be linked to hippocampal neurogenesis. Then, we found a reduction in NSCs from birth to adulthood that was exacerbated in Nrf2-/- vs. Nrf2+/+ mice. The clonogenic and proliferative capacity of SGZ-derived NSPCs from newborn and 3-month-old Nrf2-/- mice was severely reduced as determined in neurosphere cultures. Nrf2-deficiency also impaired neuronal differentiation both the SGZ, and in neurosphere differentiation assays, leading to an abnormal production of astrocytes and oligodendrocytes vs. neurons. Rescue of Nrf2-/- NSPCs by ectopic expression of NRF2 attenuated the alterations in clonogenic, proliferative and differentiating capacity of hippocampal NSPCs. In turn, knockdown of the NRF2 gene in wild type NSPCs reproduced the data obtained with Nrf2-/- NSPCs. Our findings demonstrate the importance of NRF2 in the maintenance of proper proliferation and differentiation rates of hippocampal NSPCs and suggest that interventions to up-regulate NRF2 might provide a mechanism to preserve the neurogenic functionality of the hippocampus.

Keywords: Aging; Hippocampal neurogenesis; NRF2; Neural stem cells; Oxidative stress; Subgranular zone.


Figures

fx1
Graphical abstract
Fig. 1
Fig. 1
NRF2 deficiency impairs long term potentiation. A, upper draw points the positions of the stimulating electrode on the perforant pathway and recording electrode on the granule cell layer: DG, dentate gyrus; CA1 and CA3, Cornu Ammonis areas 1 and 3, respectively. B, representative responses recorded from Nrf2+/+ and Nrf2-/- mice before (thin line) and after (thick line) high-frequency trains of tetanic stimulation. Calibration: 2 mV, 20 ms. C, LTP of field excitatory postsynaptic potential (fEPSP) in 6-month-old animals before and after tetanic stimulation of the perforant pathway. c5, c10, c15: baseline recordings before tetanic stimulation. Data are mean ± SEM (n = 6). Statistical analysis was performed with two-way ANOVA followed by Bonferroni post-hoc test. **p < 0.01, and ***p < 0.001 comparing Nrf2-/- versus Nrf2+/+ group.
Fig. 2
Fig. 2
Impaired proliferative and clonogenic capacity of NSPCs from Nrf2-/-mice. A, confocal microscope images of Ki67 staining in the SGZ of 3-month-old mice. The green channel for Nestin staining has been removed except in the inset to allow easier visualization of proliferating cells. Nuclei were counterstained with DAPI. B, quantification of Ki67+ cells in 3-, 6- and 12-month-old mice. Data represent mean values ± SEM (n = 4). C, number of cells after 5 days in culture from an initial seeding of 20,000 NSPCs/ml derived from Nrf2-/- vs. Nrf2+/+ 3-month-old mice. D, serial dilution assay of Nrf2+/+ and Nrf2-/- cultures showing the number of neurospheres formed after 7 days (n = 5). E-F, immunofluorescence and quantification of Ki67+ cells, counterstained with DAPI, in neurospheres with similar size (n = 10). G-N, parallel analysis in Nrf2-/--derived NSPCs infected with a control vector (CT) or a lentivirus expressing active NRF2ΔETGE (G-J), and Nrf2+/+-derived NSPCs infected with control (shCO) and shNRF2 lentivirus (K-N). Data show mean values ± SEM. **p < 0.01, ***p < 0.001 according to a Student's t-test vs. either Nrf2-/- (B, C, D, F) or the experimental groups (G,H, J, K, L and N).
Fig. 3
Fig. 3
NRF2-deficiency provokes a drop in the pool of QNPs and ANPs and an increase of asymmetric divisions of NSPCs. A, confocal image of a SGZ immunostained GFAP/SOX2/Nestin. Arrows point a typical ANP, QNP and astrocyte (see text). B, same staining for 3- (Upper panel), 6- (middle panel) and 15- (low panel) month-old mice. C-D, quantification of QNPs (C) and ANPs (D) in 3-, 6- and 15-month-old mice (n = 3). E-F, nestin immunofluorescence on neurospheres derived from 3-month-old mice (n = 10). G-J, cell pair assay of NSPCs by SOX2 immunofluorescence. G, example of symmetric and asymmetric divisions. Quantification of symmetric and asymmetric divisions in cultures from 3-month-old (H) mice, Nrf2-/- NSPCs infected with control or NRF2ΔETGE expression lentivirus (I) and Nrf2+/+ NSPCs infected with control or shRNA lentivirus to knock-down NRF2 (J) (n = 60 pairs). Data show mean values ± SEM.*p < 0.05, **p < 0.01, ***p < 0.001 according to a student's t-test vs. either Nrf2-/- (C, D, F and H) or the experimental groups (I and J).
Fig. 4
Fig. 4
NRF2-deficiency leads to a reduction of DCX+ cells. A and B, DCX immunostaining in the SGZ of 3-, 6- and 12-month-old mice (n = 3). C-D, DCX immunofluorescence in neurospheres derived from 3-month-old mice (n = 10). Data represent mean values ± SEM. *p < 0.05, **p < 0.01 and ***p < 0.001 according to a Student's t-test vs. the Nrf2-/- group.
Fig. 5
Fig. 5
Role of Nrf2 in the neuronal differentiation of NSPCs. A, DCX and DAPI staining of neurospheres from 3-months old mice grown under differentiation conditions. B, measurement of the cell migration as determined by distance from the neurosphere edge (dotted line) to DAPI stained nuclei (n = 40). C, quantification of DCX+ cells from neurospheres shown in A (n = 10). D, sholl analysis of the neurons in the differentiated neurospheres derived from 3-months old mice (n = 12). E. DCX and DAPI staining of Nrf2-/- neurospheres rescued by lentiviral expression of NRF2ΔETGE. F, measurement of their cell migration distance (n = 40). G, quantification of DCX+ cells (n = 10). H-J, parallel analysis in Nrf2+/+ neurospheres infected with control of shRNA lentivirus to knockdown NRF2. Data represent mean values ± SEM. *p < 0.05, **p < 0.01 and ***p < 0.001 according to a Student's t-test vs. the Nrf2-/- group (B, C and D) or the experimental groups (F, G, I and J).
Fig. 6
Fig. 6
Nrf2-deficiency leads to an increment in non-neuronal differentiation. A and B, astrocyte differentiation analyzed in the SGZ of 3-, 6- and 15-months old mice by GFAP/SOX2 immunostaining (n = 3). C-H, astroglial differentiation analyzed by GFAP immunostaining in the neurospheres derived from 3-month-old mice (A and B), Nrf2-/- neurospheres derived from control and NRF2ΔETGE expressing NCSs (C and D), and Nrf2+/+ neurospheres derived from control NRF2-knock-down NSPCs (E and F) (n = 10). I-N., oligodendrocyte differentiation analyzed in vitro using Olig2 staining in the differentiated neurospheres derived from 3-month-old mice (I and J), Nrf2-/- neurospheres derived from control and NRF2ΔETGE expressing NCSs (K and L), and Nrf2+/+ neurospheres derived from control NRF2-knock-down NSPCs (M and N) (n = 10). Data shown mean values ± SEM. *p < 0.05, **p < 0.01, ***p < 0.001 according to a Student's t-test vs. either Nrf2-/- group (B, D, J, L and N) or the experimental groups (F, H, P and R).
Supplemental Fig. 1
Supplemental Fig. 1
A, immunoblot analysis of NRF2 in Nrf2+/+ and Nrf2-/- neurospheres. Upper panel, anti-NRF2 antibody showing the specific NRF2 band of ∼105 kDa. Lower panel, anti-Lamin B antibody to ensure similar protein load per lane. B, densitometric quantification of representative blots from A. Data are mean ± SEM (n = 3). Statistical analysis was performed with a Student's t-test. ***p < 0.001 vs. Nrf2+/+ group. C, relative expression of mRNA encoding NRF2 in Nrf2+/+ and Nrf2-/- neurospheres normalized by β-actin mRNA levels. Data are mean ± SEM (n = 3). Statistical analysis was performed with a one-way ANOVA followed by Bonferroni post hoc test. ***p < 0.001 vs. Nrf2+/+ group.
Supplemental Fig. 2
Supplemental Fig. 2
Proliferative analysis and stem cells markers in neurospheres derived from newborn mice. A, immunoblot analysis of proliferative markers Ki67 and PCNA. Respective Lamin B and GAPDH blots show similar amount of protein per lane. B, number of cells after 5 days in culture from an initial seeding of 20,000 NSPCs/ml derived from Nrf2-/- vs. Nrf2+/+ newborn mice. C, serial dilution assay of newborn-derived Nrf2+/+ and Nrf2-/- cultures showing the number of neurospheres formed after 7 days (n = 5). D-E, immunofluorescence and quantification of Ki67+ cells, counterstained with DAPI, in neurospheres with similar size (n = 10). F-G, Nestin immunofluorescence on neurospheres derived from 3-months-old mice (n = 10). H, quantification of symmetric and asymmetric divisions in cultures from newborn mice. I-J, DCX immunofluorescence in neurospheres derived from newborn mice (n = 10). Data represent mean values ± SEM. *p < 0.05, **p < 0.01 and ***p < 0.001 according to a Student's t-test vs. the Nrf2-/- group.
Supplemental Fig. 3
Supplemental Fig. 3
Nrf2-deficiency does not increase apoptosis. A, immunoblot analysis of Caspase 3 (35 kDa; filled arrow) and cleaved-Caspase 3 (17 kDa; empty arrow) in Nrf2+/+ and Nrf2-/- neurospheres. Anti-GAPDH staining was performed to ensure similar protein load per lane. B, densitometric quantification of activated Caspase 3 from representative blots from A. Data are mean ± SEM (n = 3). Statistical analysis with a Student's t-test indicated non-significant differences.
Supplemental Fig. 4
Supplemental Fig. 4
Modulation of NRF2 protein levels by ectopic expression or shRNA knockdown. A, immunoblot analysis of NRF2 protein levels in NSPCs infected with lentiviral empty vector (CT) or expressing active NRF2ΔETGE. Upper panel, anti-NRF2 antibody. Lower panel, anti-Lamin B antibody showing similar protein load per lane. B, densitometric quantification of representative blots from A. Data are mean ± SEM (n = 3). Statistical analysis was performed with a Student's t-test. **p < 0.01 vs. CT group. C, immunoblot analysis of NRF2 in Nrf2+/+ NSPCs transduced with control vector (shCO) or lenti-shNRF2 and treated with vehicle or sulforaphane (SFN, 15 µM, 6 h). Upper panel, anti-NRF2 antibody; Lower panel, anti-Lamin B. D, densitometric quantification of representative blots from C. Data are mean ± SEM (n = 3). Statistical analysis was performed with a one-way ANOVA followed by Bonferroni post hoc test. ***p < 0.001 vs. vehicle-treated shCO group.
Supplemental Fig. 5
Supplemental Fig. 5
Neuronal and glial differentiation in neurospheres derived from newborn mice. A, DCX and DAPI staining of neurospheres from newborn mice grown under differentiation conditions. B, measurement of the cell migration as determined by distance from the neurosphere edge (dotted line) to DAPI stained nuclei (n = 40). C, quantification of DCX+ cells from neurospheres shown in A (n = 10). D, sholl analysis of the neurons in the differentiated neurospheres derived from newborn mice (n = 12). E-F, astroglial differentiation analyzed by GFAP immunostaining in the neurospheres derived from newborn mice (n = 10). G-H, Oligodendrocyte differentiation analyzed in vitro using Olig2 staining in the differentiated neurospheres derived from newborn mice (n = 10). Data shown mean values ± SEM. *p < 0.05, **p < 0.01, ***p < 0.001 according to a Student's t-test vs. either Nrf2-/- group.

Similar articles

Cited by

References

    1. Pajares M., Jimenez-Moreno N., Garcia-Yague A.J., Escoll M., de Ceballos M.L., Van Leuven F., Rabano A., Yamamoto M., Rojo A.I., Cuadrado A. Transcription factor NFE2L2/NRF2 is a regulator of macroautophagy genes. Autophagy. 2016;12(10):1902–1916. - PMC - PubMed
    1. Rojo A.I., Innamorato N.G., Martin-Moreno A.M., De Ceballos M.L., Yamamoto M., Cuadrado A. Nrf2 regulates microglial dynamics and neuroinflammation in experimental Parkinson's disease. Glia. 2010;58(5):588–598. - PubMed
    1. Rojo A.I., Rada P., Mendiola M., Ortega-Molina A., Wojdyla K., Rogowska-Wrzesinska A., Hardisson D., Serrano M., Cuadrado A. The PTEN/NRF2 axis promotes human carcinogenesis. Antioxid. Redox Signal. 2014;21(18):2498–2514. - PMC - PubMed
    1. Hayes J.D., Dinkova-Kostova A.T. The Nrf2 regulatory network provides an interface between redox and intermediary metabolism. Trends Biochem. Sci. 2014;39(4):199–218. - PubMed
    1. Zhu J., Wang H., Sun Q., Ji X., Zhu L., Cong Z., Zhou Y., Liu H., Zhou M. Nrf2 is required to maintain the self-renewal of glioma stem cells. BMC Cancer. 2013;13:380. - PMC - PubMed

Publication types