. 2017 Jul 1;12(1):51.
doi: 10.1186/s13024-017-0191-y.

Dissecting the role of non-coding RNAs in the accumulation of amyloid and tau neuropathologies in Alzheimer's disease

Affiliations

Dissecting the role of non-coding RNAs in the accumulation of amyloid and tau neuropathologies in Alzheimer's disease

Ellis Patrick et al. Mol Neurodegener. .

Abstract

Background: Given multiple studies of brain microRNA (miRNA) in relation to Alzheimer's disease (AD) with few consistent results and the heterogeneity of this disease, the objective of this study was to explore their mechanism by evaluating their relation to different elements of Alzheimer's disease pathology, confounding factors and mRNA expression data from the same subjects in the same brain region.

Methods: We report analyses of expression profiling of miRNA (n = 700 subjects) and lincRNA (n = 540 subjects) from the dorsolateral prefrontal cortex of individuals participating in two longitudinal cohort studies of aging.

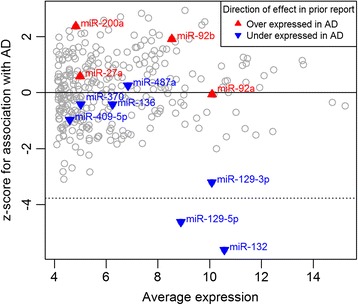
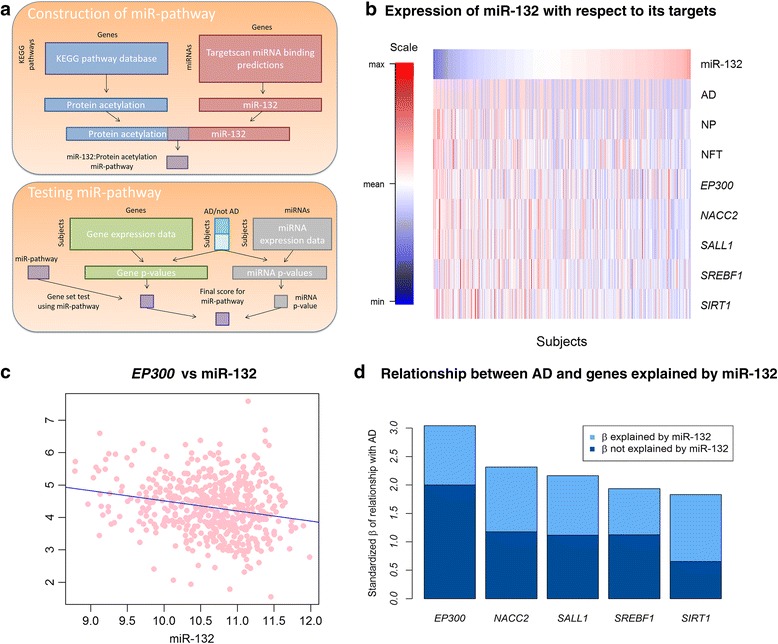
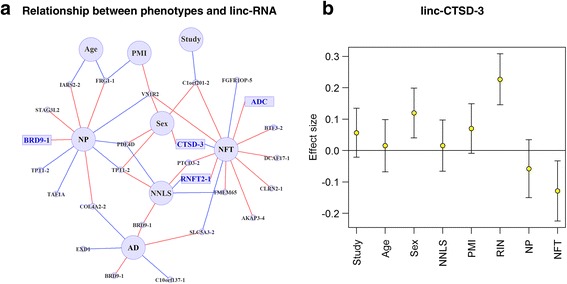
Results: We confirm the association of two well-established miRNA (miR-132, miR-129) with pathologic AD in our dataset and then further characterize this association in terms of its component neuritic β-amyloid plaques and neurofibrillary tangle pathologies. Additionally, we identify one new miRNA (miR-99) and four lincRNA that are associated with these traits. Many other previously reported associations of microRNA with AD are associated with the confounders quantified in our longitudinal cohort. Finally, by performing analyses integrating both miRNA and RNA sequence data from the same individuals (525 samples), we characterize the impact of AD associated miRNA on human brain expression: we show that the effects of miR-132 and miR-129-5b converge on certain genes such as EP300 and find a role for miR200 and its target genes in AD using an integrated miRNA/mRNA analysis.

Conclusions: Overall, miRNAs play a modest role in human AD, but we observe robust evidence that a small number of miRNAs are responsible for specific alterations in the cortical transcriptome that are associated with AD.

Keywords: Alzheimer’s disease; Neuritic β-amyloid plaques and neurofibrillary tangles; lincRNA; microRNA.


Conflict of interest statement

Ethics approval and consent to participate

The ROS and MAP studies were approved by the Institutional Review Board of Rush University Medical Center. All subjects have given written informed consent.

Consent for publication

Not applicable.

Competing interests

The authors declare that they have no competing interests.

Publisher’s Note

Springer Nature remains neutral with regard to jurisdictional claims in published maps and institutional affiliations.

Figures

Fig. 1
Fig. 1
Validation of miRNAs associated with AD in other studies. The relationship between average miRNA expression (x-axis) and association with pathological AD in ROSMAP (y-axis) is plotted for each miRNA. The association between a miRNA and AD is calculated as a z-score after correcting for other factors; a negative z-score denotes decreased miRNA expression in the context of AD. Previously reported miRNAs [12] are highlighted by colored triangles, with red denoting higher expression in AD and blue reduced expression in AD in the original publication. The dotted horizontal line marks the z-score threshold of significance that is equivalent to a Bonferroni p-value cut-off of 0.05; none of the miRNAs with positively correlated expression are significantly associated with AD. The gray circles represent all other miRNAs tested in our study
Fig. 2
Fig. 2
Network of miRNAs associated with phenotypes. a The relationships between miRNA expression and various demographic and technical features as well as neuropathologic outcomes are displayed in a network diagram. All miRNA with a significant (p < 0.00016) or suggestive (p < 0.05) association are included in the network. These relationships were extracted via feature selection from linear models which explain an miRNA’s expression level by using age at death (Age), neuronal composition (NNLS), sex, study of origin (Study, ROS or MAP), post-mortem interval (PMI), RNA integrity number (RIN), neuritic amyloid plaques (NP), neurofibrillary tangles (NFT) and pathological AD diagnosis (AD). Each node in the diagram represents an miRNA (small circles) or a demographic or a neuropathologic variable (large circles). The significantly associated miRNA (Table 1) are represented by rectangles. A red edge represents a positive association between the miRNA and trait; a blue edge denotes an inverse association. As most of the miRNAs are associated with RIN, the associations with RIN were removed from this figure for clarity. b The correlations between the expression levels of eight miRNA and lincRNA with significant associations in our study are shown, along with correlations with the outcome variables (NP, NFT and AD). Each of the correlations are displayed in each cell of the correlation map and is colored by the strength of correlation, red for positive associations and blue for negative associations
Fig. 3
Fig. 3
An integrated analysis of miRNA and their target mRNA. a This diagram presents an overview of (1) how the miR-132:Protein acetylation miR-pathway was constructed from the KEGG pathways database and Targetscan miRNA binding target prediction database and (2) how a score was derived to assess the association of this miR-pathway combination with pathological AD diagnosis. The approach is described in greater detail elsewhere [30]. b This heatmap illustrates the relation of miR-132 with the outcome measures (AD, NP, and NFT) and the mRNA expression levels of five of its target genes that are member of a protein acetylation miR-pathway. Each column presents data from one subject. Scaled expression values for a given variable are colored from red (to denote high expression) to blue (low expression). c The relationship between miR-132 and one of its targets, EP300, is demonstrated in a scatterplot. Each dot represents one subject. d The standardized effect sizes (βSEβ) capturing the strength of the relationship between the five protein acetylation genes and AD are plotted in this panel. We highlight the relative amount of the effect size (β) which can and cannot be explained by miR-132 expression, as miR-132 is predicted to be regulating each of these genes
Fig. 4
Fig. 4
Network of lincRNAs associated with phenotypes. a The relationships between lincRNA expression and various demographic and technical features as well as neuropathologic outcomes are displayed in a network diagram. All lincRNA with a significant (p < 0.00016) or suggestive (p < 0.05) association are included in the network. These relationships were extracted via feature selection from linear models which explain an lincRNA’s expression level by using age at death (Age), neuronal composition (NNLS), sex, study of origin (Study, ROS or MAP), post-mortem interval (PMI), RNA integrity number (RIN), neuritic amyloid plaques (NP), neurofibrillary tangles (NFT) and pathological AD diagnosis (AD). Each node in the diagram represents a lincRNA (small circles) or a demographic or a neuropathologic variable (large circles). The significantly associated lincRNA (Table 1) are represented by rectangles. A red edge represents a positive association between the lincRNA and trait; a blue edge denotes an inverse association. As most of the lincRNAs are associated with RIN, the associations with RIN were removed from this figure for clarity. b The association of linc-CTSD-3 expression with each variable is plotted after fitting a model including all variables. The standardized effect size of each of these explanatory variables and 95% confidence intervals are shown. This illustrates the fact that non-coding RNAs significantly associated with AD pathology can be strongly influenced by confounding variables, but that these effects are independent

Similar articles

Cited by

References

    1. Lambert JC, Ibrahim-Verbaas CA, Harold D, Naj AC, Sims R, Bellenguez C, DeStafano AL, Bis JC, Beecham GW, Grenier-Boley B, et al. Meta-analysis of 74,046 individuals identifies 11 new susceptibility loci for Alzheimer's disease. Nat Genet. 2013;45:1452–1458. doi: 10.1038/ng.2802. - DOI - PMC - PubMed
    1. De Jager PL, Srivastava G, Lunnon K, Burgess J, Schalkwyk LC, Yu L, Eaton ML, Keenan BT, Ernst J, McCabe C, et al. Alzheimer's disease: early alterations in brain DNA methylation at ANK1, BIN1, RHBDF2 and other loci. Nat Neurosci. 2014;17:1156–1163. doi: 10.1038/nn.3786. - DOI - PMC - PubMed
    1. Berchtold NC, Coleman PD, Cribbs DH, Rogers J, Gillen DL, Cotman CW. Synaptic genes are extensively downregulated across multiple brain regions in normal human aging and Alzheimer's disease. Neurobiol Aging. 2013;34:1653–1661. doi: 10.1016/j.neurobiolaging.2012.11.024. - DOI - PMC - PubMed
    1. Rhinn H, Fujita R, Qiang L, Cheng R, Lee JH, Abeliovich A. Integrative genomics identifies APOE epsilon4 effectors in Alzheimer's disease. Nature. 2013;500:45–50. doi: 10.1038/nature12415. - DOI - PubMed
    1. Oh H, Mormino EC, Madison C, Hayenga A, Smiljic A, Jagust WJ. β-amyloid affects frontal and posterior brain networks in normal aging. NeuroImage. 2011;54:1887–1895. doi: 10.1016/j.neuroimage.2010.10.027. - DOI - PMC - PubMed