

Quantifying fat replacement of muscle by quantitative MRI in muscular dystrophy
- PMID: 28669118
- PMCID: PMC5617883
- DOI: 10.1007/s00415-017-8547-3
Quantifying fat replacement of muscle by quantitative MRI in muscular dystrophy
Abstract
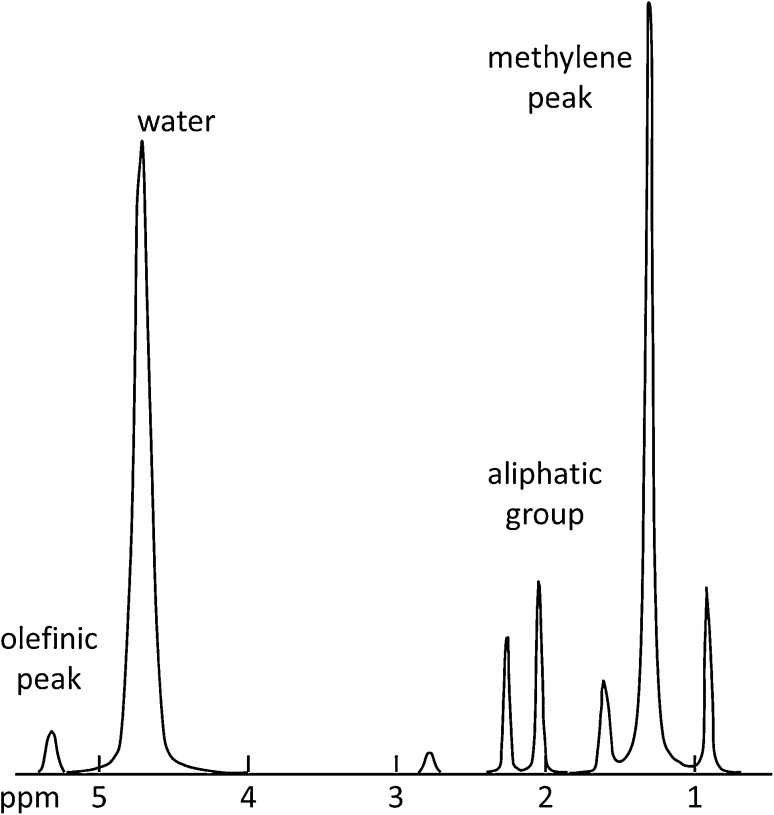
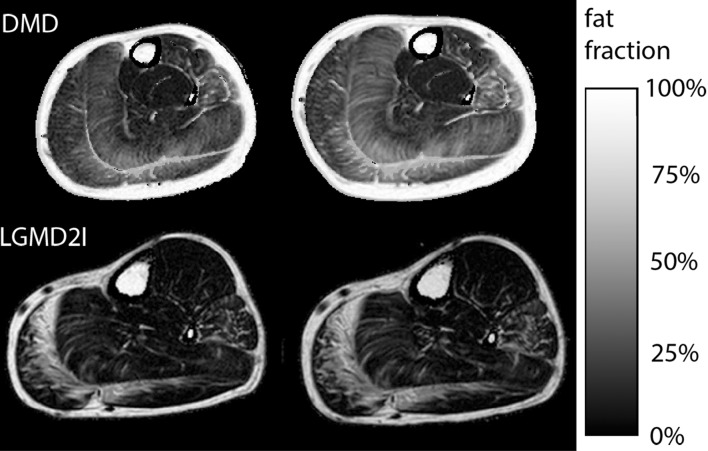
The muscular dystrophies are rare orphan diseases, characterized by progressive muscle weakness: the most common and well known is Duchenne muscular dystrophy which affects young boys and progresses quickly during childhood. However, over 70 distinct variants have been identified to date, with different rates of progression, implications for morbidity, mortality, and quality of life. There are presently no curative therapies for these diseases, but a range of potential therapies are presently reaching the stage of multi-centre, multi-national first-in-man clinical trials. There is a need for sensitive, objective end-points to assess the efficacy of the proposed therapies. Present clinical measurements are often too dependent on patient effort or motivation, and lack sensitivity to small changes, or are invasive. Quantitative MRI to measure the fat replacement of skeletal muscle by either chemical shift imaging methods (Dixon or IDEAL) or spectroscopy has been demonstrated to provide such a sensitive, objective end-point in a number of studies. This review considers the importance of the outcome measures, discusses the considerations required to make robust measurements and appropriate quality assurance measures, and draws together the existing literature for cross-sectional and longitudinal cohort studies using these methods in muscular dystrophy.
Keywords: Clinical trial; Duchenne; MRI; Muscle; Muscular dystrophy; Quantitative.
Conflict of interest statement
JB reports grant support from the European Union (FP-7-HEALTH-2013-INNOVATION-1, 602485). CDJS declares no conflicts of interest. HEK reports grants from ZonMW, AFM, Duchenne Parent Project, the European Union (FP-7-HEALTH-2013-INNOVATION-1, 602485), and Gratama Stichting, consultancy for BioMarin and aTyr Pharma and trial support from ImagingDMD-UF outside the submitted work. All reimbursements were received by the LUMC; no personal benefits were received. DF declares no conflicts of interest. GAW has received Grant funding from the National Institutes of Health, Department of Defense, Muscular Dystrophy Association, Sarepta Therapeutics and Catabasis Pharmaceuticals. KGH reports grants from the United Kingdom Medical Research Council, Diabetes UK, the European Union (H2020, 667078) and the Newcastle Healthcare Charity, consultancy for Summit pharmaceuticals and trial support from ImagingDMD-UF outside the submitted work. All reimbursements were received by Newcastle University; no personal benefits were received.
Figures
References
-
- Ellis JA, Vroom E, Muntoni F. 195th ENMC international workshop: newborn screening for Duchenne muscular dystrophy 14–16th December, 2012, Naarden, The Netherlands. Neuromuscul Disord. 2013;23(8):682–689. - PubMed
-
- Emery AE. The muscular dystrophies. Lancet. 2002;359(9307):687–695. - PubMed
-
- Mazzone E, Vasco G, Sormani MP, Torrente Y, Berardinelli A, Messina S, D’Amico A, Doglio L, Politano L, Cavallaro F, Frosini S, Bello L, Bonfiglio S, Zucchini E, De Sanctis R, Scutifero M, Bianco F, Rossi F, Motta MC, Sacco A, Donati MA, Mongini T, Pini A, Battini R, Pegoraro E, Pane M, Gasperini S, Previtali S, Napolitano S, Martinelli D, Bruno C, Vita G, Comi G, Bertini E, Mercuri E. Functional changes in Duchenne muscular dystrophy: a 12-month longitudinal cohort study. Neurology. 2011;77(3):250–256. - PubMed
-
- Vuillerot C, Girardot F, Payan C, Fermanian J, Iwaz J, De Lattre C, Berard C. Monitoring changes and predicting loss of ambulation in Duchenne muscular dystrophy with the motor function measure. Dev Med Child Neurol. 2010;52(1):60–65. - PubMed
-
- Fischmann A, Gloor M, Fasler S, Haas T, Rodoni Wetzel R, Bieri O, Wetzel S, Heinimann K, Scheffler K, Fischer D. Muscular involvement assessed by MRI correlates to motor function measurement values in oculopharyngeal muscular dystrophy. J Neurol. 2011;258(7):1333–1340. - PubMed
Publication types
MeSH terms
Grants and funding
LinkOut - more resources
Full Text Sources
Other Literature Sources
Medical
