. 2017 Jul 12;22(1):13-24.e4.
doi: 10.1016/j.chom.2017.06.006. Epub 2017 Jun 29.

Cutaneous Leishmaniasis Induces a Transmissible Dysbiotic Skin Microbiota that Promotes Skin Inflammation

Affiliations

Cutaneous Leishmaniasis Induces a Transmissible Dysbiotic Skin Microbiota that Promotes Skin Inflammation

Ciara Gimblet et al. Cell Host Microbe. .

Abstract

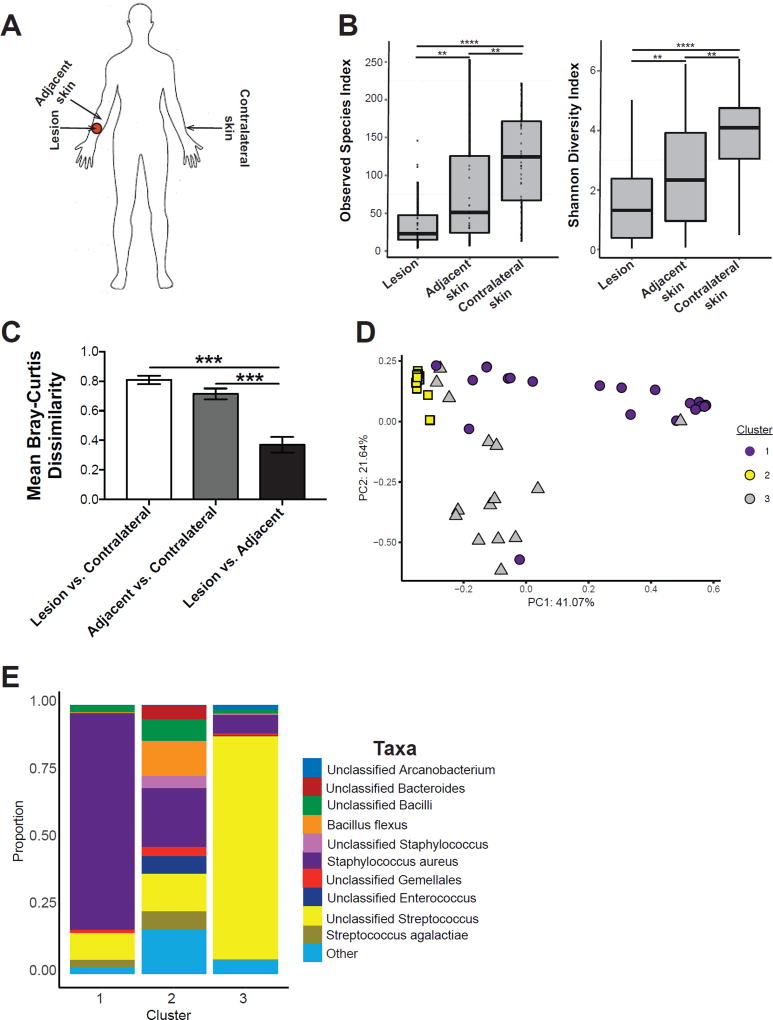
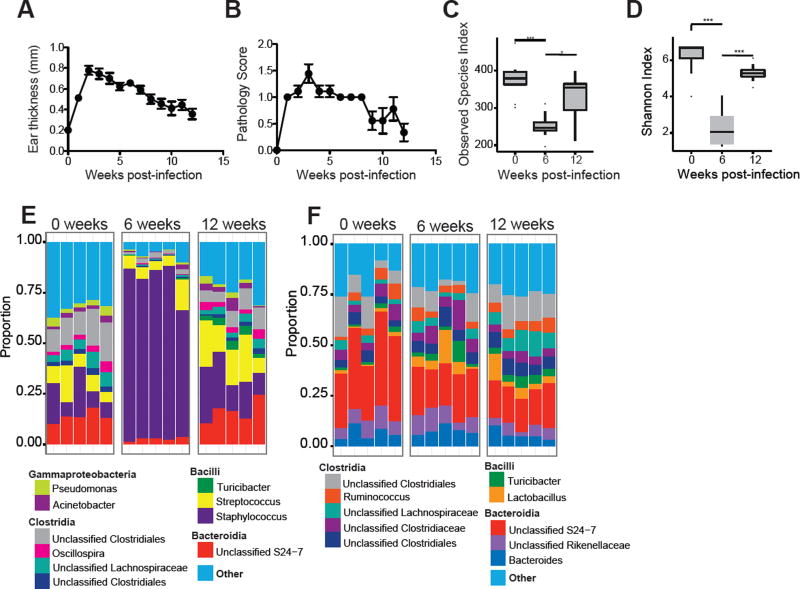
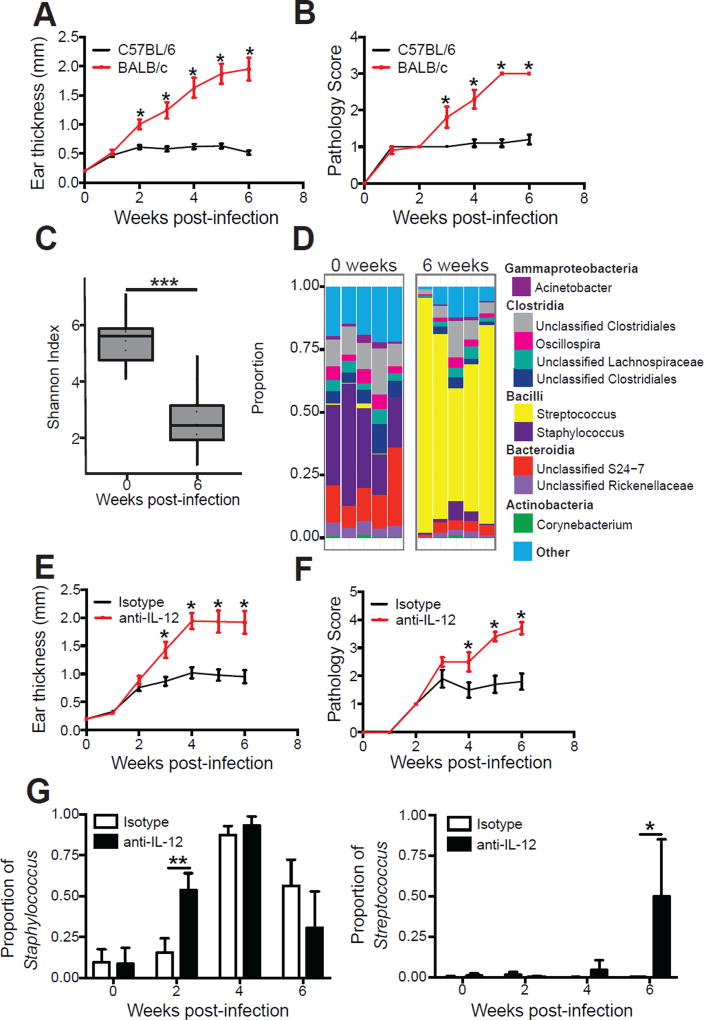
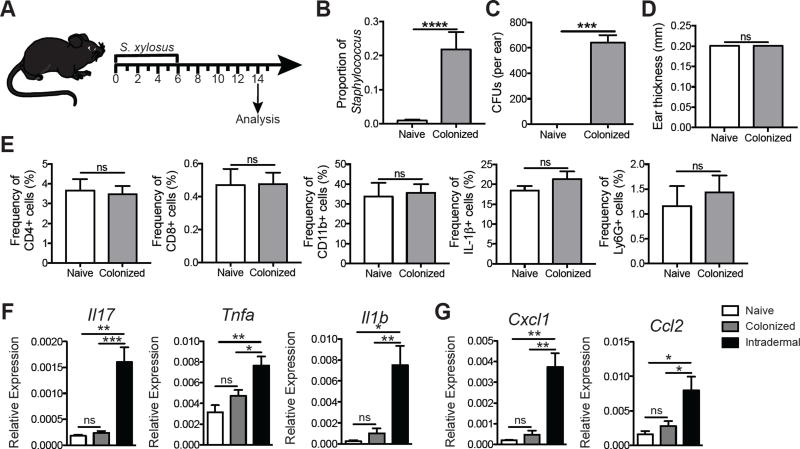
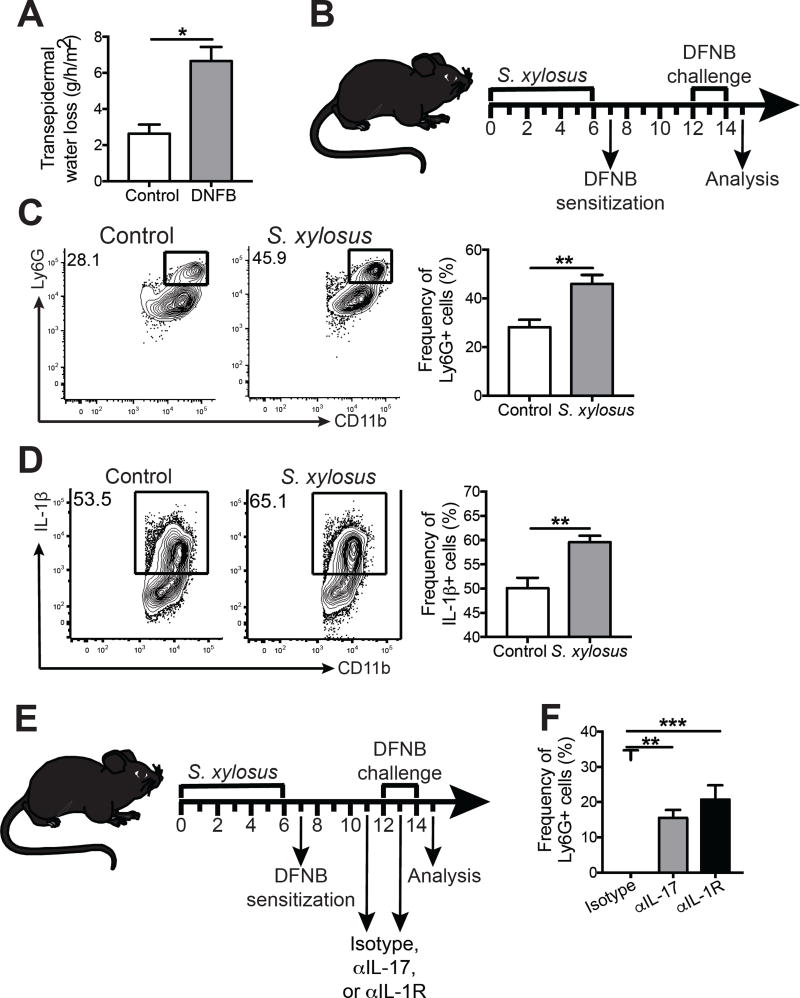
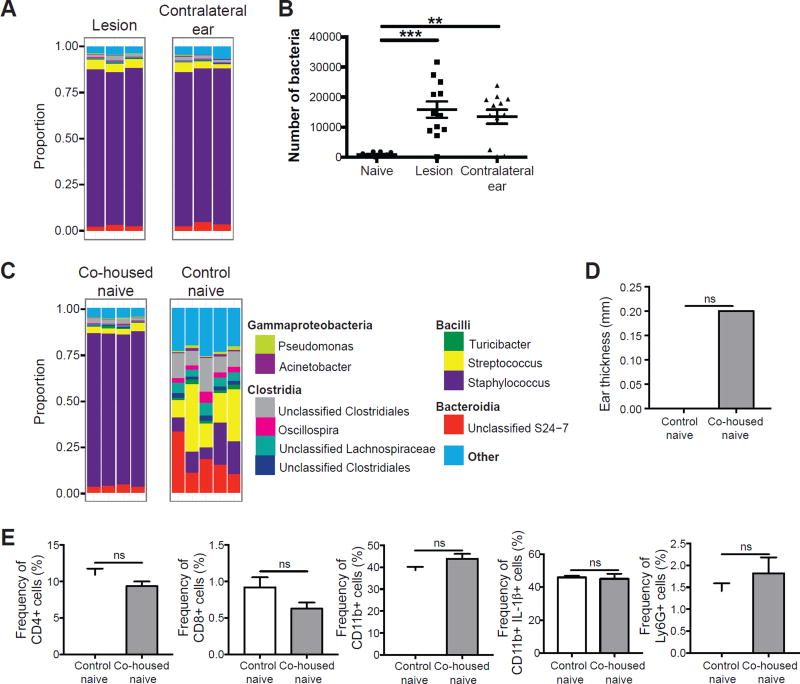
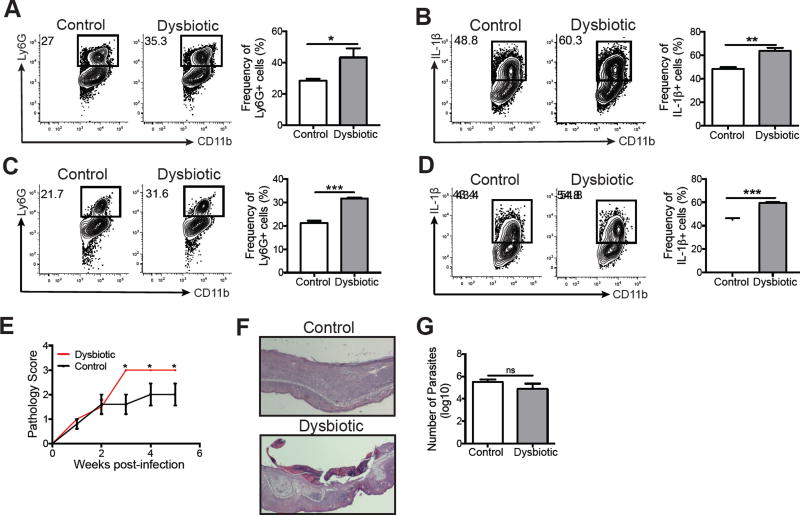
Skin microbiota can impact allergic and autoimmune responses, wound healing, and anti-microbial defense. We investigated the role of skin microbiota in cutaneous leishmaniasis and found that human patients infected with Leishmania braziliensis develop dysbiotic skin microbiota, characterized by increases in the abundance of Staphylococcus and/or Streptococcus. Mice infected with L. major exhibit similar changes depending upon disease severity. Importantly, this dysbiosis is not limited to the lesion site, but is transmissible to normal skin distant from the infection site and to skin from co-housed naive mice. This observation allowed us to test whether a pre-existing dysbiotic skin microbiota influences disease, and we found that challenging dysbiotic naive mice with L. major or testing for contact hypersensitivity results in exacerbated skin inflammatory responses. These findings demonstrate that a dysbiotic skin microbiota is not only a consequence of tissue stress, but also enhances inflammation, which has implications for many inflammatory cutaneous diseases.

Keywords: cutaneous inflammation; dysbiosis; leishmania; microbiota; skin.


Conflict of interest statement

The authors list no conflicts of interest.

Figures

Figure 1
Figure 1. Lesions from cutaneous leishmaniasis patients also have a dysbiotic skin microbiota
(A) Swabs were collected from the lesion, nearby adjacent skin, and contralateral skin sites for 16S rRNA analysis. (B) Bacterial diversity was assessed by the number of observed species-level OTUs and Shannon Index. (C) Bar charts represent intragroup mean Bray-Curtis dissimilarity between each skin site. (D) PCoA values for weighted UniFrac analysis were plotted and colored based on the Dirichilet multinomial cluster assignment. (E) Stacked bar charts represent the proportion of the top 10 taxa present in each Dirichilet cluster. Swabs were collected from an n = 44 patients. **, p < 0.01; ***, p < 0.001; ****, p , 0.0001. See also Figure S1, Table S1, and Table S2.
Figure 2
Figure 2. L. major infection alters the skin microbiota
C57BL/6 mice were intradermally infected in the ear with 2 × 10⁶ L. major parasites. (A) Lesion size and (B) pathology were assessed over 12 weeks of infection. Swabs were collected from the ear at 0, 6, and 12 weeks post-infection and bacterial diversity was assessed by (C) number of observed species-level OTUs and (D) Shannon Index. Stacked bar charts represent the proportion of the top 10 taxa present (E) from ear swabs and (F) from fecal pellets at 0, 6, and 12 weeks post-infection. Each column represents the proportion of taxa for an individual mouse. Data represent two independent experiments (n = 1 skin swab each from 15 mice and n = 1 fecal pellet each from 10 mice). *, p < 0.05; ***, p < 0.001.
Figure 3
Figure 3. Skin microbiota alterations in L. major infection are dependent on disease severity
C57BL/6 and BALB/c mice were intradermally infected with L. major parasites. Lesional severity was assessed by (A) ear thickness and (B) a pathology score over the course of infection. Swabs for sequencing of 16S rRNA genes were collected from the lesions at 0 and 6 weeks post-infection. (C) Alpha diversity was assessed by Shannon Index. (D) Stacked bar charts represent the proportion of the top 10 taxa present in each sample. Data are representative of two independent experiments (n = 1 skin swab each from 10 mice in each group). C57BL/6 mice were treated with an isotype or anti-IL-12 mAb and intradermally infected in the ear with L. major parasites. Lesional severity was assessed by (E) ear thickness and (F) a pathology score over the course of infection. Anti-IL-12 mAb treated mice were euthanized at 6 weeks post-infection due to severe disease. (G) Swabs were collected from the lesions at 2, 4 and 6 weeks post-infection and proportions of Staphylococcus and Streptococcus were assessed. Data are representative of two independent experiments (n = 1 skin swab each from 10 mice in each group). *, p < 0.05; **, p < 0.01. See also Figure S2.
Figure 4
Figure 4. Staphylococcus xylosus isolated from L. major lesions causes inflammation only when injected intradermally
(A) C57BL/6 mice were topically colonized with 108-109 S. xylosus every other day for a total of 4 applications; naïve mice were unassociated. (B) Prior to and 14 days post colonization, swabs were collected to analyze the proportion of Staphylococcus. (C) Ear lysates from naïve and S. xylosus colonized mice were cultured on mannitol salt agar plates and colony forming units were counted after overnight incubation at 37°C. (D) Ear thickness was assessed in naïve and colonized mice. (E) Flow cytometry analysis was performed for the frequency of CD4+, CD8+, and CD11b+, IL-1β+, and Ly6G+ cells in the ears of naïve or colonized mice 14 days post-association. Cells were pregated on live, singlet, CD45+ cells. Data are representative of two independent experiments (n = 1 ear tissue each from 4 mice in each group). C57BL/6 mice were topically colonized or intradermally infected in the ear with S. xylosus. Fourteen days later, skin was harvested and mRNA expression was assessed for (E) cytokine and (F) chemokine genes. Data are representative of one experiment (n = 1 ear tissue each from 5 mice in each group). ns = not significant; *, p < 0.05; **, p < 0.01; ***, p < 0.001; ****, p , 0.0001. See also Figure S3.
Figure 5
Figure 5. S. xylosus colonization exacerbates skin inflammation during contact hypersensitivity
(A) C57BL/6 mice were sensitized with DNFB or vehicle control on the belly and challenged with DNFB or vehicle 5 days later. Transepidermal water loss was measured on ear skin of vehicle control and DNFB treated mice. (B) C57BL/6 mice were topically associated with 108-109 S. xylosus every other day for a total of 4 applications and control C57BL/6 mice were left unassociated. The next day, control and S. xylosus associated mice were sensitized on the belly with DNFB. 5 days later, control and S. xylosus associated mice were challenged with DNFB. Representative flow cytometry plots and graphs depict the expression of (C) CD11b+ Ly6G+ cells and (D) CD11b+ IL-1β+ cells. (E) C57BL/6 mice were topically associated with 108-109 S. xylosus every other day for a total of 4 applications and then treated with isotype, anti-IL-17, or anti-IL-1R mAbs prior to sensitization and challenge with DNFB. (F) Graphs depict the expression of CD11b+ Ly6G+ cells in the skin of treated mice. All data are representative of two independent experiments (n = 1 ear tissue each from 5 mice in each group). *, p < 0.05; **, p < 0.01; ***, p < 0.001. See also Figure S4.
Figure 6
Figure 6. L. major induced dysbiosis is transmissible to uninfected skin
(A) C57BL/6 mice were intradermally infected with L. major and swabs were collected from the infected and contralateral ears at 6 weeks post-infected for 16S rRNA gene analysis. Stacked bar charts represent the proportion of the top 10 taxa present in each sample. Data are representative of three independent experiments (n = 1 swab of each ear from 15 mice). (B) Swabs from naïve or L. major infected C57BL/6 mice were cultured on mannitol salt agar plates and CFUs were counted to determine bacteria burden. Data are representative of 1 experiment (For naïve group, n = 1 swab from the ear of 10 mice; for infected and contralateral ears, n = 1 swab of each ear from 12 mice). (C) Naïve C57BL/6 mice were co-housed with L. major infected mice for 6 weeks, while control naïve mice were housed separately. Swabs were collected from co-housed naïve and control naïve mice. Stacked bar charts represent the proportion of taxa present in each sample. Data are representative of two independent experiments (For infected group, n = 1 swab of each ear from 15 mice; for co-housed naïve, n = 1 swab of one ear from 10 mice; for control naïve, n = 1 swab of one ear from 5 mice). (D) Bar graphs depict ear thickness of control and co-housed naïve mice. (E) Cells were isolated from the ears of co-housed naïve mice and control naïve mice to assess for CD4+, CD8+, and CD11b+, IL-1β+, and Ly6G+ cells by flow cytometry. Data are representative of one experiment (Co-housed naïve, n = 1 ear tissue each from 4 mice; control naïve, n = 1 ear tissue each from 5 mice). ns = not significant; **, p < 0.01; ***, p < 0.001. See also Figure S5.
Figure 7
Figure 7. Dysbiosis exacerbates inflammation during DNFB treatment and L. major infection
Naïve C57BL/6 mice acquired dysbiotic microbiota after co-housing with L. major infected mice for 6 weeks. Control and dysbiotic mice were then sensitized and challenged with DNFB. Representative flow cytometry plots and graphs of skin cells depict the expression of (A) CD11b+ Ly6G+ cells and (B) CD11b+ IL-1β+ cells. Control and dysbiotic mice were intradermally infected with L. major parasites and the cells from the lesions were collected at 5 weeks post-infection. Representative flow cytometry plots and graphs of skin cells depict the expression of (C) CD11b+ Ly6G+ cells and (D) CD11b+ IL-1β+ cells. (E) A pathology score was used to assess disease severity over 5 weeks post-infection. (F) Representative ear skin sections stained with hemotoxylin and eosin of L. major infected control and dysbiotic mice. (G) Parasite burdens were assessed using a limiting dilution assay after 5 weeks post-infection. Data are representative of two independent experiments (For dysbiotic group, n = 1 ear tissue each from 4 mice; for control group, n = 1 ear tissue each from 5 mice). ns = not significant; *, p < 0.05; **, p < 0.01; ***, p < 0.001; ****.

Similar articles

Cited by

References

    1. Aguiar MG, Pereira AM, Fernandes AP, Ferreira LA. Reductions in skin and systemic parasite burdens as a combined effect of topical paromomycin and oral miltefosine treatment of mice experimentally infected with leishmania (leishmania) amazonensis. Antimicrob Agents Chemother. 2010;54:4699–4704. - PMC - PubMed
    1. Antonelli LR, Dutra WO, Almeida RP, Bacellar O, Carvalho EM, Gollob KJ. Activated inflammatory T cells correlate with lesion size in human cutaneous leishmaniasis. Immunol. Lett. 2005;101:226–230. - PubMed
    1. Atarashi K, Tanoue T, Oshima K, Suda W, Nagano Y, Nishikawa H, Fukuda S, Saito T, Narushima S, Hase K, et al. Treg induction by a rationally selected mixture of clostridia strains from the human microbiota. Nature. 2013;500:232–236. - PubMed
    1. Ben Salah A, Ben Messaoud N, Guedri E, Zaatour A, Ben Alaya N, Bettaieb J, Gharbi A, Belhadj Hamida N, Boukthir A, Chlif S, et al. Topical paromomycin with or without gentamicin for cutaneous leishmaniasis. N. Engl. J. Med. 2013;368:524–532. - PubMed
    1. Canesso MC, Vieira AT, Castro TB, Schirmer BG, Cisalpino D, Martins FS, Rachid MA, Nicoli JR, Teixeira MM, Barcelos LS. Skin wound healing is accelerated and scarless in the absence of commensal microbiota. J. Immunol. 2014;193:5171–5180. - PubMed

MeSH terms