. 2017 Jul 10;27(13):1915-1927.e5.
doi: 10.1016/j.cub.2017.05.089. Epub 2017 Jun 29.

A Peptidergic Circuit Links the Circadian Clock to Locomotor Activity

Affiliations

A Peptidergic Circuit Links the Circadian Clock to Locomotor Activity

Anna N King et al. Curr Biol. .

Abstract

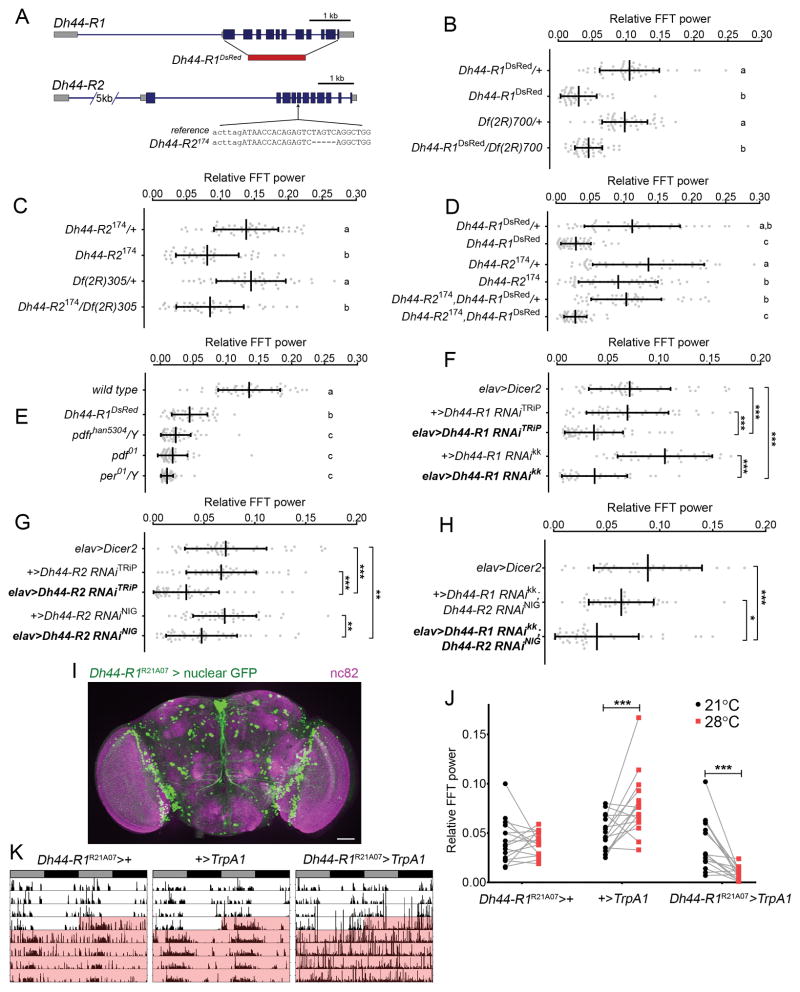
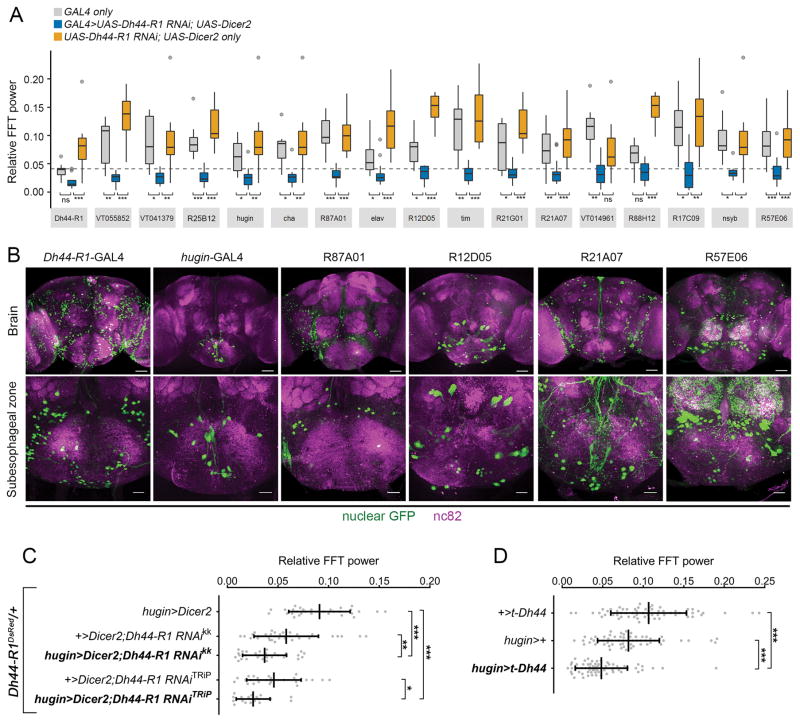
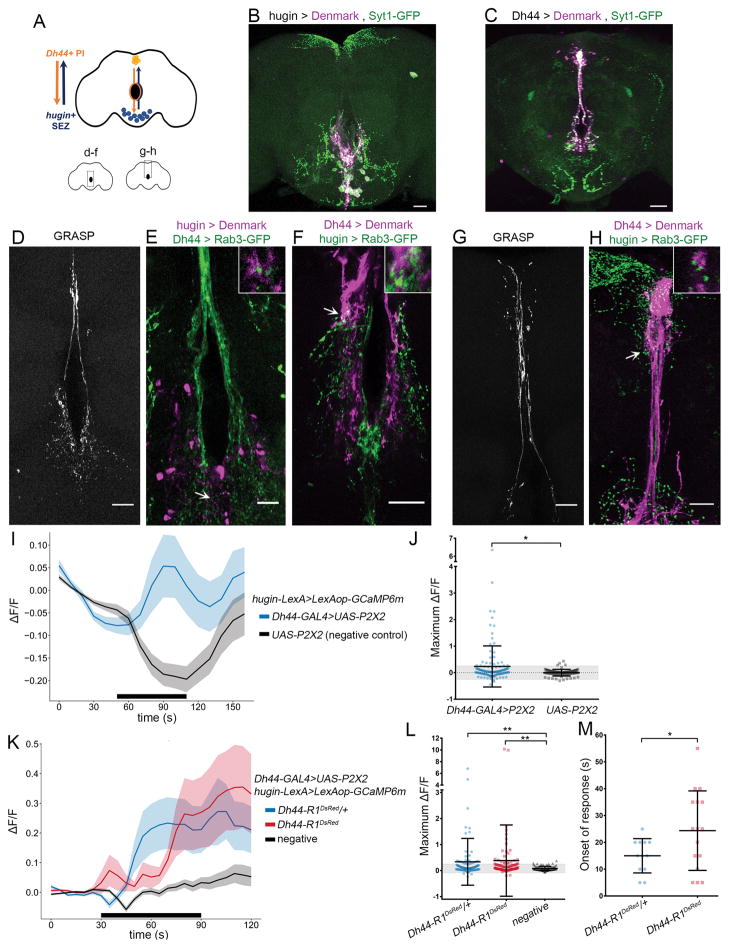
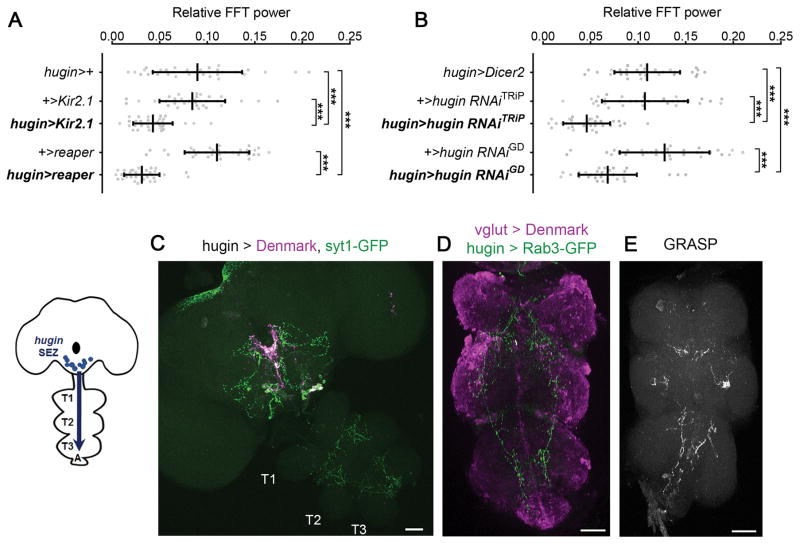
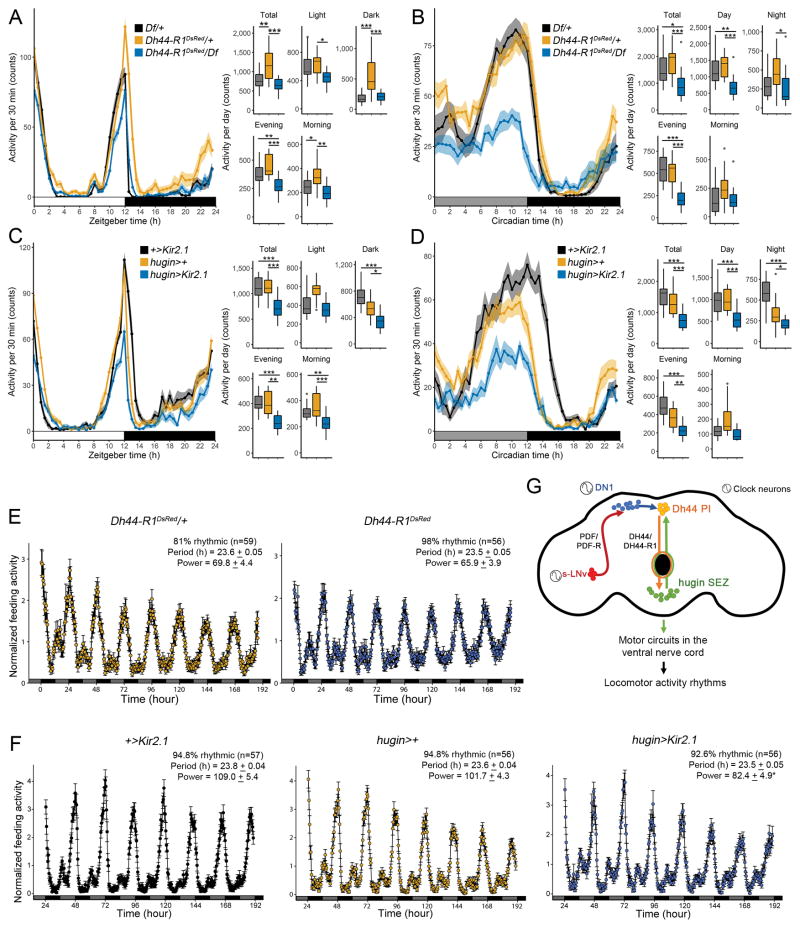
The mechanisms by which clock neurons in the Drosophila brain confer an ∼24-hr rhythm onto locomotor activity are unclear, but involve the neuropeptide diuretic hormone 44 (DH44), an ortholog of corticotropin-releasing factor. Here we identified DH44 receptor 1 as the relevant receptor for rest:activity rhythms and mapped its site of action to hugin-expressing neurons in the subesophageal zone (SEZ). We traced a circuit that extends from Dh44-expressing neurons in the pars intercerebralis (PI) through hugin+ SEZ neurons to the ventral nerve cord. Hugin neuropeptide, a neuromedin U ortholog, also regulates behavioral rhythms. The DH44 PI-Hugin SEZ circuit controls circadian locomotor activity in a daily cycle but has minimal effect on feeding rhythms, suggesting that the circadian drive to feed can be separated from circadian locomotion. These findings define a linear peptidergic circuit that links the clock to motor outputs to modulate circadian control of locomotor activity.

Keywords: DH44; Drosophila; Hugin; behavior; circadian rhythms; circuits; feeding; locomotion.


Figures

Figure 1
Figure 1. DH44 Receptors Regulate Rest:Activity Rhythms
(A) Sequence alterations to Dh44-R1 and Dh44-R2 loci. Blue denotes the coding DNA sequence, and red denotes the replacement of Dh44-R1 with the DsRed sequence. (B–D) Amplitude of circadian rest:activity rhythms under constant darkness (DD) represented by FFT power (mean ± SD) for Dh44-R1DsRed mutants (B), Dh44-R2174 mutants (C), Dh44-R2174,Dh44-R1DsRed double mutants (D), and their heterozygous controls. (E) Amplitude of rest:activity rhythms in Dh44-R1DsRed mutants, clock output mutants (Pdf01 and Pdfrhan5304), and clock mutant (per01). (F–H) Amplitude of rest:activity rhythms under DD conditions represented by FFT power (mean ± SD) for flies with RNAi-mediated knockdown of Dh44-R1 (F), Dh44-R2 (G), or both Dh44-R1 and Dh44-R2 (H) in all neurons. *p < 0.05, **p < 0.01, ***p < 0.001 by Sidak’s test following one-way ANOVA. (I) Brain with Dh44-R1R21A07-GAL4+ neurons labeled with nuclear GFP (green) and counterstained with nc82 (anti-bruchpilot; magenta). Scale bar, 50 μm. (J) FFT power for rest:activity rhythms at 21°C (black) and 28°C (red). ***p < 0.00093 by Sidak’s test following two-way repeated-measure ANOVA. (K) Representative records of individual fly activity in DD for 4 days at 21°C and then for 4 days at 28°C for TrpA1 activation (red). In (B)–(E), groups with the same letter are not significantly different from each other (p > 0.05 by Tukey’s test following one-way ANOVA). See also Figures S1 and S2 and Tables S1 and S2.
Figure 2
Figure 2. Dh44-R1 in hugin+ Neurons Regulates Rest:Activity Rhythms
(A) Amplitude (FFT values) of circadian rest:activity rhythms in flies with different GAL4s driving Dh44-R1 RNAi knockdown (blue) and GAL4 genetic controls (gray and orange). 17 GAL4 lines that yielded the weakest rhythms by FFT analysis are shown from the GAL4 screen. Data are summarized with Tukey’s boxplots. The gray dashed line denotes 1 SD below the average FFT value of the RNAi knockdown phenotype from all 168 GAL4 lines screened. (B) Images of SEZ-localized and -proximal GAL4 hits expressing nuclear GFP (green) in the brain (scale bars, 50 μm) and SEZ (scale bars, 20 μm). Brains were counterstained with nc82 (magenta). (C) Amplitude of rest:activity rhythms with Dh44-R1 knocked down in hugin+ neurons in a Dh44-R1DsRed heterozygous background and genetic control flies under DD conditions. (D) Amplitude of rest:activity rhythms under DD conditions in flies expressing a transgenic tethered DH44 peptide in hugin+ neurons (hugin>t-Dh44). In (C) and (D), data are shown as mean ± SD. *p < 0.05, **p < 0.01, ***p < 0.001 by Sidak’s test following one-way ANOVA; ns, not significant. See also Figure S3 and Tables S1 and S2.
Figure 3
Figure 3. hugin+ Neurons in the SEZ Receive Inputs from Dh44+ PI Neurons
(A) Schematic of a circuit between Dh44+ neurons in the pars intercerebralis (PI) and hugin+ neurons in the subesophageal zone (SEZ). (B and C) hugin-GAL4 (B) or Dh44-GAL4 (C) expressing presynaptic (syt1-GFP; green) and postsynaptic markers (Denmark; magenta) in the brain. (D) Neurexin-GRASP signal near the esophagus in a brain expressing Dh44-GAL4>UAS-neurexin-spGFP1-10; hugin-LexA>LexAop-CD4-spGFP11. (E) Dh44+ axon terminals (green) and hugin+ dendrites (magenta) near the esophagus in the brain. (F) Hugin+ axon terminals (green) and Dh44+ dendrites (magenta) near the esophagus in the brain. (G) Neurexin-GRASP signal in the PI of a brain expressing Dh44-GAL4>UAS-neurexin-spGFP1-10; hugin-LexA>LexAop-CD4-spGFP11. (H) hugin+ axon terminals (green) and Dh44+ dendrites (magenta) in the PI. (I) GCaMP signal over time in hugin+ neurons with activation of Dh44+ cells (blue; n = 129 cells, 11 brains) or no activation (black; n = 83 cells, 8 brains). The black bar denotes duration of ATP application. Data are represented as mean ± SEM. (J) Maximum GCaMP change (ΔF/F) in individual cells. Mean ± SD. The shaded gray region indicates within 2 SD of the mean value for the UAS-P2X2 group. *p = 0.0119 by Mann-Whitney test. U = 4259, Z = ~2.51. (K) GCaMP signal over time in hugin+ neurons upon activation of Dh44+ cells in Dh44-R1DsRed/+ heterozygotes (blue; n = 99 cells, 9 brains) or Dh44-R1DsRed mutants (red; n = 108 cells, 11 brains). Negative control is UAS-P2X2; hugin-LexA>LexAop-GCaMP6m in Dh44-R1DsRed/+ heterozygotes (black; n = 82 cells, 7 brains). The black bar denotes duration of ATP application. Data are represented as mean ± SEM. (L) Maximum GCaMP change (ΔF/F) in individual cells. Mean ± SD. The shaded gray region indicates within 2 SD of the mean for the negative control group. **p < 0.005 by Kruskal-Wallis test followed by Dunn’s test. (M) Onsets of response in Dh44-R1DsRed mutants and heterozygotes. Mean ± SD. *p = 0.0339 by two-tailed Welch’s t test. Insets in (E), (F), and (H) show 3× magnification of a single confocal section from the regions indicated by arrows. Scale bars, 35 μm (B and C), 20 μm (D and F–H), and 10 μm (E). See also Table S2.
Figure 4
Figure 4. hugin+ Neurons Are Circadian Output Neurons that Project to the Ventral Nerve Cord
(A) Amplitude of rest:activity rhythms in control flies and flies with hugin+ neurons silenced (hugin>Kir2.1) or ablated (hugin>reaper) under DD conditions. (B) Amplitude of rest:activity rhythms in control flies and flies with RNAi-mediated knockdown of hugin in hugin+ neurons. (C) hugin-GAL4 expressing postsynaptic Denmark (magenta) and presynaptic syt1-GFP (green) markers in the central brain and VNC. The VNC is formed of first (T1), second (T2), and third (T3) thoracic and abdominal ganglia (A). (D) hugin-LexA expressing presynaptic Rab3-GFP (green) and vglut-GAL4 expressing Denmark (magenta) markers in the VNC. (E) GRASP signal in the VNC of flies expressing vglut-GAL4>UAS-CD4-spGFP1-10; hugin-LexA>LexAop-CD4-spGFP11. In (A) and (B), data are shown as mean ± SD. ***p < 0.001 by Sidak’s test following one-way ANOVA. Scale bars, 50 μm (C–E). See also Figure S4 and Tables S1 and S2.
Figure 5
Figure 5. Neuropeptide Levels in Projections of hugin+ Neurons Are Regulated by the Circadian Clock
(A) ANF-GFP signal in VNCs from wild-type or per01 flies expressing hugin>ANF-GFP. Scale bar, 50 μm. Close-ups of the boxed regions (top) are shown in the middle and bottom rows to highlight the ANF-GFP and corresponding myr-RFP (red fluorescent protein) signals, respectively. (B) Tukey’s boxplots of ANF-GFP fluorescence levels in the entire VNC. n = 10–15 flies/time point and genotype. *p < 0.0359 by two-way ANOVA and Tukey’s test for comparison within genotype. See also Figure S4 and Table S2.
Figure 6
Figure 6. The DH44-Hugin Circuit Alters Locomotor Activity without Affecting Feeding
(A and B) Locomotor activity profiles of Dh44-R1DsRed/Df mutants averaged over 3 days in LD (A) or DD (B). (C and D) Locomotor activity profiles of hugin>Kir2.1 flies averaged over 3 days in LD (C) or DD (D). (A–D) Traces (left) show activity counts/30 min (mean ± SEM). Tukey’s boxplots (right) summarize the distribution of activity counts per day during a total 24-hr day, day (ZT or CT 0–12), night (ZT or CT 12–24), evening (ZT or CT 9–13), and morning (ZT or CT 21–1). n = 15–16/genotype. CT, circadian time. (E and F) Normalized feeding activity in Dh44-R1DsRed/+ and Dh44-R1DsRed flies (E) and hugin>Kir2.1 and genetic control flies (F) in DD conditions. Period and power data are summarized as mean ± SEM. (G) Model of a circadian output circuit for locomotor activity rhythms in Drosophila. The circuit extends from the master pacemaker sLNvs (red), through DN1 clock neurons (blue), and to Dh44+ PI neurons (orange). This circadian output circuit continues through hugin+ SEZ neurons (green) to the VNC. *p < 0.05, **p < 0.01, ***p < 0.001 by one-way ANOVA and Tukey’s test. See also Figure S5 and Table S2.

Similar articles

Cited by

References

    1. Yao Z, Shafer OT. The Drosophila circadian clock is a variably coupled network of multiple peptidergic units. Science. 2014;343:1516–1520. - PMC - PubMed
    1. Peng Y, Stoleru D, Levine JD, Hall JC, Rosbash M. Drosophila free-running rhythms require intercellular communication. PLoS Biol. 2003;1:E13. - PMC - PubMed
    1. Renn SC, Park JH, Rosbash M, Hall JC, Taghert PH. A pdf neuropeptide gene mutation and ablation of PDF neurons each cause severe abnormalities of behavioral circadian rhythms in Drosophila. Cell. 1999;99:791–802. - PubMed
    1. Grima B, Chelot E, Xia R, Rouyer F. Morning and evening peaks of activity rely on different clock neurons of the Drosophila brain. Nature. 2004;431:869–873. - PubMed
    1. Lin Y, Stormo GD, Taghert PH. The neuropeptide pigment-dispersing factor coordinates pacemaker interactions in the Drosophila circadian system. J Neurosci. 2004;24:7951–7957. - PMC - PubMed

MeSH terms