. 2017 Sep:158:430-440.
doi: 10.1016/j.neuroimage.2017.06.047. Epub 2017 Jun 29.

Thalamus segmentation using multi-modal feature classification: Validation and pilot study of an age-matched cohort

Affiliations

Thalamus segmentation using multi-modal feature classification: Validation and pilot study of an age-matched cohort

Jeffrey Glaister et al. Neuroimage. 2017 Sep.

Abstract

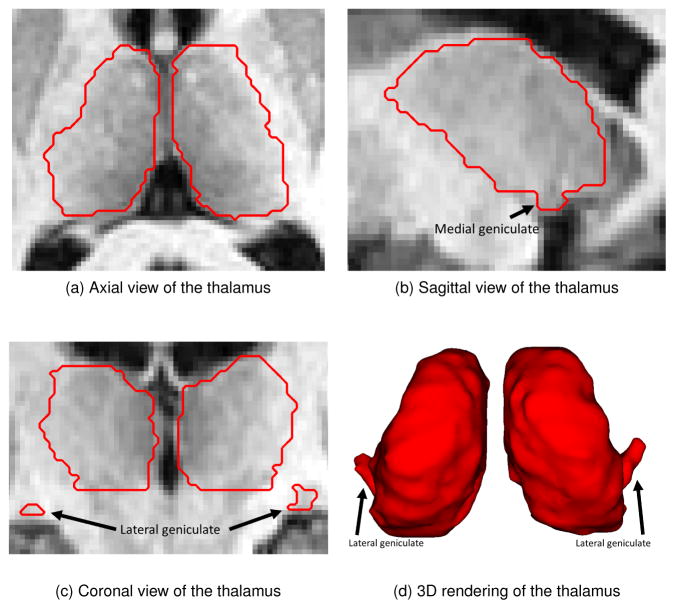
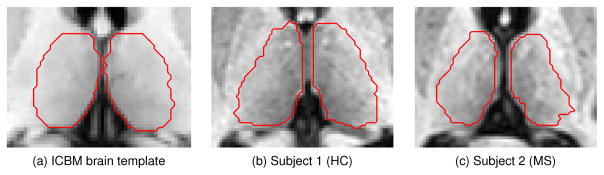
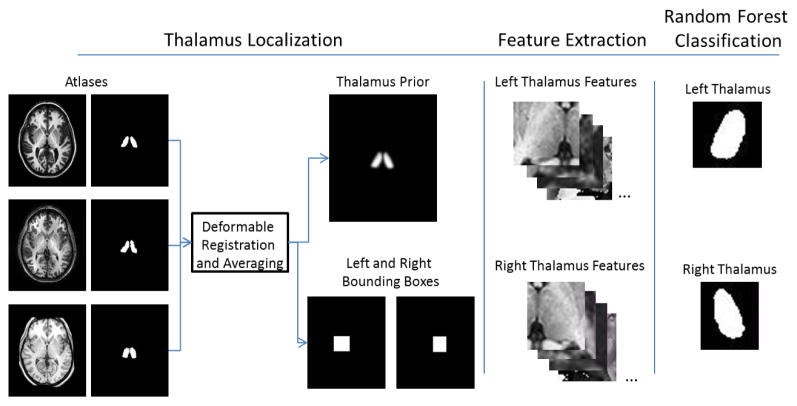
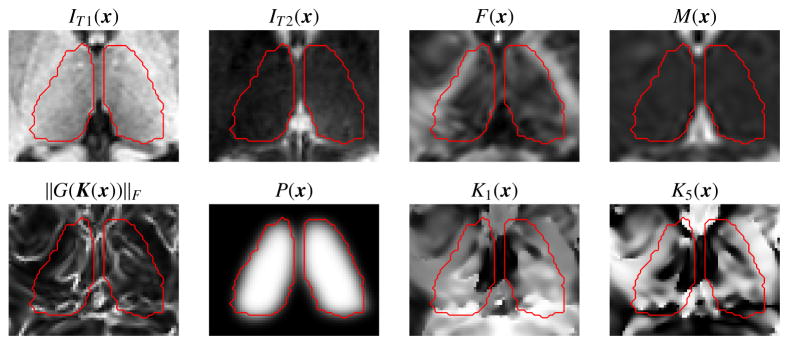
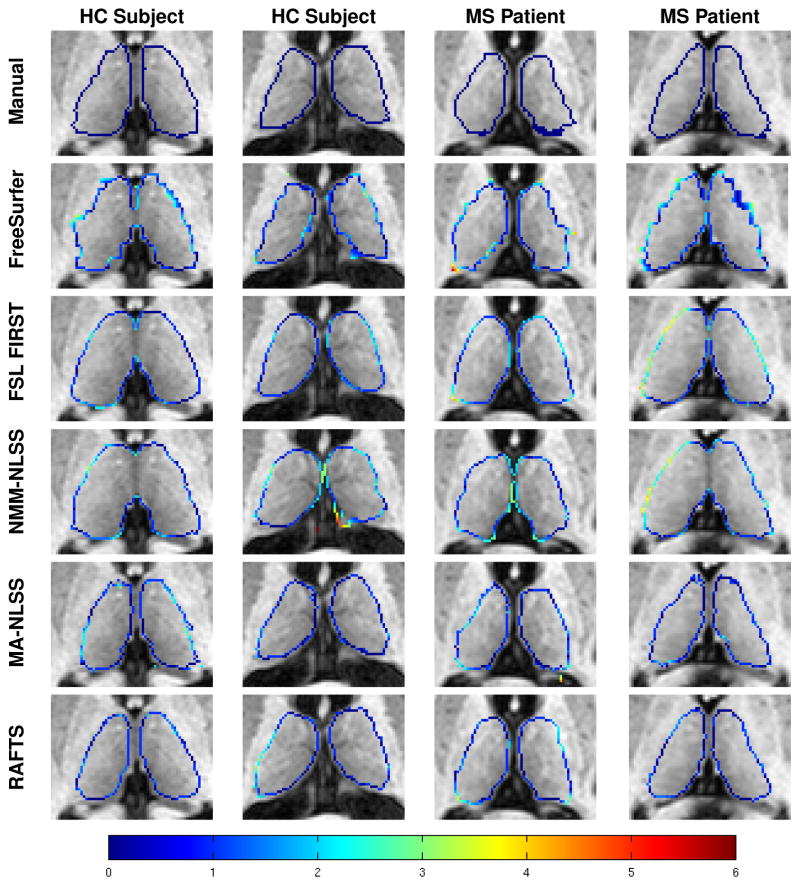
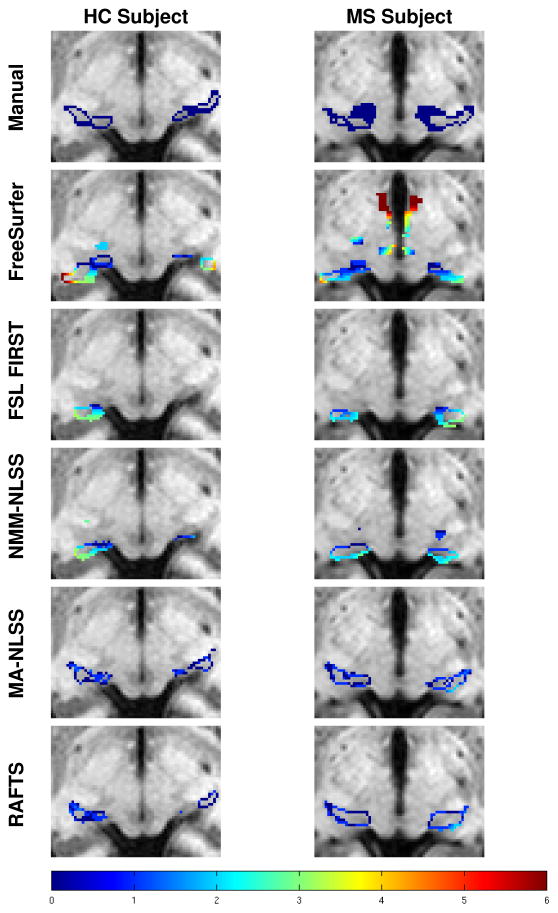
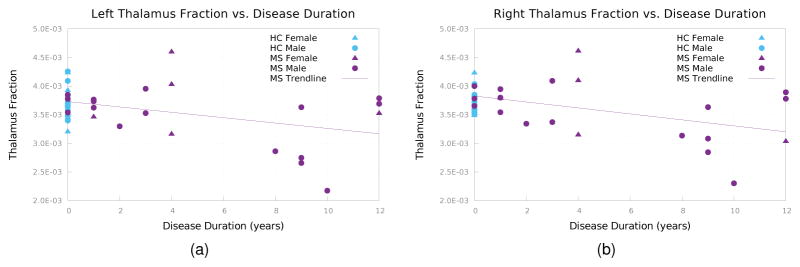
Automatic segmentation of the thalamus can be used to measure differences and track changes in thalamic volume that may occur due to disease, injury or normal aging. An automatic thalamus segmentation algorithm incorporating features from diffusion tensor imaging (DTI) and thalamus priors constructed from multiple atlases is proposed. Multiple atlases with corresponding manual thalamus segmentations are registered to the target image and averaged to generate the thalamus prior. At each voxel in a region of interest around the thalamus, a multidimensional feature vector that includes the thalamus prior as well as a set of DTI features, including fractional anisotropy, mean diffusivity, and fiber orientation is formed. A random forest is trained to classify each voxel as belonging to the thalamus or background within the region of interest. Using a leave-one-out cross-validation on nine subjects, the proposed algorithm achieves a mean Dice score of 0.878 and 0.890 for the left and right thalami, respectively, which are higher Dice scores than the three state-of-art methods we compared to. We demonstrate the utility of the method with a pilot study exploring the difference in the thalamus fraction between 21 multiple sclerosis (MS) patients and 21 age-matched healthy controls. The left and right thalamic volumes (normalized by intracranial volumes) are larger in healthy controls by 7.6% and 7.3% respectively, compared to MS patients (though neither result is statistically significant).

Keywords: Diffusion MRI; Magnetic resonance imaging; Thalamus segmentation.


Figures

Figure 1
Figure 1
Examples of the thalamus anatomy (outlined as a red contour) overlaid on a T1-w MRI. The black arrows in the coronal and sagittal views as well as in the volumetric rendering show the locations of the medial and lateral geniculates.
Figure 2
Figure 2
Examples of the atlases with the manual segmentation of the thalamus outlined in red.
Figure 3
Figure 3
Graphical summary of RAFTS.
Figure 4
Figure 4
Shown are several of the features used in our approach, including the T1-w intensity (IT1(x)), T2-w intensity (IT2(x)), fractional anisotropy (F(x)), mean diffusivity (M(x)), edge map (|G(K(x))|F), the multi-atlas prior (P(x)), and two of the Knutsson space components (K1(x) and K5(x)). The red outline indicates the manually delineated ground truth.
Figure 5
Figure 5
Examples of the manual segmentations on two HCs and two MS patients generated by the two raters following the protocol outlined in Sec. 2.2 and described in detail in Appendix A. Colored voxels are boundary voxels of the thalamus. The color of the contour indicates the absolute minimum distance from a voxel on the surface generated by one rater to the surface of the other rater, with the scale of the distance shown in the color bar in the bottom row.
Figure 6
Figure 6
Bland Altman plots of left and right thalamus volume from manual segmentations generated by the two raters. The solid blue line indicates the mean difference and the dashed red lines indicate the 95% limits of agreement.
Figure 7
Figure 7
Bland Altman plots of left and right thalamus volume comparing the manual segmentations from Rater #1 and the automatic segmentation generated by RAFTS. The solid blue line indicates the mean difference and the dashed red lines indicate the 95% limits of agreement.
Figure 8
Figure 8
Examples of thalamus segmentations shown with a colored contour overlaid on the corresponding axial T1- w MR image. The rows from top to bottom are the ground truth manual segmentation of Rater #1, and segmentations generated by FreeSurfer, FSL FIRST, NMM-NLSS, MA-NLSS, and RAFTS, respectively. The columns show two example healthy control (HC) subjects and two MS patients. The color contour indicates the absolute minimum distance from a voxel on the surface of the segmentation to the manually delineated surface of Rater #1 (top row). The color bar in the bottom row shows the scale of the distance.
Figure 9
Figure 9
Examples of thalamus segmentations of the lateral and medial geniculates shown with a colored contour overlaid on an inferior axial T1-w MR slice. The rows from top to bottom are the ground truth manual segmentation of Rater #1, and segmentations generated by FreeSurfer, FSL FIRST, NMM-NLSS, MA-NLSS, and RAFTS, respectively. The columns show an example healthy control (HC) subject and MS patient. The color contour indicates the minimum distance from a voxel on the surface of a segmentation to the manually delineated surface of Rater #1.
Figure 10
Figure 10
Thalamus fraction vs. disease duration for (a) the left thalamus and (b) right thalamus.

References

    1. Aljabar P, Heckemann RA, Hammers A, Hajnal JV, Rueckert D. Multi-atlas based segmentation of brain images: atlas selection and its effect on accuracy. Neuroimage. 2009;46:726–738. - PubMed
    1. Anbazhagan P, Carass A, Bazin PL, Prince JL. Automatic Estimation of Mid Sagittal Plane and AC-PC alignment based on Nonrigid Registration. 3rd International Symposium on Biomedical Imaging (ISBI 2006); 2006. pp. 828–831.
    1. Asman AJ, Landman BA. Non-local statistical label fusion for multi-atlas segmentation. Medical Image Analysis. 2013;17:194–208. - PMC - PubMed
    1. Basser PJ, Pierpaoli C. Microstructural and physiological features of tissues elucidated by quantitativediffusion-tensor MRI. Journal of Magnetic Resonance, Series B. 1996;111:209–219. - PubMed
    1. Bazin PL, Pham DL. Homeomorphic brain image segmentation with topological and statistical atlases. Medical Image Analysis. 2008;12:616–625. - PMC - PubMed

Publication types