

Elastofibroma dorsi
- PMID: 28670080
- PMCID: PMC5468038
- DOI: 10.1080/08998280.2017.11929641
Elastofibroma dorsi
Abstract
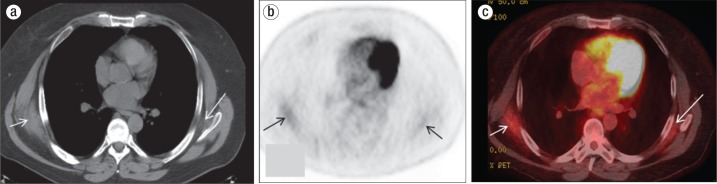
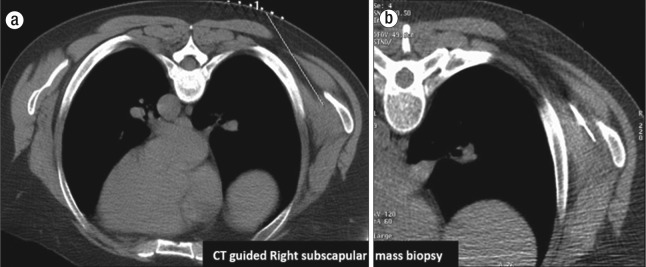
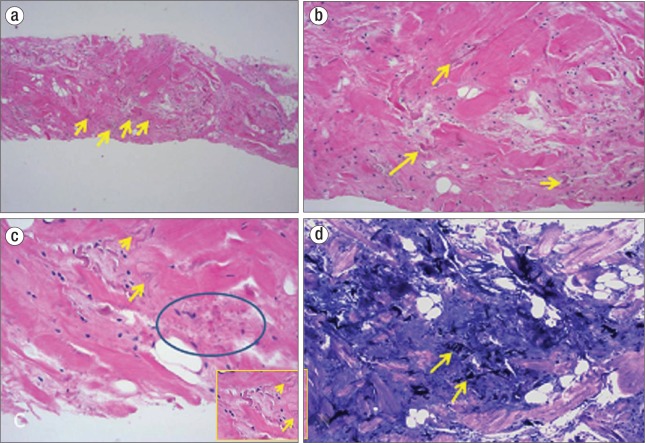
We present a 60-year-old man with biopsy-proven metastatic squamous cell carcinoma of the right inguinal and external iliac lymph nodes with unknown primary. Hypermetabolic soft tissue masses were identified in bilateral subscapular regions on follow-up positron emission tomography (PET)-computed tomography (CT) after completion of chemoradiation. The right subscapular mass was biopsied under CT guidance, and histopathology showed it to be elastofibroma dorsi. Elastofibroma dorsi is a benign tumor with no malignant potential; due to its ill-defined appearance and tracer uptake on PET-CT, it can be misdiagnosed as soft tissue sarcoma. This report describes the typical location and imaging features of this incidental hypermetabolic mass.
Figures
References
-
- Jarvi O, Saxen E. Elastofibroma dorsi. Acta Pathol Microbiol Scand Suppl. 1961;51(Suppl 144):83–84. - PubMed
-
- Fibla J, Molins L, Marco V, Pérez J, Vidal G. Bilateral elastofibroma dorsi. Joint Bone Spine. 2007;74(2):194–196. - PubMed
-
- Nagamine N, Nohara Y, Ito E. Elastofibroma in Okinawa. A clinicopathologic study of 170 cases. Cancer. 1982;50(9):1794–1805. - PubMed
-
- Mirra JM, Straub LR, Jarvi OH. Elastofibroma of the deltoid. A case report. Cancer. 1974;33(1):234–238. - PubMed
-
- Enjoji M, Sumiyoshi K, Sueyoshi K. Elastofibromatous lesion of the stomach in a patient with elastofibroma dorsi. Am J Surg Pathol. 1985;9(3):233–237. - PubMed
Publication types
LinkOut - more resources
Full Text Sources
Other Literature Sources