. 2017 Jun 16:11:1789-1802.
doi: 10.2147/DDDT.S138320. eCollection 2017.

Morusin shows potent antitumor activity for human hepatocellular carcinoma in vitro and in vivo through apoptosis induction and angiogenesis inhibition

Affiliations

Morusin shows potent antitumor activity for human hepatocellular carcinoma in vitro and in vivo through apoptosis induction and angiogenesis inhibition

Ling Gao et al. Drug Des Devel Ther. .

Abstract

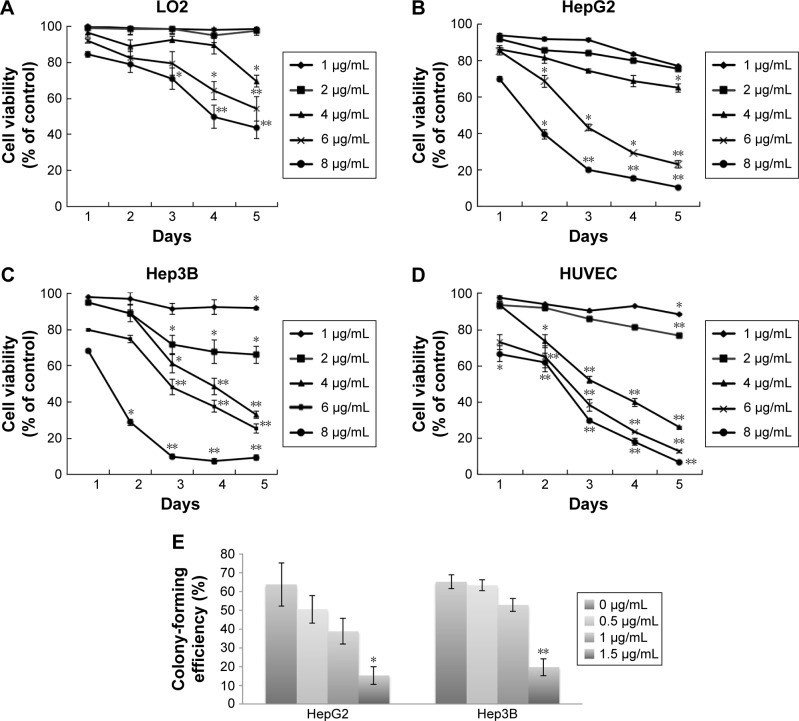
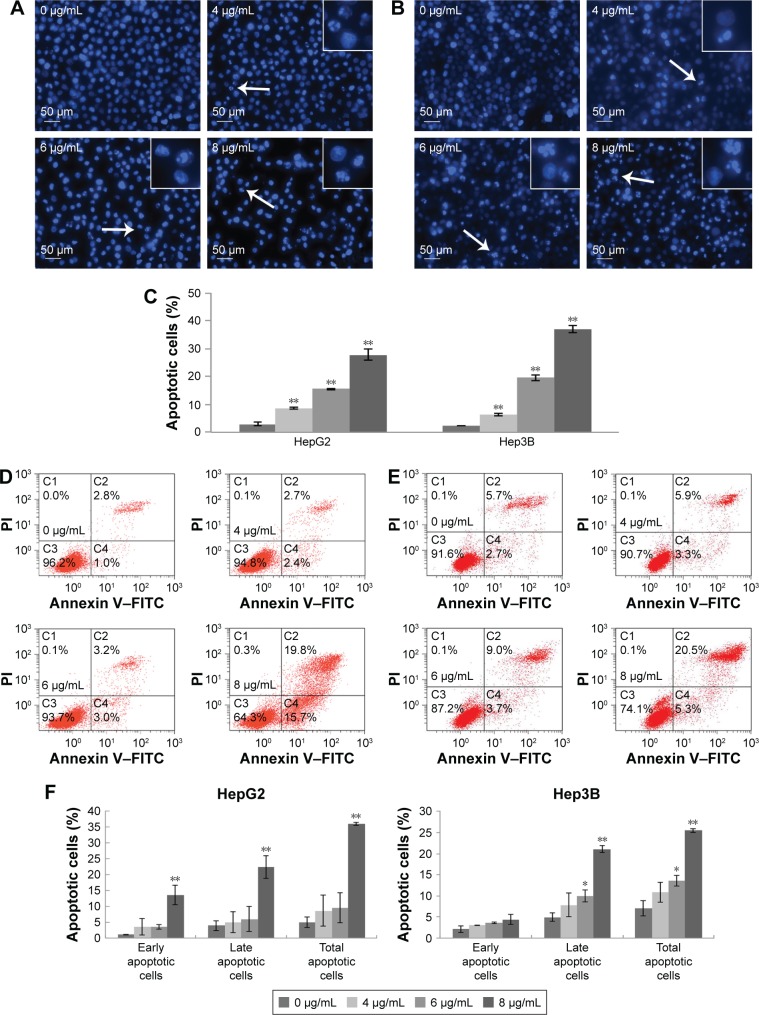
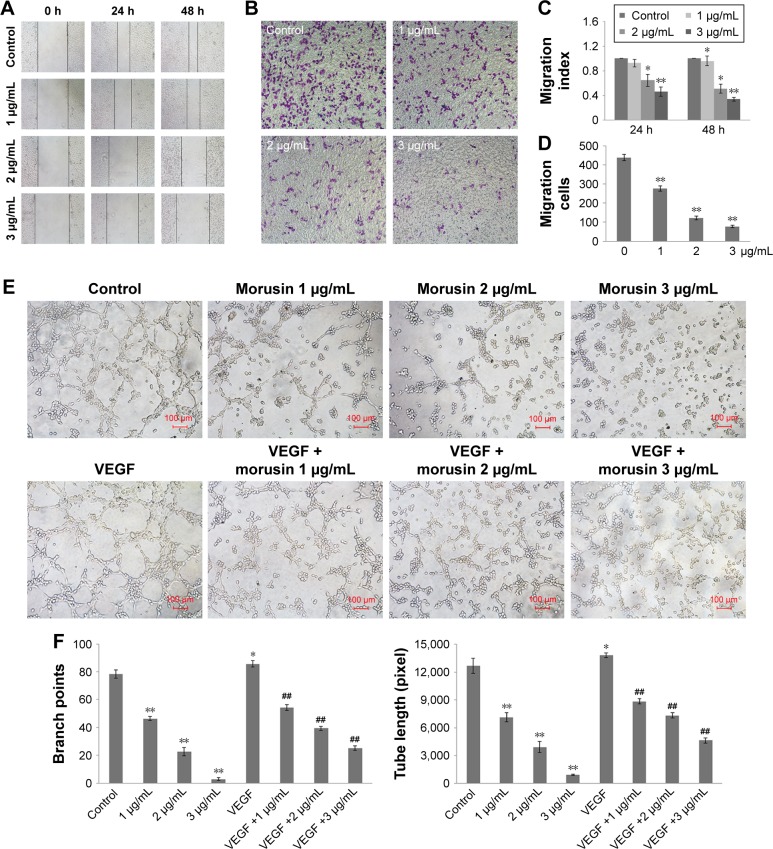
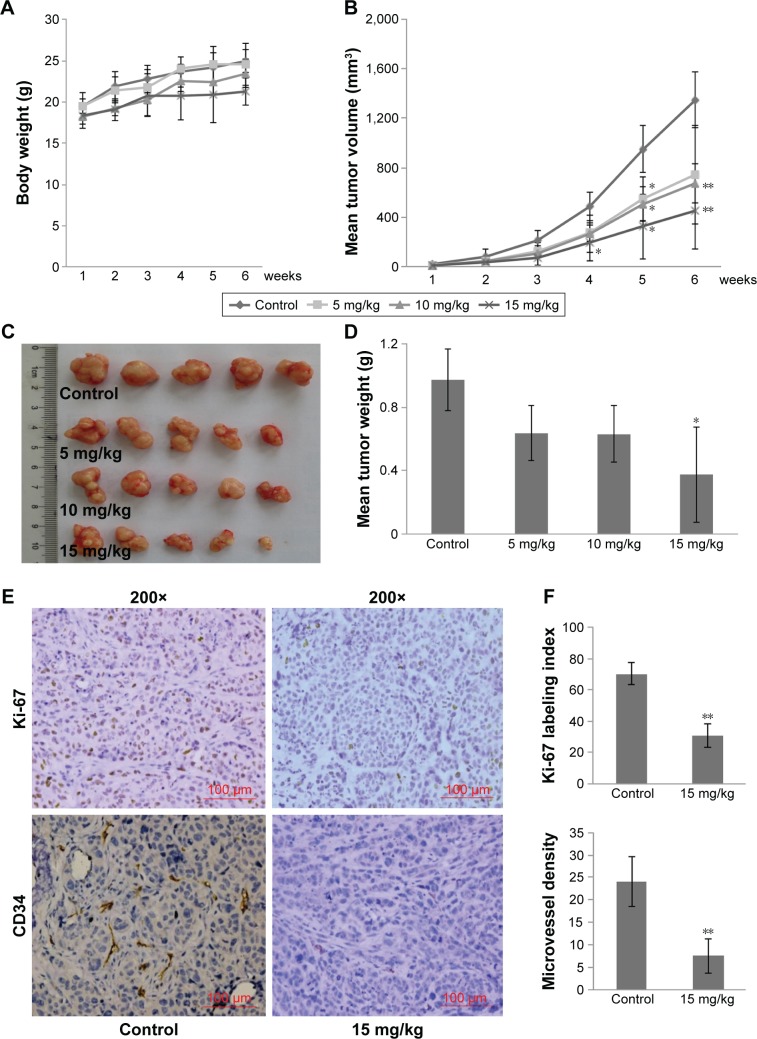
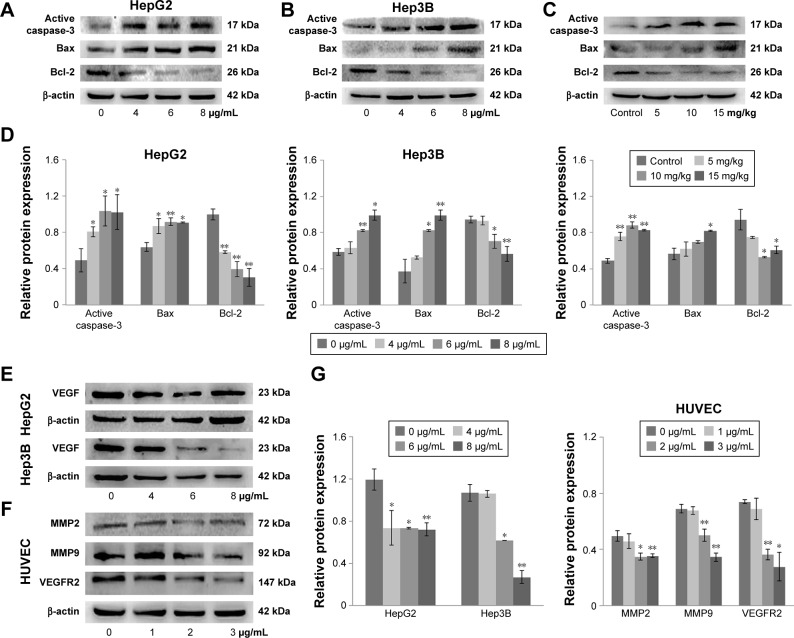
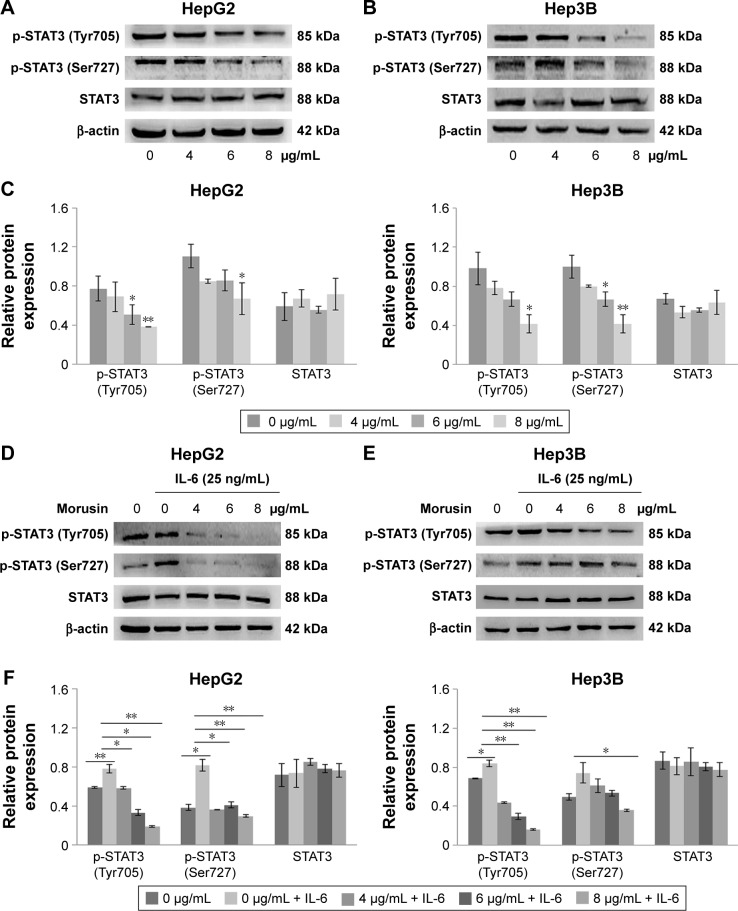
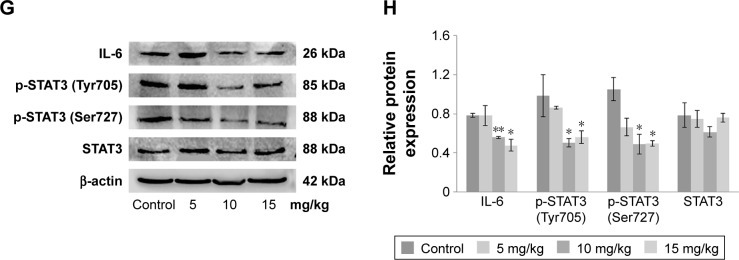
Hepatocellular carcinoma (HCC) is one of the most aggressive cancers with high mortality worldwide. Research and development of novel agents for HCC therapy is in demand, urgently. Morusin has been reported to exhibit potential cytotoxic activity in several cancer cell lines. However, whether it has potential antiangiogenic activity especially in HCC remains unclear. In the current study, we found that morusin exerted growth inhibition effects on human HCC cells (HepG2 and Hep3B) in vitro and human HCC cell (HepG2) xenografts in vivo. Moreover, apoptosis induction was observed in a dose-dependent manner after morusin treatment along with an increase in the expression of active caspase-3 and the Bax/Bcl-2 expression ratio. More importantly, morusin inhibited proliferation, migration, and tube formation of human umbilical vein endothelial cells (HUVECs) in vitro and downregulated angiogenic proteins in HCC cells and HUVECs. In vivo, tumor angiogenesis was also attenuated after morusin treatment. In addition, morusin suppressed constitutive as well as IL-6-induced STAT3 phosphorylation in HCC cells and corresponding tumor tissues. Overall, morusin has a potential anticancer effect on human HCC cells in vitro and in vivo by inducing apoptosis and inhibiting anti-angiogenesis. The corresponding mechanism might be associated with the attenuation of the IL-6/STAT3 signaling pathway. Morusin might serve as a promising novel anticancer agent in HCC therapy, and requires further study.

Keywords: IL-6; STAT3; angiogenesis; apoptosis; human hepatocellular carcinoma; morusin.


Conflict of interest statement

Disclosure The authors report no conflicts of interest in this work.

Figures

Figure 1
Figure 1
Morusin inhibited the proliferation of human HCC cells and HUVECs and the colony formation of HCC cells in vitro. Notes: (A) Human normal liver cells (LO2). (B) Human HCC cells (HepG2). (C) Human HCC cells (Hep3B). (D) HUVECs. (E) Morusin inhibited HepG2 and Hep3B cell colony formation. *P<0.05, **P<0.01. Three independent experiments were performed. Abbreviations: HCC, hepatocellular carcinoma; HUVECs, human umbilical vein endothelial cells.
Figure 2
Figure 2
The apoptosis induction effect of morusin on human HCC cells. Notes: The effect of morusin on morphological changes in HepG2 cells (A) and Hep3B cells (B). Typical apoptotic cells are shown with white arrows. (C) The histogram shows that there was a significant increase in DAPI-stained apoptotic cells in morusin-treated HepG2 and Hep3B cells. Apoptosis induction in HepG2 cells (D) and Hep3B cells (E) was also measured with the Annexin V–FITC/PI double-staining assay after treatment with morusin (4, 6, and 8 μg/mL) for 48 h. (F) The histograms show the apoptotic proportion of HepG2 and Hep3B cells treated with morusin compared with the control. *P<0.05, **P<0.01. Three independent experiments were performed. Abbreviations: DAPI, 4′,6-diamidino-2-phenylindole; FITC, fluorescein isothiocyanate; HCC, hepatocellular carcinoma; PI, propidium iodide.
Figure 3
Figure 3
The migration and tube formation inhibition effects of morusin on HUVECs. Notes: (A, C) Inhibition of HUVEC migration in the wound-healing assay. The photographs were obtained at a magnification of 100×. (B, D) Inhibition of HUVEC migration in the Transwell assay. The penetrated cells were stained and quantified. The photographs were obtained at a magnification of 200×. (E) Reduction in endothelial tube formation after pretreatment with morusin for 24 h following with incubation in 96-well plates with or without VEGF (10 ng/mL). Tube formation of HUVECs was assessed 6–10 h later. The photographs were obtained at a magnification of 200. (F) The histograms represent the dose effect of morusin in branch points and tube length inhibition. *P<0.05 vs control, **P<0.01 vs control. ##P<0.01 vs VEGF-only group. Representative images were taken from three independent experiments. Abbreviation: HUVECs, human umbilical vein endothelial cells.
Figure 4
Figure 4
The growth inhibition effect of morusin in human HCC cells xenograft model. Notes: (A) Body weight of tumor-bearing mice in each group was determined weekly after morusin treatment. (B) Tumor volume in each group was determined weekly after morusin treatment. (C) Tumor masses of each group. (D) Tumor weights of each group. (E) Ki-67 and CD34 IHC staining of tumor tissues derived from the control group and the high-dose group (15 mg/kg) at a magnification of 200× (n=4). (F) The graphs showed Ki-67 index and MVD of tumors. *P<0.05, **P<0.01. Abbreviations: HCC, hepatocellular carcinoma; IHC, immunohistochemical; MVD, microvessel density.
Figure 5
Figure 5
Apoptotic protein and angiogenic protein expressions in morusin-treated human HCC cells and tumor tissues. Notes: Western blot analysis of apoptotic protein expression in morusin-treated HepG2 cells (A), Hep3B cells (B), and tumor tissue (C). (D) The histograms show that there was a significant increase in Bax and active caspase-3 and a decrease in Bcl-2 expression in a dose-dependent manner after morusin treatment. (E) Western blot analysis of VEGF expression in HepG2 and Hep3B cells. (F) Western blot analysis of MMP2, MMP, and VEGFR2 expressions in HUVECs. (G) The histograms show that there was a significant decrease in VEGF, MMP2, MMP9, and VEGFR2 expressions in a dose-dependent manner after morusin treatment. *P<0.05, **P<0.01. Three parallel experiments were performed. Abbreviations: HCC, hepatocellular carcinoma; HUVECs, human umbilical vein endothelial cells.
Figure 6
Figure 6
The effect of morusin on protein expressions of the IL-6/STAT3 signaling pathway. Notes: HepG2 cells (A) or Hep3B cells (B) were treated with the indicated concentrations of morusin for 48 h and analyzed for p-STAT3 (Tyr705), p-STAT3 (Ser727), and STAT3 levels using Western blot analysis. (C) The histograms show that there was a significant decrease in p-STAT3 (Tyr705) and p-STAT3 (Ser727) but not in the total STAT3 expression after morusin treatment. (D, E) HCC cells were treated with the indicated concentrations of morusin for 24 h and were then induced by IL-6 for 15 min, after which whole-cell extracts were processed for Western blot analysis. (F) The histograms show that there was a decrease in p-STAT3 (Tyr705) and p-STAT3 (Ser727) but not in the total STAT3 expression after morusin treatment. (G) Western blot analysis of protein expressions in the IL-6/STAT3 signaling pathway in morusin-treated tumor tissues. (H) The histogram shows that expression levels of IL-6, p-STAT3 (Tyr705), and p-STAT3 (Ser727) decreased. *P<0.05, **P<0.01. Three parallel experiments were performed. Abbreviation: HCC, hepatocellular carcinoma.
Figure 6
Figure 6
The effect of morusin on protein expressions of the IL-6/STAT3 signaling pathway. Notes: HepG2 cells (A) or Hep3B cells (B) were treated with the indicated concentrations of morusin for 48 h and analyzed for p-STAT3 (Tyr705), p-STAT3 (Ser727), and STAT3 levels using Western blot analysis. (C) The histograms show that there was a significant decrease in p-STAT3 (Tyr705) and p-STAT3 (Ser727) but not in the total STAT3 expression after morusin treatment. (D, E) HCC cells were treated with the indicated concentrations of morusin for 24 h and were then induced by IL-6 for 15 min, after which whole-cell extracts were processed for Western blot analysis. (F) The histograms show that there was a decrease in p-STAT3 (Tyr705) and p-STAT3 (Ser727) but not in the total STAT3 expression after morusin treatment. (G) Western blot analysis of protein expressions in the IL-6/STAT3 signaling pathway in morusin-treated tumor tissues. (H) The histogram shows that expression levels of IL-6, p-STAT3 (Tyr705), and p-STAT3 (Ser727) decreased. *P<0.05, **P<0.01. Three parallel experiments were performed. Abbreviation: HCC, hepatocellular carcinoma.

References

    1. El-Serag HB. Hepatocellular carcinoma. N Engl J Med. 2011;365(12):1118–1127. - PubMed
    1. El-Serag HB, Rudolph KL. Hepatocellular carcinoma: epidemiology and molecular carcinogenesis. Gastroenterology. 2007;132(7):2557–2576. - PubMed
    1. Grandhi MS, Kim AK, Ronnekleiv-Kelly SM, Kamel IR, Ghasebeh MA, Pawlik TM. Hepatocellular carcinoma: from diagnosis to treatment. Surg Oncol. 2016;25(2):74–85. - PubMed
    1. Connell LC, Harding JJ, Abou-Alfa GK. Advanced hepatocellular cancer: the current state of future research. Curr Treat Options Oncol. 2016;17(8):43. - PubMed
    1. Simonetti RG, Liberati A, Angiolini C, Pagliaro L. Treatment of hepatocellular carcinoma: a systematic review of randomized controlled trials. Ann Oncol. 1997;8(2):117–136. - PubMed

MeSH terms