. 2017 Jun 26:8:32.
doi: 10.1186/s13229-017-0138-8. eCollection 2017.

Neuroanatomy in mouse models of Rett syndrome is related to the severity of Mecp2 mutation and behavioral phenotypes

Affiliations

Neuroanatomy in mouse models of Rett syndrome is related to the severity of Mecp2 mutation and behavioral phenotypes

Rylan Allemang-Grand et al. Mol Autism. .

Abstract

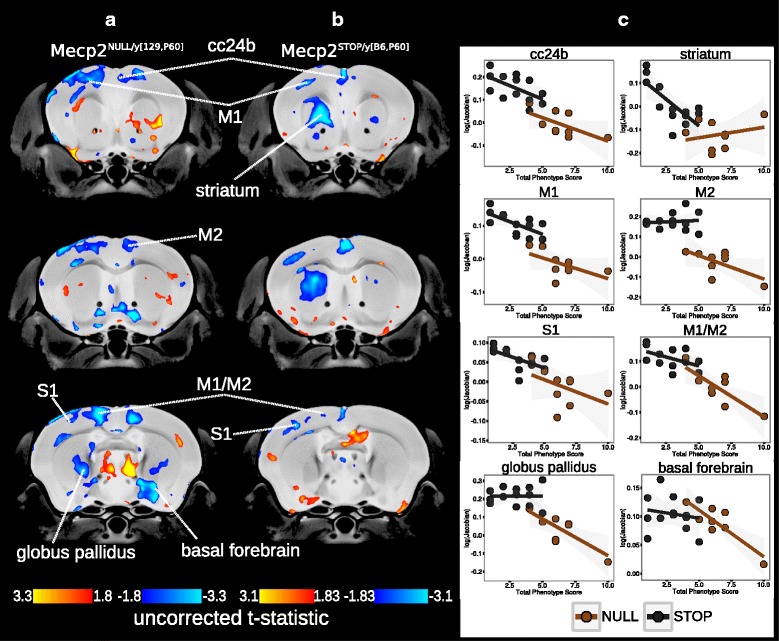
Background: Rett syndrome (RTT) is a neurodevelopmental disorder that predominantly affects girls. The majority of RTT cases are caused by de novo mutations in methyl-CpG-binding protein 2 (MECP2), and several mouse models have been created to further understand the disorder. In the current literature, many studies have focused their analyses on the behavioral abnormalities and cellular and molecular impairments that arise from Mecp2 mutations. However, limited efforts have been placed on understanding how Mecp2 mutations disrupt the neuroanatomy and networks of the brain.

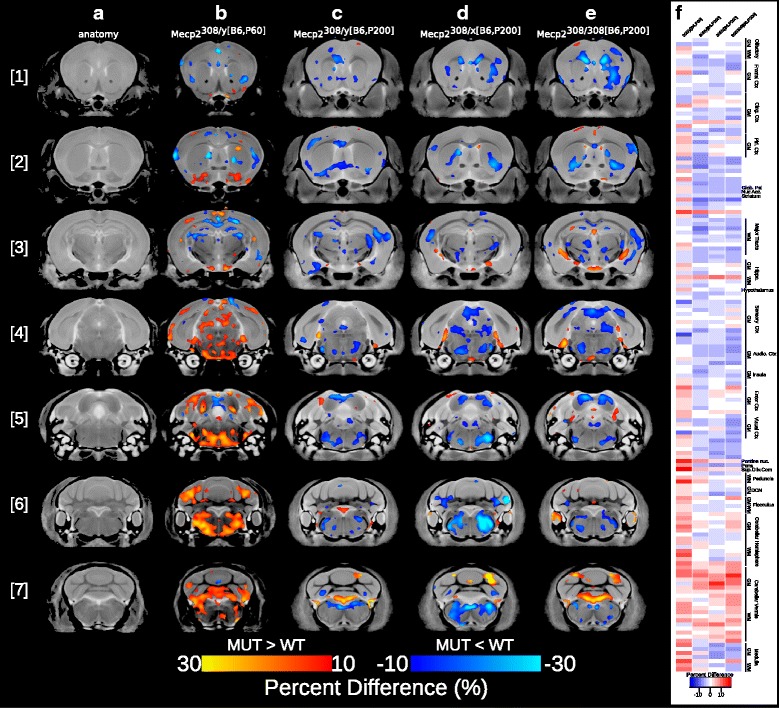
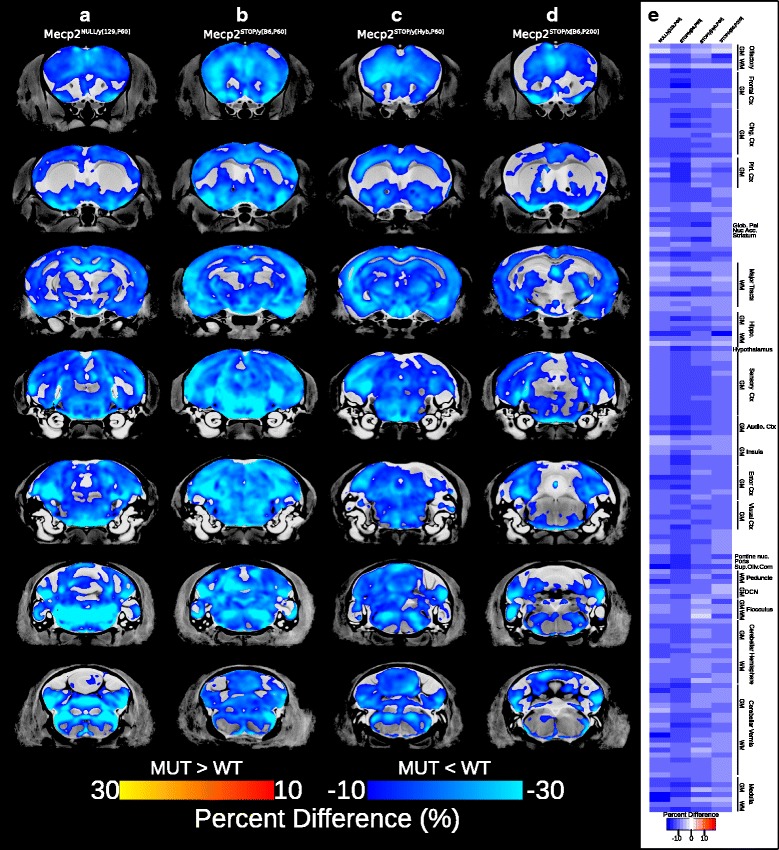
Methods: In this study, we examined the neuroanatomy of male and female mice from the Mecp2tm1Hzo, Mecp2tm1.1Bird/J, and Mecp2tm2Bird/J mouse lines using high-resolution magnetic resonance imaging (MRI) paired with deformation-based morphometry to determine the brain regions susceptible to Mecp2 disruptions.

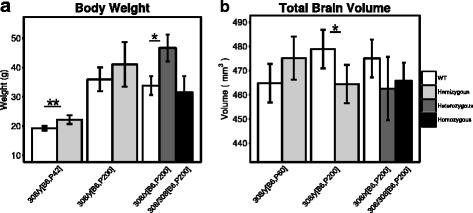
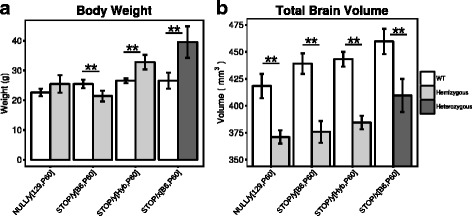
Results: We found that many cortical and subcortical regions were reduced in volume within the brains of mutant mice regardless of mutation type, highlighting regions that are susceptible to Mecp2 disruptions. We also found that the volume within these regions correlated with behavioral metrics. Conversely, regions of the cerebellum were differentially affected by the type of mutation, showing an increase in volume in the mutant Mecp2tm1Hzo brain relative to controls and a decrease in the Mecp2tm1.1Bird/J and Mecp2tm2Bird/J lines.

Conclusions: Our findings demonstrate that the direction and magnitude of the neuroanatomical differences between control and mutant mice carrying Mecp2 mutations are driven by the severity of the mutation and the stage of behavioral impairments.

Keywords: Magnetic resonance imaging; Mecp2 mouse models; Neuroanatomy; Rett syndrome.


Figures

Fig. 1
Fig. 1
Differential effect of mutation on body weight and total brain volume of male and female Mecp2tm1Hzo mice. a Body weight (grams) and b total brain volume (mm3) is shown for 200-day-old WT (white bar) along with hemizygous (Mecp2308/y[B6,P200], light gray), heterozygous (Mecp2308/x[B6,P200], medium gray), or homozygous (Mecp2308/308[B6,P200], dark gray) mice carrying the Mecp2tm1Hzo allele. In order to assess the effect of the Mecp2tm1Hzo allele during early adulthood, body weight measurements were collected from 42-day-old WT and hemizygous (Mecp2308/y[B6,P42]) males, while total brain volume was measured from 60-day-old WT and hemizygous (Mecp2308/y[B6,P60]) males. All mice were on a C57BL/6J background (B6). Each mutant mouse was compared to their WT matched control using a ttest with a false discovery rate threshold to control for multiple comparisons. *q < 0.05, **q < 0.01
Fig. 2
Fig. 2
Neuroanatomical differences between mutant and WT mice carrying the Mecp2tm1Hzo truncation mutation. Neuroanatomy was analyzed on a voxelwise level across the brain and within 159 segmented anatomical regions. Coronal slices from the rostral [1] to caudal [7] partitions from the final nonlinear average depicting the neuroanatomy are shown in (a). Voxelwise differences between mutant and WT were overlaid on the final nonlinear average for the following experimental groups: b Mecp2308/y[B6,P60]; t = 2.71, 10% FDR-corrected, c Mecp2308/y[B6,P200]; uncorrected t = 2.52, p < 0.01, d Mecp2308/x[B6,P200]; t = 2.77, 10% FDR-corrected and e. Mecp2308/308[B6,P200];t = 2.64, 10% FDR-corrected. The magnitude of the effect is shown as a percent difference; Mutants > WT (red to yellow), mutants < WT (dark blue to light blue). Percent difference in volume across the 159 segmented structures are shown in (f). White barsindicate no difference, blueindicating a smaller volume in mutants compared to WT, and redindicating a larger volume in mutants relative to WT
Fig. 3
Fig. 3
Loss of a functional copy of Mecp2 leads to drastic decreases in total brain volume. a Body weight (grams) and b total brain volume (mm3) measurements from P60 hemizygous males carrying the Mecp2tm1.1Bird (Mecp2NULL/y[129,P60]) or the Mecp2tm2Bird allele on a C57BL/6J (Mecp2STOP/y[B6,P60]) or C57/CBA (Mecp2STOP/y[Hyb,P60]) background. Measurements were also collected from P200 female Mecp2tm2Bird mice on a C57BL/6J background (Mecp2STOP/x[B6,P200]). Each mutant mouse was compared to their WT matched control using a ttest with a false discovery rate threshold to control for multiple comparisons. **q < 0.01
Fig. 4
Fig. 4
Neuroanatomical differences between mutant and WT mice carrying the Mecp2tm1.1Bird and Mecp2tm2Bird mutations. Significant voxelwise differences (5% FDR-corrected) were overlaid on the final nonlinear average for a Mecp2NULL/y[129,P60]; t = 2.15, b Mecp2STOP/y[B6,P60]; t = 2.16, c Mecp2STOP/y[Hyb,P60]; t = 2.09, and d Mecp2STOP/x[B6,P200]; t=2.15 experimental groups. The magnitude of the effects is shown as a percent difference; Mutants < WT (dark blue to light blue). Percent difference in volume across the 159 segmented structures are shown in (e)., with white barsindicating no difference and blue indicating smaller in mutants compared to WT
Fig. 5
Fig. 5
Neuroanatomical correlations with phenotype. Correlations between volume and total phenotype score within the hemizygous a Mecp2NULL/y[129,P60]; uncorrectedt = 1.8 and b Mecp2STOP/y[B6,P60]; uncorrected = 1.83 brains (uncorrected threshold ranging from p < 0.05 to p < 0.005). The volume of voxels either negatively or positively correlated with total phenotype score (blueand redregions, respectively). c Plots of the correlation between phenotype score and the normalized Jacobian determinant. Mecp2STOP/y[B6,P60]) (black circles and line), Mecp2NULL/y[129,P60] (brown circles and line). cc24b Cingulate cortex area 24b, M1 primary motor cortex, M2 secondary motor cortex, striatum, S1 primary somatosensory cortex, globus pallidus, basal forebrain

References

    1. Amir RE, Van den Veyver IB, Wan M, Tran CQ, Francke U, Zoghbi HY. Rett syndrome is caused by mutations in x-linked mecp2, encoding methyl-cpg-binding protein 2. Nat Genet. 1999;23(2):185–8. doi: 10.1038/13810. - DOI - PubMed
    1. Hagberg B, Aicardi J, Dias K, Ramos O. A progressive syndrome of autism, dementia, ataxia, and loss of purposeful hand use in girls: Rett’s syndrome: report of 35 cases. Ann Neurol. 1983;14(4):471–9. doi: 10.1002/ana.410140412. - DOI - PubMed
    1. Weese-Mayer DE, Lieske SP, Boothby CM, Kenny AS, Bennett HL, Silvestri JM, Ramirez JM. Autonomic nervous system dysregulation: breathing and heart rate perturbation during wakefulness in young girls with Rett syndrome. Pediatr Res. 2006;60(4):443–9. doi: 10.1203/01.pdr.0000238302.84552.d0. - DOI - PubMed
    1. Kaufmann W, Tierney E, Rohde C, Suarez-Pedraza M, Clarke M, Salorio C, Bibat G, Bukelis I, Naram D, Lanham D, et al. Social impairments in rett syndrome: characteristics and relationship with clinical severity. J Intellect Disabil Res. 2012;56(3):233–47. doi: 10.1111/j.1365-2788.2011.01404.x. - DOI - PubMed
    1. Berger-Sweeney J. Cognitive deficits in Rett syndrome: what we know and what we need to know to treat them. Neurobiol Learn Mem. 2011;96(4):637–46. doi: 10.1016/j.nlm.2011.05.006. - DOI - PubMed

Publication types

Substances