

Phenotype-based variation as a biomarker of sensitivity to molecularly targeted therapy in melanoma
- PMID: 28670440
- PMCID: PMC5488266
- DOI: 10.1039/C6MD00466K
Phenotype-based variation as a biomarker of sensitivity to molecularly targeted therapy in melanoma
Abstract
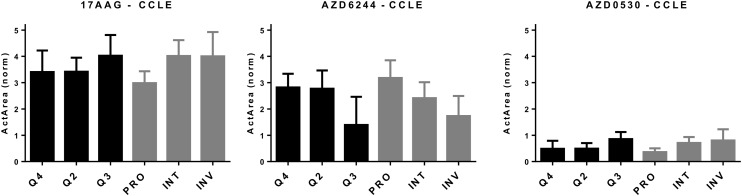
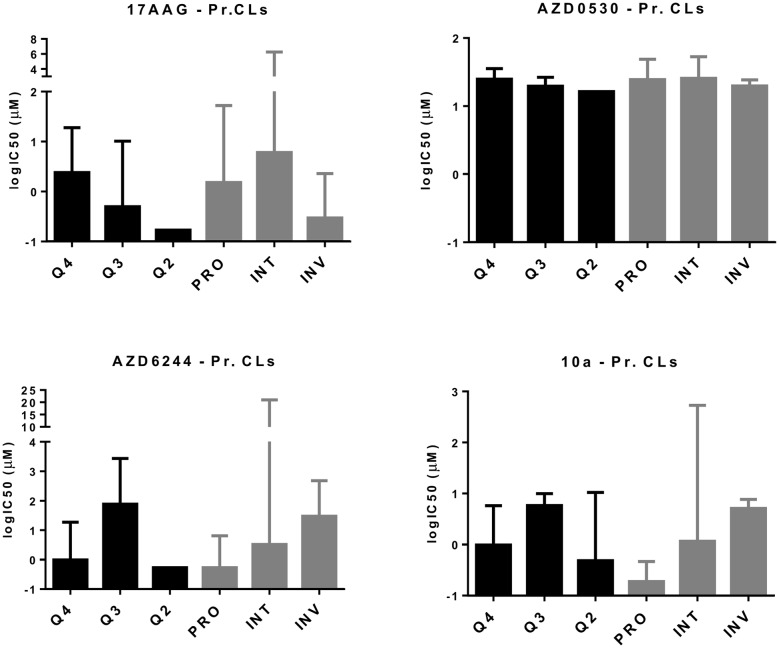
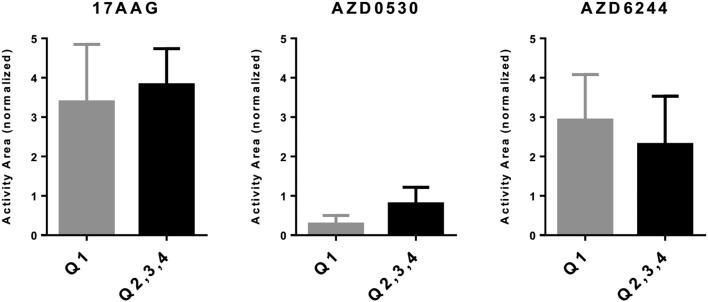
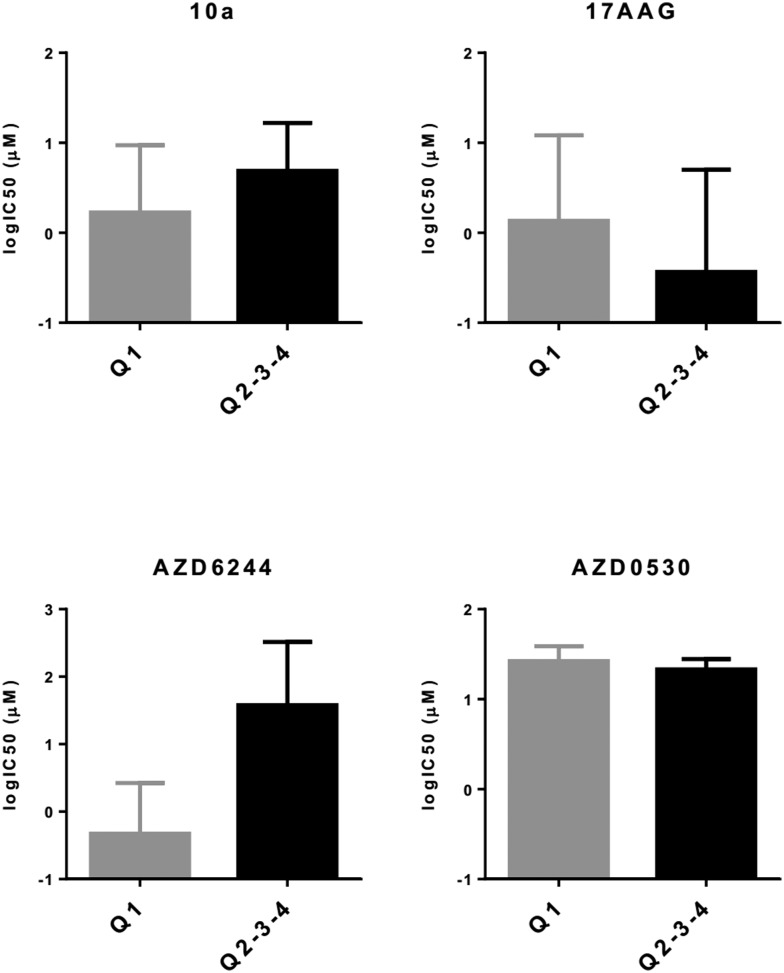
Transcriptomic phenotypes defined for melanoma have been reported to correlate with sensitivity to various drugs. In this study, we aimed to define a minimal signature that could be used to distinguish melanoma sub-types in vitro, and to determine suitable drugs by which these sub-types can be targeted. By using primary melanoma cell lines, as well as commercially available melanoma cell lines, we find that the evaluation of MLANA and INHBA expression is as capable as one based on a combined analysis performed with genes for stemness, EMT and invasion/proliferation, in identifying melanoma subtypes that differ in their sensitivity to molecularly targeted drugs. Using this approach, we find that 75% of melanoma cell lines can be treated with either the MEK inhibitor AZD6244 or the HSP90 inhibitor 17AAG.
Figures
Similar articles
-
A Stemness and EMT Based Gene Expression Signature Identifies Phenotypic Plasticity and is A Predictive but Not Prognostic Biomarker for Breast Cancer.J Cancer. 2020 Jan 1;11(4):949-961. doi: 10.7150/jca.34649. eCollection 2020. J Cancer. 2020. PMID: 31949498 Free PMC article.
-
Comparison of 17-dimethylaminoethylamino-17-demethoxy-geldanamycin (17DMAG) and 17-allylamino-17-demethoxygeldanamycin (17AAG) in vitro: effects on Hsp90 and client proteins in melanoma models.Cancer Chemother Pharmacol. 2005 Aug;56(2):126-37. doi: 10.1007/s00280-004-0947-2. Epub 2005 Apr 20. Cancer Chemother Pharmacol. 2005. PMID: 15841378
-
Pluripotency markers are differentially induced by MEK inhibition in thyroid and melanoma BRAFV600E cell lines.Cancer Biol Ther. 2016 May 3;17(5):526-42. doi: 10.1080/15384047.2016.1139230. Epub 2016 Feb 1. Cancer Biol Ther. 2016. PMID: 26828826 Free PMC article.
-
Immunomodulatory Effects of BRAF, MEK, and CDK4/6 Inhibitors: Implications for Combining Targeted Therapy and Immune Checkpoint Blockade for the Treatment of Melanoma.Front Immunol. 2021 May 7;12:661737. doi: 10.3389/fimmu.2021.661737. eCollection 2021. Front Immunol. 2021. PMID: 34025662 Free PMC article. Review.
-
MEK Inhibitors in the Treatment of Metastatic Melanoma and Solid Tumors.Am J Clin Dermatol. 2017 Dec;18(6):745-754. doi: 10.1007/s40257-017-0292-y. Am J Clin Dermatol. 2017. PMID: 28537004 Review.
Cited by
-
17-Aminogeldanamycin selectively diminishes IRE1α-XBP1s pathway activity and cooperatively induces apoptosis with MEK1/2 and BRAFV600E inhibitors in melanoma cells of different genetic subtypes.Apoptosis. 2019 Aug;24(7-8):596-611. doi: 10.1007/s10495-019-01542-y. Apoptosis. 2019. PMID: 30989459 Free PMC article.
-
Inhibitors of HSP90 in melanoma.Apoptosis. 2020 Feb;25(1-2):12-28. doi: 10.1007/s10495-019-01577-1. Apoptosis. 2020. PMID: 31659567 Free PMC article. Review.
-
A Stemness and EMT Based Gene Expression Signature Identifies Phenotypic Plasticity and is A Predictive but Not Prognostic Biomarker for Breast Cancer.J Cancer. 2020 Jan 1;11(4):949-961. doi: 10.7150/jca.34649. eCollection 2020. J Cancer. 2020. PMID: 31949498 Free PMC article.
-
Predictive Gene Signature for Pyrazolopyrimidine Derivative c-Src Inhibitor 10a Sensitivity in Melanoma Cells.ACS Med Chem Lett. 2020 Feb 18;11(5):928-932. doi: 10.1021/acsmedchemlett.9b00679. eCollection 2020 May 14. ACS Med Chem Lett. 2020. PMID: 32435407 Free PMC article.
References
-
- Cancer Genome Atlas N. Cell. 2015;161:1681–1696. - PubMed
-
- Cirenajwis H., Ekedahl H., Lauss M., Harbst K., Carneiro A., Enoksson J., Rosengren F., Werner-Hartman L., Torngren T., Kvist A., Fredlund E., Bendahl P. O., Jirstrom K., Lundgren L., Howlin J., Borg A., Gruvberger-Saal S. K., Saal L. H., Nielsen K., Ringner M., Tsao H., Olsson H., Ingvar C., Staaf J., Jonsson G. Oncotarget. 2015;6:12297–12309. - PMC - PubMed
-
- Chapman P. B., Hauschild A., Robert C., Haanen J. B., Ascierto P., Larkin J., Dummer R., Garbe C., Testori A., Maio M., Hogg D., Lorigan P., Lebbe C., Jouary T., Schadendorf D., Ribas A., O'Day S. J., Sosman J. A., Kirkwood J. M., Eggermont A. M., Dreno B., Nolop K., Li J., Nelson B., Hou J., Lee R. J., Flaherty K. T., McArthur G. A., Group B.-S. N. Engl. J. Med. 2011;364:2507–2516. - PMC - PubMed
-
- Flaherty K. T., Robert C., Hersey P., Nathan P., Garbe C., Milhem M., Demidov L. V., Hassel J. C., Rutkowski P., Mohr P., Dummer R., Trefzer U., Larkin J. M., Utikal J., Dreno B., Nyakas M., Middleton M. R., Becker J. C., Casey M., Sherman L. J., Wu F. S., Ouellet D., Martin A. M., Patel K., Schadendorf D., Group M. S. N. Engl. J. Med. 2012;367:107–114. - PubMed
-
- Hoek K. S., Eichhoff O. M., Schlegel N. C., Dobbeling U., Kobert N., Schaerer L., Hemmi S., Dummer R. Cancer Res. 2008;68:650–656. - PubMed
Grants and funding
LinkOut - more resources
Full Text Sources
Other Literature Sources