. 2017 Jun 1;7(6):1238-1251.
eCollection 2017.

Identification of RING-box 2 as a potential target for combating colorectal cancer growth and metastasis

Affiliations

Identification of RING-box 2 as a potential target for combating colorectal cancer growth and metastasis

Xiao-Yu Wu et al. Am J Cancer Res. .

Abstract

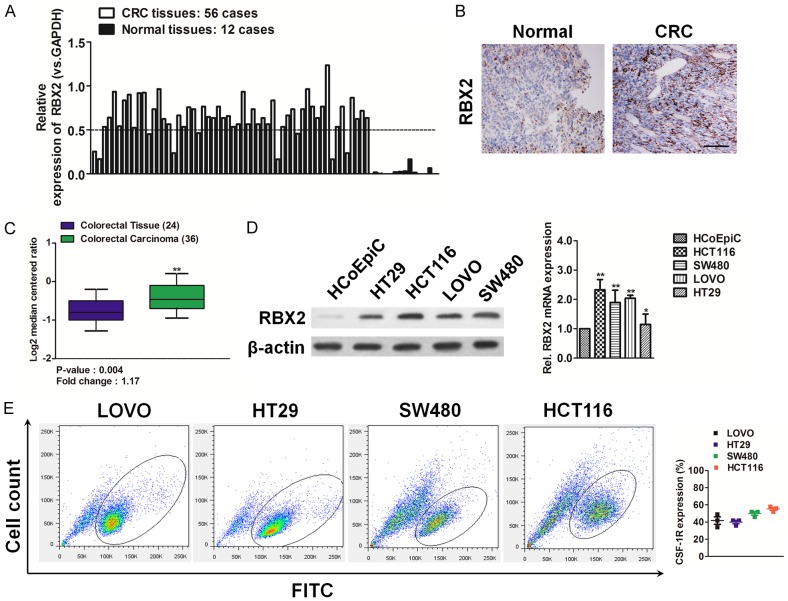
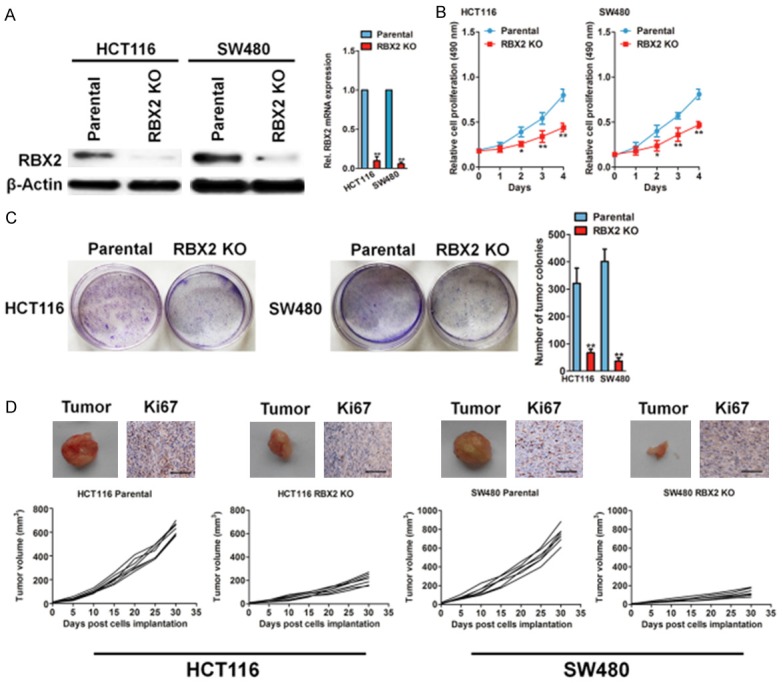
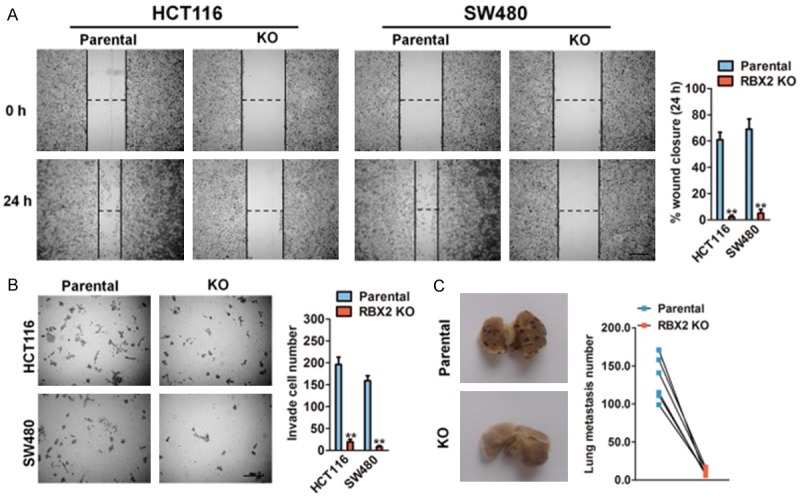
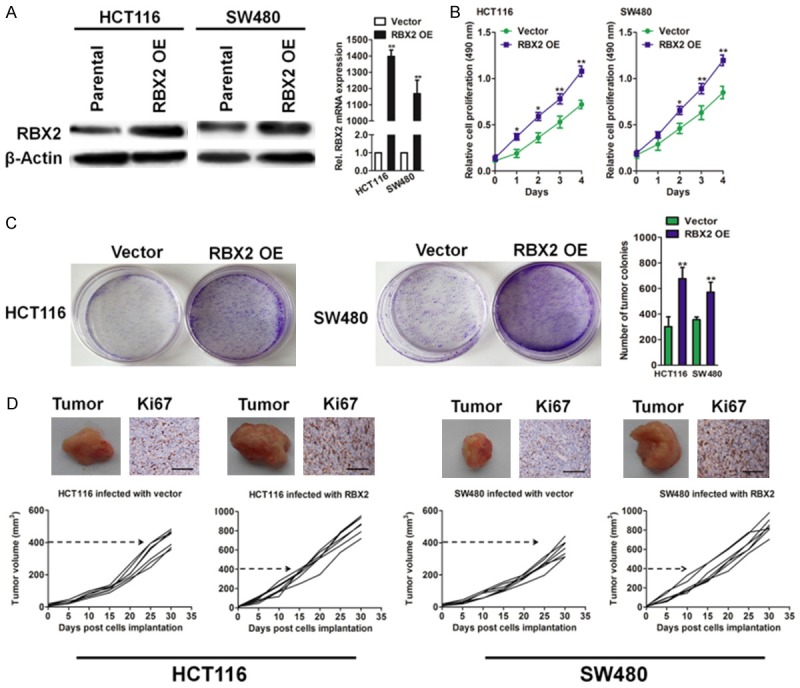
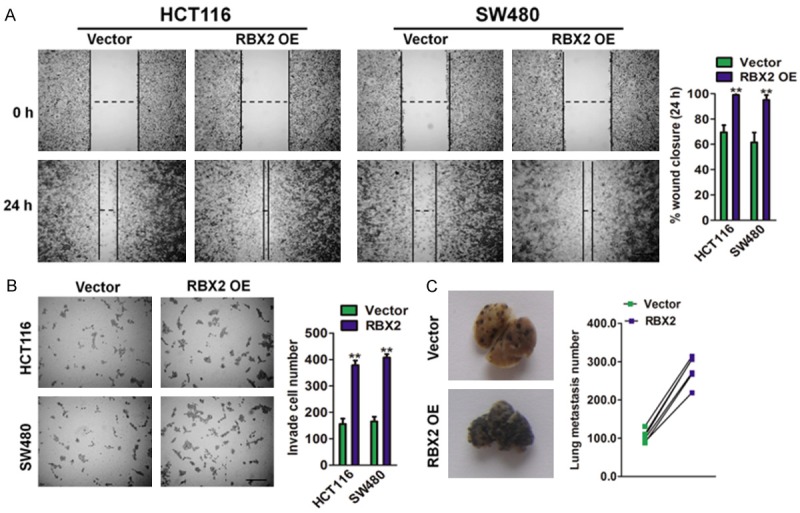
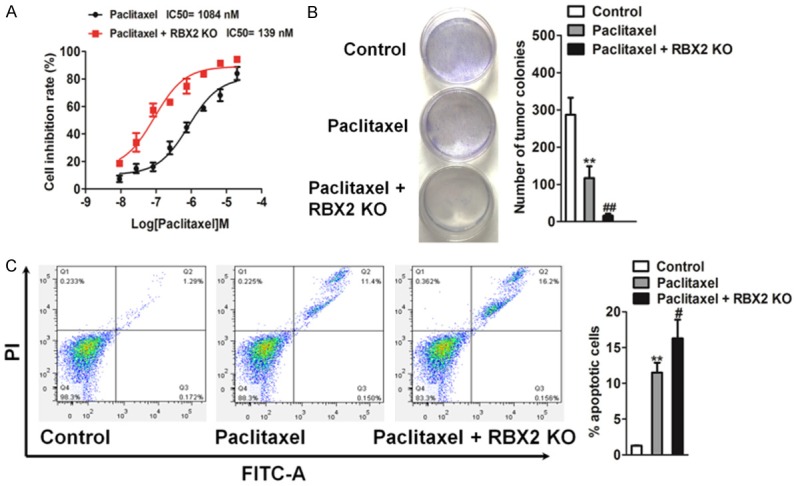
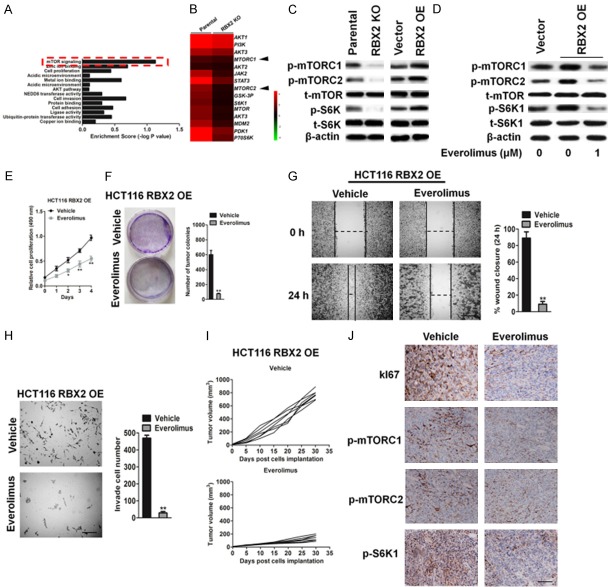
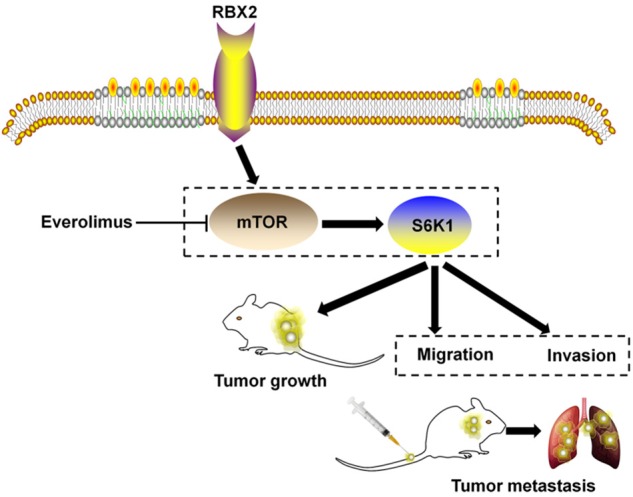
Development of cancer metastasis is a key contributor to mortality in patients with colorectal cancer. High expression of RING-box 2 (RBX2) in cancer cells is known to play a key role in tumor progression. However, the role of RBX2 in colorectal cancer progression is not well elucidated. In this study, we silenced RBX2 via CRISPR/Cas9 in two colorectal cancer cell lines, HCT116 and SW480. RBX2 knockout attenuated proliferation, colony formation and enhanced sensitivity of colorectal cancer cells to paclitaxel treatment. Invasive property of HCT116 and SW480 cells was also attenuated by RBX2 silencing. We confirmed that increased RBX2 correlated with higher tumor cells growth and metastasis abilities by ectopic expression of RBX2 in HCT116 and SW480 cells. In vivo studies suggested that knockout of RBX2 inhibited xenografts growth and metastasis to lung tissue, whereas ectopic expression of RBX2 promoted these cellular functions. Mechanically, RBX2 induced gastric cancer cell growth and metastasis by activating mammalian target of rapamycin/S6 kinase 1 (mTOR/S6K1). Treatment of everolimus, the specific mTOR inhibitor, significantly attenuated RBX2-mediated cell proliferation and mobility in vitro. Taken together, these results revealed a novel role of RBX2 in colorectal cancer cell growth and metastasis via the mTOR pathway and suggested RBX2 may serve as a therapeutic target in colorectal cancer.

Keywords: RBX2; colorectal cancer; mTOR; metastasis.


Conflict of interest statement

None.

Figures

Figure 1
Figure 1
Overexpression of RBX2 in colorectal carcinoma tissues and cell lines. A. Relative expression of RBX2 mRNA in 56 CRC cancer and paired adjacent normal tissues as determined by qPCR. Increased expression of RBX2 mRNA as compared with normal tissue was observed. B. Expression of RBX2 protein was determined by IHC analysis. Representative images of IHC staining of RBX2 in CRC cancer tissues and adjacent normal tissues. Scale bar represents 100 μm. C. Box plots show increased levels of RBX2 in CRC (right) compared with normal tissues in Skrzypczak colorectal microarray data set. **P < 0.01, compared with normal colon tissues was determined by the Student’s t test. D. Western blotting analysis (left panel) of the level of RBX2 in various CRC cell lines. β-actin was used as loading controls. qPCR analysis (right panel) of RBX2 mRNA level in CRC cells. PCR values were normalized to the levels of β-actin. Data were presented as the mean ± SD from three independent measurements. E. Representative fluorescence activated cell sorter (FACS) dot plots of HCT116, SW480, LOVO, and HT29 cells stained with the anti-RBX2 antibody. Histograms reported the percentage of RBX2 positive cells as assessed by FACS. Mean ± SD of three independent experiments. Quantitative analysis demonstrates expression of RBX2 positive CRC cells range from 40%-60%.
Figure 2
Figure 2
RBX2 depletion inhibits growth in colorectal cancer cells. A. Western blot to test the efficiency and specificity of RBX2 knockout plasmid transfection was shown completely loss of RBX2 relative to parental HCT116 and SW480 cells (left panel). qPCR analysis of RBX2 mRNA levels in both CRC cell lines. PCR values were normalized to the levels of β-actin. Data are presented as the mean ± SD from three independent measurements. B. Cell growth rate from parental and RBX2 knockout HCT116 cells (left) and SW480 cells (right) at indicated time point. C. Colony formation assay of parental and RBX2 knockout HCT116 and SW480 cells. 1000 cells were plated in 6-well plate in complete medium and cultured for 14 days and colonies were stained and counted. D. Representative images of xenografts. Tumor growth curve for HCT116 (left panel) and SW480 (right panel) xenogaft tumor models. Immunohistochemistry analysis of RBX2 and Ki67 in xenografts of the indicated groups. Scale bar represents 100 μm.
Figure 3
Figure 3
RBX2 loss suppresses cancer metastasis. A. In vitro wound healing assay with human HCT116 and SW480 cells after knock out with RBX2 expression. Image was acquired at 0, 24 h time points after scratching (left panel). Scale bar represents 100 μm. Quantification of wound closure was calculated (right panel). B. Representative staining of invasive potentials of human HCT116 and SW480 cells from Transwell assay in vitro (left panel). Quantification of invasive cells per field was analyzed (right panel). Scale bar: 100 μm. Data were compared using the two-tailed students t-test, for indicated comparisons, **P < 0.01. C. RBX2 loss significant compromised tumor metastasis in melanoma B16F10 cells lung metastasis model in vivo. Quantification of lung metastatic was calculated (right panel).
Figure 4
Figure 4
The effects of RBX2 modulation on the growth of xenografts in nude mice. A. Western blot analysis of RBX2 in HCT116 and SW480 cells transfected with vector or RBX2 (left panel). RBX2 mRNA level in HCT116 and SW480 cell lines are evaluated by qPCR analysis (right panel). PCR values were normalized to the levels of β-actin. Data are presented as the mean ± SD from three independent measurements. B. MTT analysis of CRC cancer cells infected with the indicated lentivirus. 3 × 10³ cells were seeded in 96 well plates and cultured for the indicated hours. C. Colony formation assay of parental and RBX2 over-expressing CRC cells. Cells were plated in 6-well plate in complete medium and cultured for 14 days and colonies were stained and counted. D. HCT116 or SW480 cells infected with RBX2 or vector and then were implanted subcutaneously into Balb/c-nude mice to form xenografts. Representative images of tumor xenografts and immunohistochemistry analysis of Ki67 in xenografts of the indicated groups. Scale bar: 100 μm.
Figure 5
Figure 5
RBX2 overexpression in CRC cancer cells increase the migration and invasion. A. HCT116 and SW480 CRC cells with high RBX2 expression exhibited stronger migration abilities in wound healing assay (left panel). Scale bar represents 200 μm. Quantification of wound healing was calculated (right panel). Scale bar: 100 μm. B. HCT116 and SW480 CRC cells with high RBX2 expression exhibited stronger invasion abilities in Transwell assay. Scale bar: 200 μm. Data were compared using the two-tailed students t-test, for indicated comparisons, **P < 0.01 compared with the cells transfected with vector. Scale bar represents 100 μm. C. More metastatic foci in lung were visible in mouse injected with B16F10-RBX2 cells (left panel). Data were compared using the two-tailed Students t-test, **P < 0.01 compared with B16F10 cells transfected with vector. Quantification of lung metastasis loci was calculated (right panel).
Figure 6
Figure 6
RBX2 enhances chemotherapeutic sensitivity in colon cancer cells. A. RBX2 knock-out (KO) significantly enhanced the sensitivity of HCT116 to paclitaxel and significantly reduced their IC50 based on the MTT assay. The data were presented as mean ± SD. The values were expressed as percentage of viable cells normalized to percentage of viable cells in 0.5% DMSO-treated cells. The concentration of paclitaxel resulting in 50% inhibition of control growth (IC50) was calculated by SPSS statistics software using Probit model. B. Colony formation assay was performed to detect the chemotherapeutic effects of paclitaxel on RBX2 KO HCT116 cells and control cells growth in vitro. 1000 RBX2 KO HCT116 cells or parental cells were plated in 6-well plate in complete medium and cultured with paclitaxel. After two weeks, colonies were stained and counted. C. RBX2 knock-out HCT116 cells showed greater sensitivity towards paclitaxel. Values were presented as the mean ± SD for three independent experiments. **P < 0.01 compared with control cells, ##P < 0.01 compared to control cells treated with paclitaxel.
Figure 7
Figure 7
Inhibition of mTOR significantly suppresses RBX2 over-expression tumor cell growth. A. Enrichment scores of signaling pathways among RBX2 targets. B. Heat-map of genes differentially expressed in parental cells and RBX2 KO HCT116 cells. C. Western blot analysis of the expression of p-mTORC1S2448, p-mTORC2S2481, t-mTOR, p-S6K1T389 and S6K1 in the HCT116 cells in response to RBX2 up-regulation. β-actin was used as loading control. D. Whole cell lysates were prepared from everolimus and vehicle treated HCT116-RBX2 cells and examined for p-mTORC1S2448, p-mTORC2S2481, t-mTOR, p-S6K1T389 and S6K1 by immunoblotting. E. Cell growth rate from everolimus and vehicle treated HCT116-RBX2. F. Representative pictures (left panel) and statistical analysis (right panel) shown colony formation from everolimus and vehicle treated HCT116-RBX2 cells. G. In vitro wound closure of everolimus and vehicle treated HCT116-RBX2 cells from 24 h after scratch assay. Scale bar: 100 μm. H. Transwell invasion assay of everolimus and vehicle treated HCT116-RBX2 cells (left panel). Quantification of invasive cells per field was analyzed (right panel). Scale bar: 100 μm. Data were compared using the two-tailed students t-test, for indicated comparisons, **P < 0.01 compared to the cells treatment with vehicle. I. Mice were injected with HCT116-RBX2 cells and then were treated with everolimus and vehicle (n = 6). Tumor volume was analyzed at indicated time point. J. Histochemistry staining of Ki67, p-mTORC1S2448, p-mTORC2S2481 and p-S6K1T389 shown decreased positive cells from everolimus treated tumors originally from injection of HCT116-RBX2 cells compare to vehicle-treated group. Scale bar: 100 μm.
Figure 8
Figure 8
Proposed model of RBX2 promotes colon cancer metastasis via mTOR/S6K1 signaling pathway.

Similar articles

Cited by

References

    1. Zhang W, Shi X, Peng Y, Wu M, Zhang P, Xie R, Wu Y, Yan Q, Liu S, Wang J. HIF-1alpha promotes epithelial-mesenchymal transition and metastasis through direct regulation of ZEB1 in colorectal cancer. PLoS One. 2015;10:e0129603. - PMC - PubMed
    1. Qin Y, Tang B, Hu CJ, Xiao YF, Xie R, Yong X, Wu YY, Dong H, Yang SM. An hTERT/ZEB1 complex directly regulates E-cadherin to promote epithelial-to-mesenchymal transition (EMT) in colorectal cancer. Oncotarget. 2016;7:351–361. - PMC - PubMed
    1. Gu Q, Tan M, Sun Y. SAG/ROC2/Rbx2 is a novel activator protein-1 target that promotes c-Jun degradation and inhibits 12-O-tetradecanoylphorbol-13-acetate-induced neoplastic transformation. Cancer Res. 2007;67:3616–3625. - PubMed
    1. Huang Y, Duan H, Sun Y. Elevated expression of SAG/ROC2/Rbx2/Hrt2 in human colon carcinomas: SAG does not induce neoplastic transformation, but antisense SAG transfection inhibits tumor cell growth. Mol Carcinog. 2001;30:62–70. - PubMed
    1. Jia L, Yang J, Hao X, Zheng M, He H, Xiong X, Xu L, Sun Y. Validation of SAG/RBX2/ROC2 E3 ubiquitin ligase as an anticancer and radiosensitizing target. Clin Cancer Res. 2010;16:814–824. - PMC - PubMed

LinkOut - more resources