

Alterations of Clock Gene RNA Expression in Brain Regions of a Triple Transgenic Model of Alzheimer's Disease
- PMID: 28671110
- PMCID: PMC5523844
- DOI: 10.3233/JAD-160942
Alterations of Clock Gene RNA Expression in Brain Regions of a Triple Transgenic Model of Alzheimer's Disease
Abstract
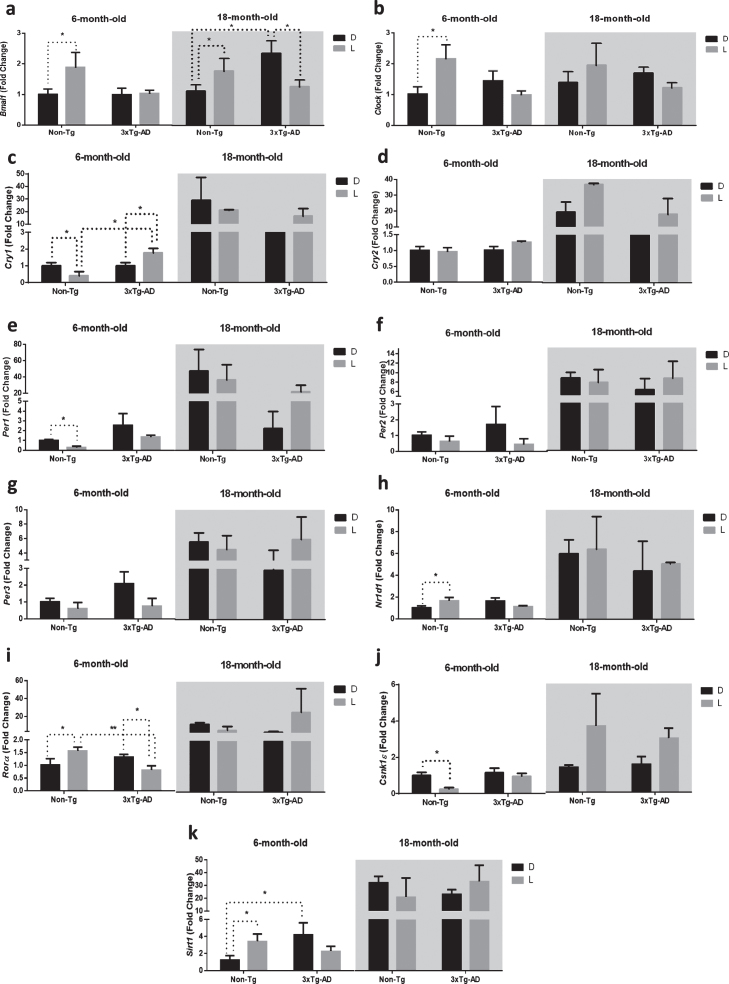
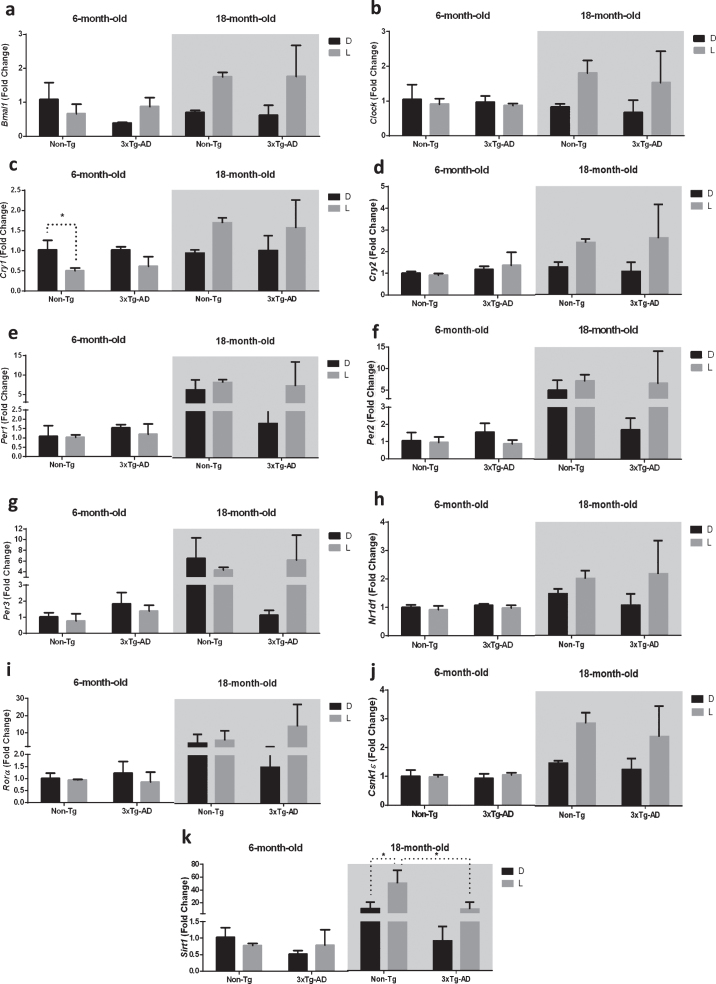
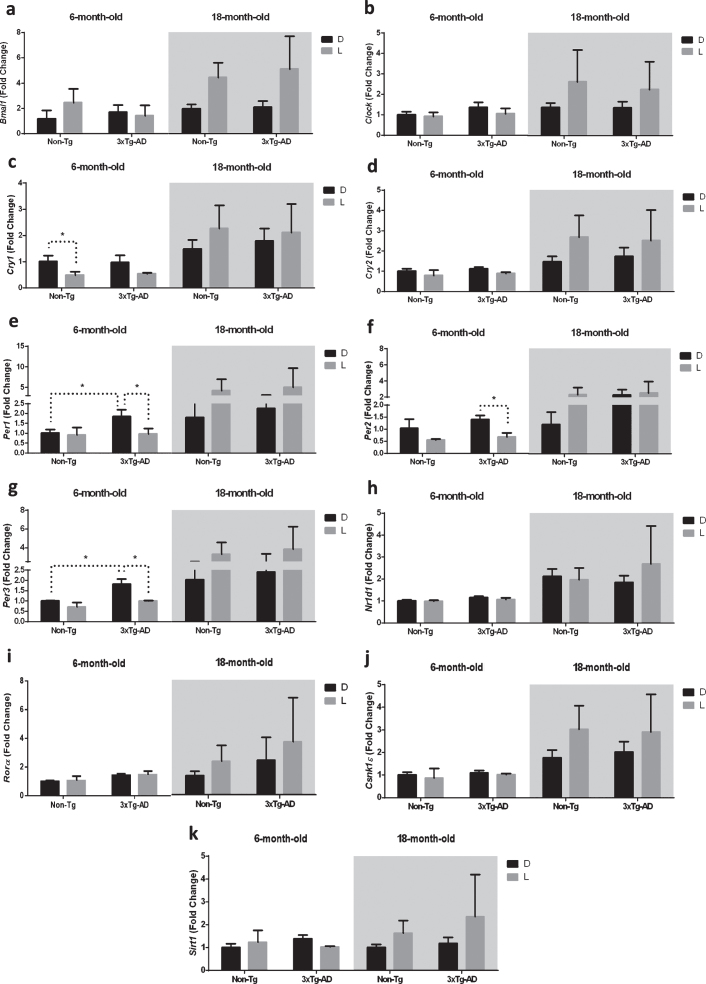
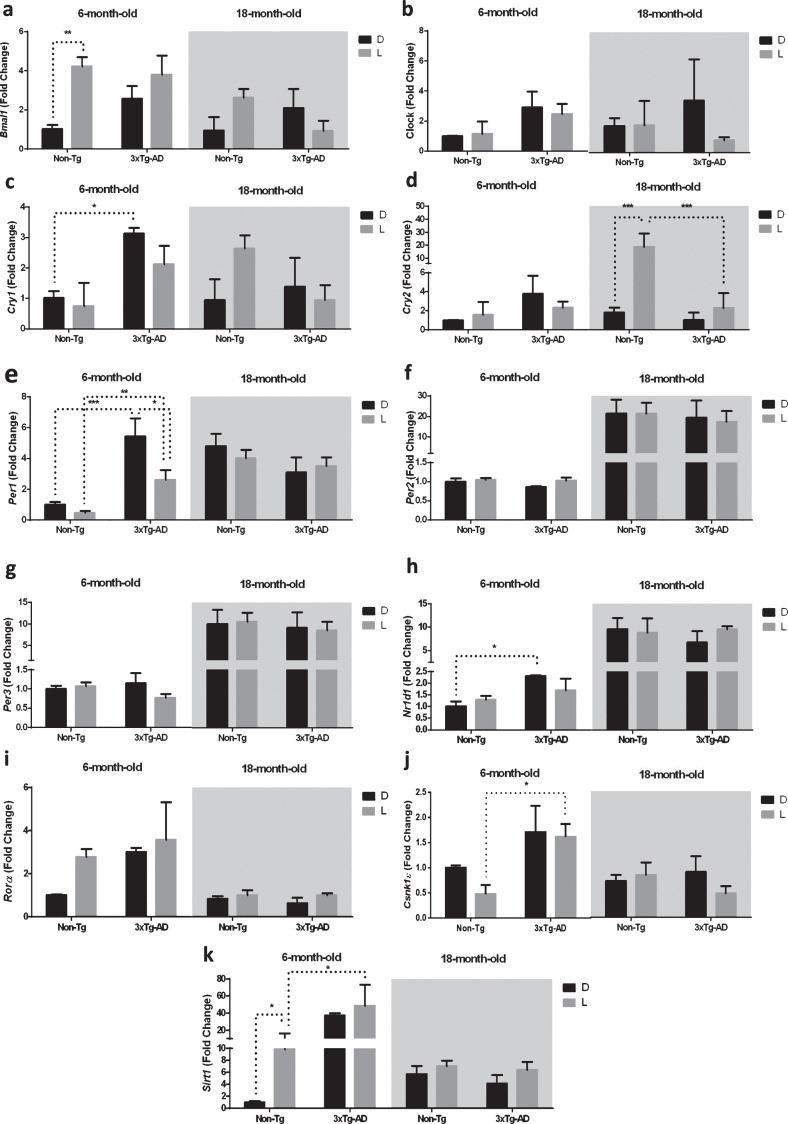
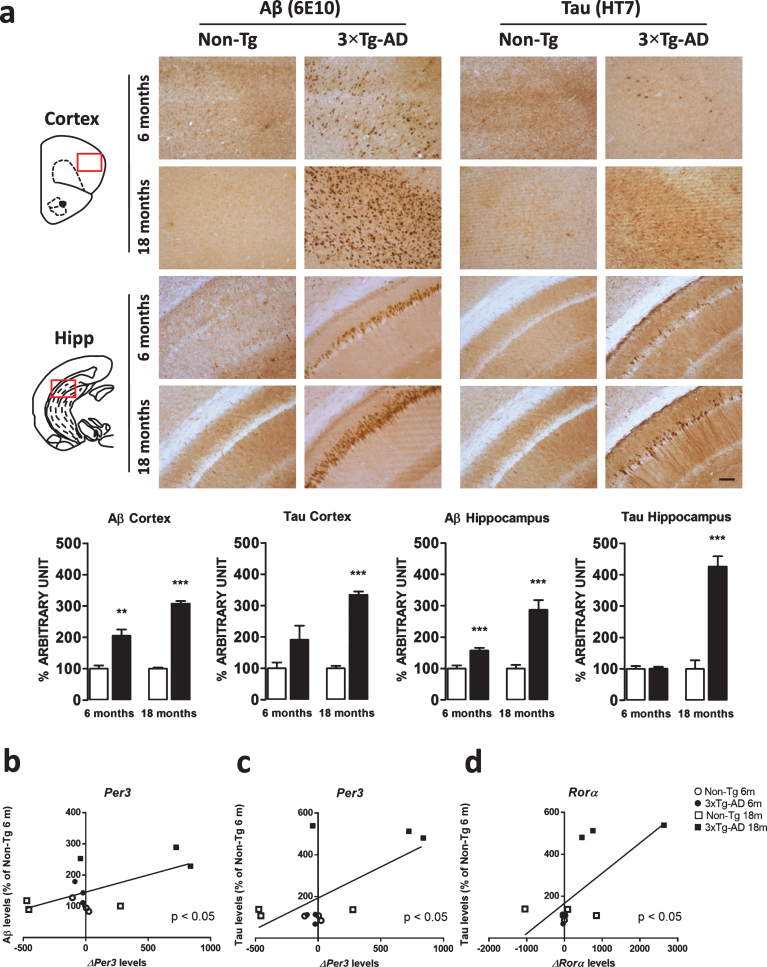
A disruption to circadian rhythmicity and the sleep/wake cycle constitutes a major feature of Alzheimer's disease (AD). The maintenance of circadian rhythmicity is regulated by endogenous clock genes and a number of external Zeitgebers, including light. This study investigated the light induced changes in the expression of clock genes in a triple transgenic model of AD (3×Tg-AD) and their wild type littermates (Non-Tg). Changes in gene expression were evaluated in four brain areas¾suprachiasmatic nucleus (SCN), hippocampus, frontal cortex and brainstem¾of 6- and 18-month-old Non-Tg and 3×Tg-AD mice after 12 h exposure to light or darkness. Light exposure exerted significant effects on clock gene expression in the SCN, the site of the major circadian pacemaker. These patterns of expression were disrupted in 3×Tg-AD and in 18-month-old compared with 6-month-old Non-Tg mice. In other brain areas, age rather than genotype affected gene expression; the effect of genotype was observed on hippocampal Sirt1 expression, while it modified the expression of genes regulating the negative feedback loop as well as Rorα, Csnk1ɛ and Sirt1 in the brainstem. In conclusion, during the early development of AD, there is a disruption to the normal expression of genes regulating circadian function after exposure to light, particularly in the SCN but also in extra-hypothalamic brain areas supporting circadian regulation, suggesting a severe impairment of functioning of the clock gene pathway. Even though this study did not demonstrate a direct association between these alterations in clock gene expression among brain areas with the cognitive impairments and chrono-disruption that characterize the early onset of AD, our novel results encourage further investigation aimed at testing this hypothesis.
Keywords: Aging; Alzheimer’s disease; clock genes; light exposure; suprachiasmatic nucleus.
Figures
Similar articles
-
Dysregulated clock gene expression and abnormal diurnal regulation of hippocampal inhibitory transmission and spatial memory in amyloid precursor protein transgenic mice.Neurobiol Dis. 2021 Oct;158:105454. doi: 10.1016/j.nbd.2021.105454. Epub 2021 Jul 30. Neurobiol Dis. 2021. PMID: 34333153 Free PMC article.
-
Abnormal circadian locomotor rhythms and Per gene expression in six-month-old triple transgenic mice model of Alzheimer's disease.Neurosci Lett. 2018 May 29;676:13-18. doi: 10.1016/j.neulet.2018.04.008. Epub 2018 Apr 4. Neurosci Lett. 2018. PMID: 29626648
-
Degeneration and energy shortage in the suprachiasmatic nucleus underlies the circadian rhythm disturbance in ApoE-/- mice: implications for Alzheimer's disease.Sci Rep. 2016 Nov 8;6:36335. doi: 10.1038/srep36335. Sci Rep. 2016. PMID: 27824104 Free PMC article.
-
Moving to the Rhythm with Clock (Circadian) Genes, Autophagy, mTOR, and SIRT1 in Degenerative Disease and Cancer.Curr Neurovasc Res. 2017;14(3):299-304. doi: 10.2174/1567202614666170718092010. Curr Neurovasc Res. 2017. PMID: 28721811 Free PMC article. Review.
-
Circadian clock genes and sleep homeostasis.Eur J Neurosci. 2009 May;29(9):1820-9. doi: 10.1111/j.1460-9568.2009.06723.x. Epub 2009 Apr 28. Eur J Neurosci. 2009. PMID: 19473235 Review.
Cited by
-
Repetitive transcranial magnetic stimulation for cognitive impairment in Alzheimer's disease: a meta-analysis of randomized controlled trials.J Neurol. 2020 Mar;267(3):791-801. doi: 10.1007/s00415-019-09644-y. Epub 2019 Nov 23. J Neurol. 2020. PMID: 31760522
-
Neurodegeneration, memory loss, and dementia: the impact of biological clocks and circadian rhythm.Front Biosci (Landmark Ed). 2021 Sep 30;26(9):614-627. doi: 10.52586/4971. Front Biosci (Landmark Ed). 2021. PMID: 34590471 Free PMC article. Review.
-
Evaluating Circadian Dysfunction in Mouse Models of Alzheimer's Disease: Where Do We Stand?Front Neurosci. 2020 Jul 7;14:703. doi: 10.3389/fnins.2020.00703. eCollection 2020. Front Neurosci. 2020. PMID: 32733196 Free PMC article. Review.
-
Clinical relevance of biomarkers, new therapeutic approaches, and role of post-translational modifications in the pathogenesis of Alzheimer's disease.Front Aging Neurosci. 2022 Sep 7;14:977411. doi: 10.3389/fnagi.2022.977411. eCollection 2022. Front Aging Neurosci. 2022. PMID: 36158539 Free PMC article. Review.
-
Melatonin as a Harmonizing Factor of Circadian Rhythms, Neuronal Cell Cycle and Neurogenesis: Additional Arguments for Its Therapeutic Use in Alzheimer's Disease.Curr Neuropharmacol. 2023;21(5):1273-1298. doi: 10.2174/1570159X21666230314142505. Curr Neuropharmacol. 2023. PMID: 36918783 Free PMC article. Review.
References
-
- Moore RY, Silver R (1998) Suprachiasmatic nucleus organization. Chronobiol Int 15, 475–487. - PubMed
-
- Mrosovsky N (1996) Locomotor activity and non-photic influences on circadian clocks. Biol Rev Camb Philos Soc 71, 343–372. - PubMed
-
- Van Der Zee EA, Boersma GJ, Hut RA (2009) The neurobiology of circadian rhythms. Curr Opin Pulm Med 15, 534–539. - PubMed
-
- Antle MC, Silver R (2005) Orchestrating time: Arrangements of the brain circadian clock. Trends Neurosci 28, 145–151. - PubMed
-
- Franken P, Dijk DJ (2009) Circadian clock genes and sleep homeostasis. Eur J Neurosci 29, 1820–1829. - PubMed
MeSH terms
Substances
LinkOut - more resources
Full Text Sources
Other Literature Sources
Medical
Miscellaneous
