

A point-of-care microfluidic biochip for quantification of CD64 expression from whole blood for sepsis stratification
- PMID: 28671185
- PMCID: PMC5500847
- DOI: 10.1038/ncomms15949
A point-of-care microfluidic biochip for quantification of CD64 expression from whole blood for sepsis stratification
Abstract
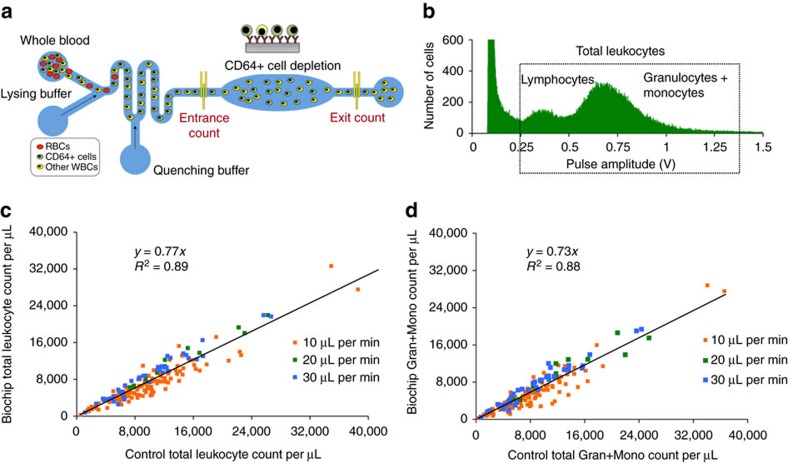
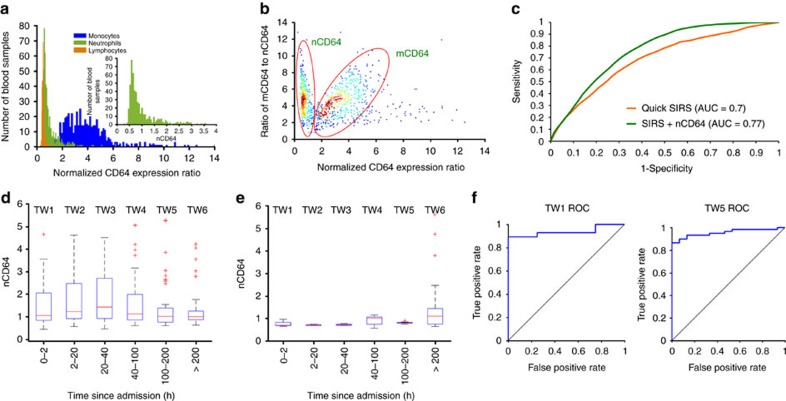
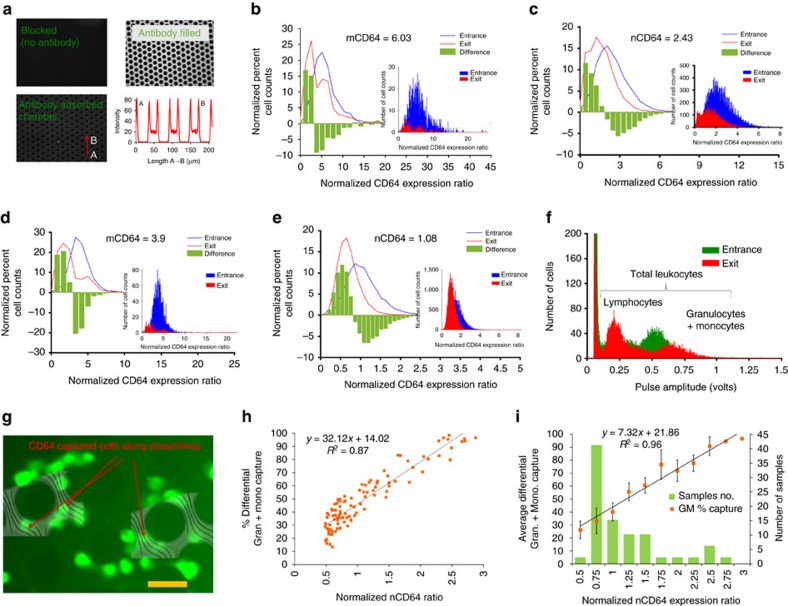
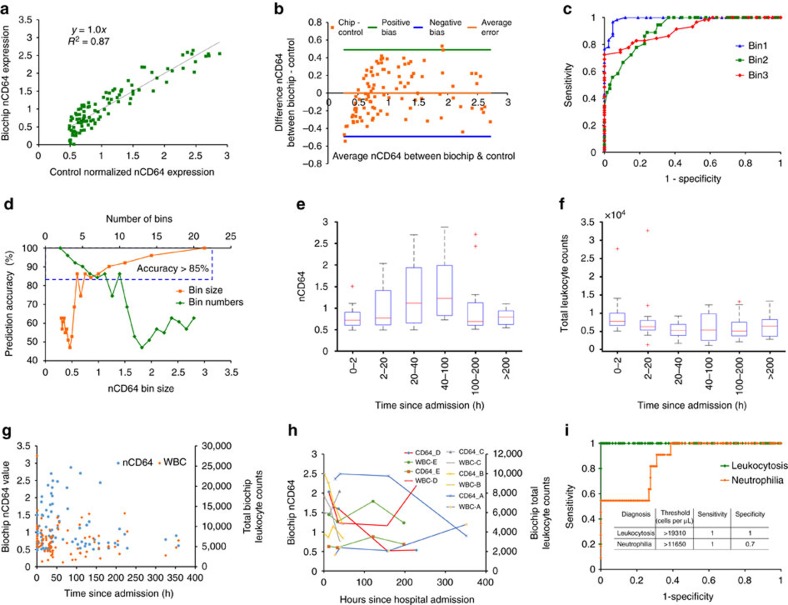
Sepsis, a potentially life-threatening complication of an infection, has the highest burden of death and medical expenses in hospitals worldwide. Leukocyte count and CD64 expression on neutrophils (nCD64) are known to correlate strongly with improved sensitivity and specificity of sepsis diagnosis at its onset. A major challenge is the lack of a rapid and accurate point-of-care (PoC) device that can perform these measurements from a minute blood sample. Here, we report a PoC microfluidic biochip to enumerate leukocytes and quantify nCD64 levels from 10 μl of whole blood without any manual processing. Biochip measurements have shown excellent correlation with the results from flow cytometer. In clinical studies, we have used PoC biochip to monitor leukocyte counts and nCD64 levels from patients' blood at different times of their stay in the hospital. Furthermore, we have shown the biochip's utility for improved sepsis diagnosis by combining these measurements with electronic medical record (EMR).
Conflict of interest statement
B.R., R.B. and U.H. have financial interests in Prenosis, Inc. All other authors declare no competing financial interests.
Figures
Similar articles
-
Smartphone-imaged microfluidic biochip for measuring CD64 expression from whole blood.Analyst. 2019 Jul 7;144(13):3925-3935. doi: 10.1039/c9an00532c. Epub 2019 May 16. Analyst. 2019. PMID: 31094395
-
Serial determinations of neutrophil CD64 expression for the diagnosis and monitoring of sepsis in critically ill patients.Clin Infect Dis. 2014 Mar;58(6):820-9. doi: 10.1093/cid/cit936. Epub 2013 Dec 20. Clin Infect Dis. 2014. PMID: 24363321
-
Multivariate computational analysis of biosensor's data for improved CD64 quantification for sepsis diagnosis.Lab Chip. 2018 Apr 17;18(8):1231-1240. doi: 10.1039/C8LC00108A. Lab Chip. 2018. PMID: 29564463
-
Neutrophil CD64: a diagnostic marker for infection and sepsis.Clin Chem Lab Med. 2009;47(8):903-16. doi: 10.1515/CCLM.2009.224. Clin Chem Lab Med. 2009. PMID: 19642859 Review.
-
Diagnostic Value of Neutrophil CD64 in Burn Patients With Infection in Chinese Population: A Systematic Review and Meta-analysis.J Burn Care Res. 2021 Nov 24;42(6):1192-1198. doi: 10.1093/jbcr/irab033. J Burn Care Res. 2021. PMID: 33625516
Cited by
-
Role of the interferons in CD64 and CD169 expressions in whole blood: Relevance in the balance between viral- or bacterial-oriented immune responses.Immun Inflamm Dis. 2020 Mar;8(1):106-123. doi: 10.1002/iid3.289. Epub 2020 Feb 7. Immun Inflamm Dis. 2020. PMID: 32031762 Free PMC article.
-
Rapid, multiplexed detection of biomolecules using electrically distinct hydrogel beads.Lab Chip. 2020 Jun 30;20(13):2274-2283. doi: 10.1039/d0lc00243g. Lab Chip. 2020. PMID: 32490455 Free PMC article.
-
The Role of Neutrophil CD11b Compared to Neutrophil CD64 as an Early Diagnostic, Monitoring, and Prognostic Sepsis Marker in Neonatal ICUs: Case-Control-Methodological Study.Biomed Res Int. 2025 Mar 12;2025:7206112. doi: 10.1155/bmri/7206112. eCollection 2025. Biomed Res Int. 2025. PMID: 40224545 Free PMC article.
-
Microfluidic Based Optical Microscopes on Chip.Cytometry A. 2018 Oct;93(10):987-996. doi: 10.1002/cyto.a.23589. Epub 2018 Sep 13. Cytometry A. 2018. PMID: 30211977 Free PMC article. Review.
-
Porous Structural Microfluidic Device for Biomedical Diagnosis: A Review.Micromachines (Basel). 2023 Feb 26;14(3):547. doi: 10.3390/mi14030547. Micromachines (Basel). 2023. PMID: 36984956 Free PMC article. Review.
References
-
- Lagu T. et al.. Hospitalizations, costs, and outcomes of severe sepsis in the United States 2003 to 2007. Crit. Care Med. 40, 754–761 (2012). - PubMed
-
- Gaieski D. F., Edwards M., Kallan K. J. & Carr B. G. Benchmarking the incidence and mortality of severe sepsis in the United States. Crit. Care Med. 41, 1167 (2013). - PubMed
-
- Daniels R. Surviving the first hours in sepsis: getting the basics right (an intensivist’s perspective). J. Antimicrob. Chemother. 66, ii11–ii23 (2011). - PubMed
Publication types
MeSH terms
Substances
LinkOut - more resources
Full Text Sources
Other Literature Sources
Medical
Molecular Biology Databases
