. 2017 Jul 3:8:15965.
doi: 10.1038/ncomms15965.

Compensatory metabolic networks in pancreatic cancers upon perturbation of glutamine metabolism

Affiliations

Compensatory metabolic networks in pancreatic cancers upon perturbation of glutamine metabolism

Douglas E Biancur et al. Nat Commun. .

Abstract

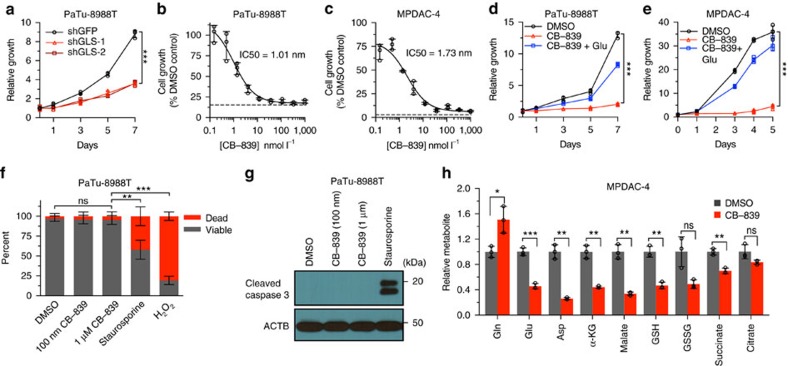
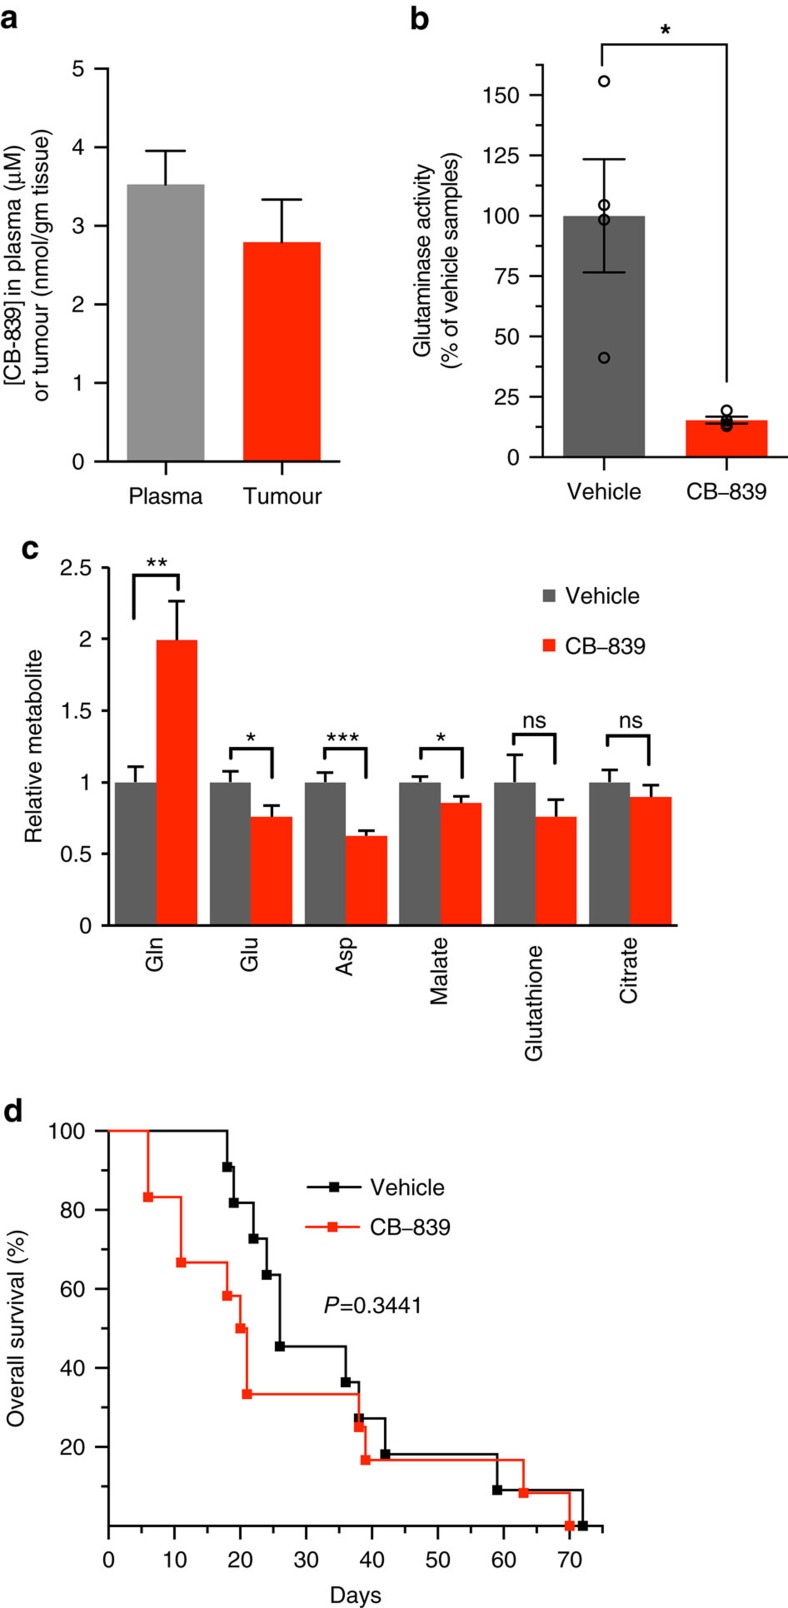
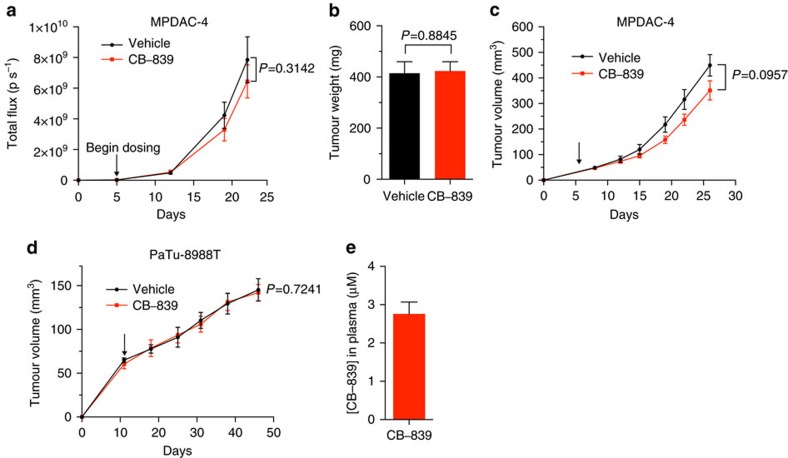
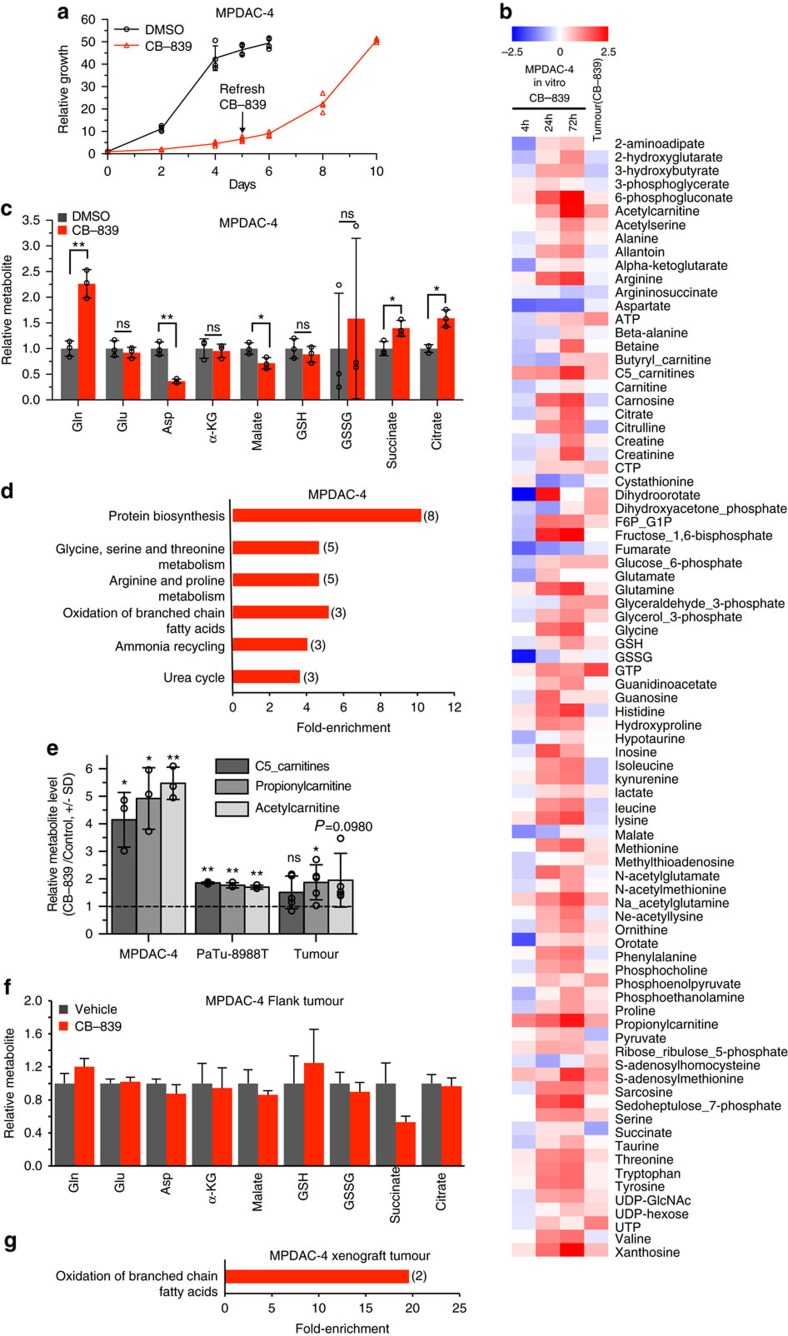
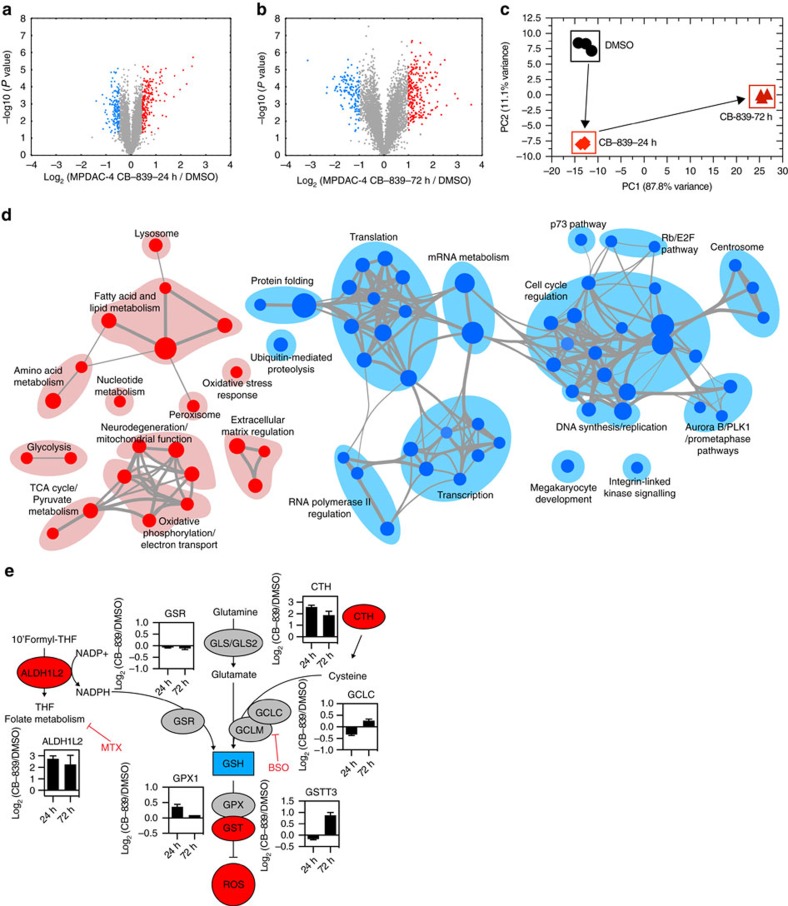
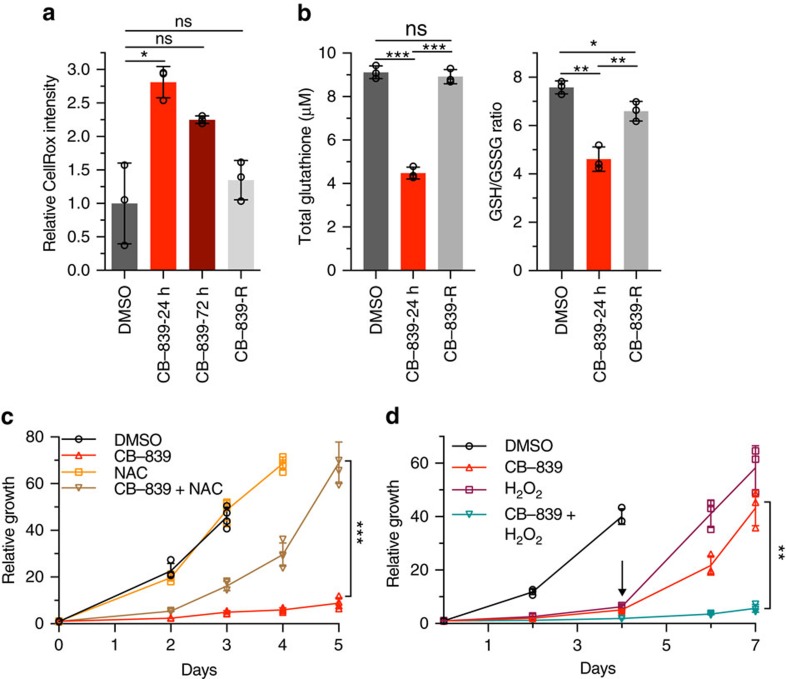
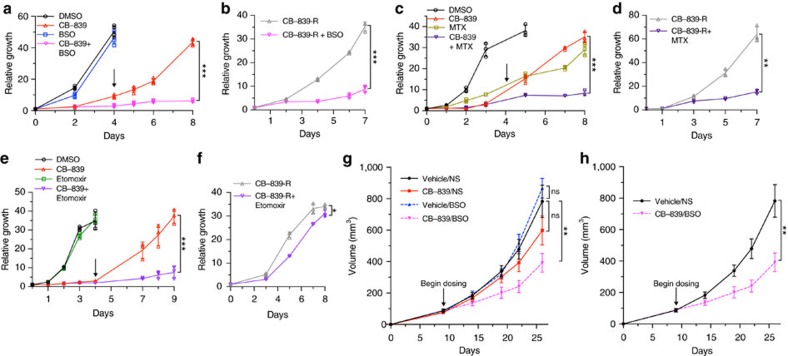
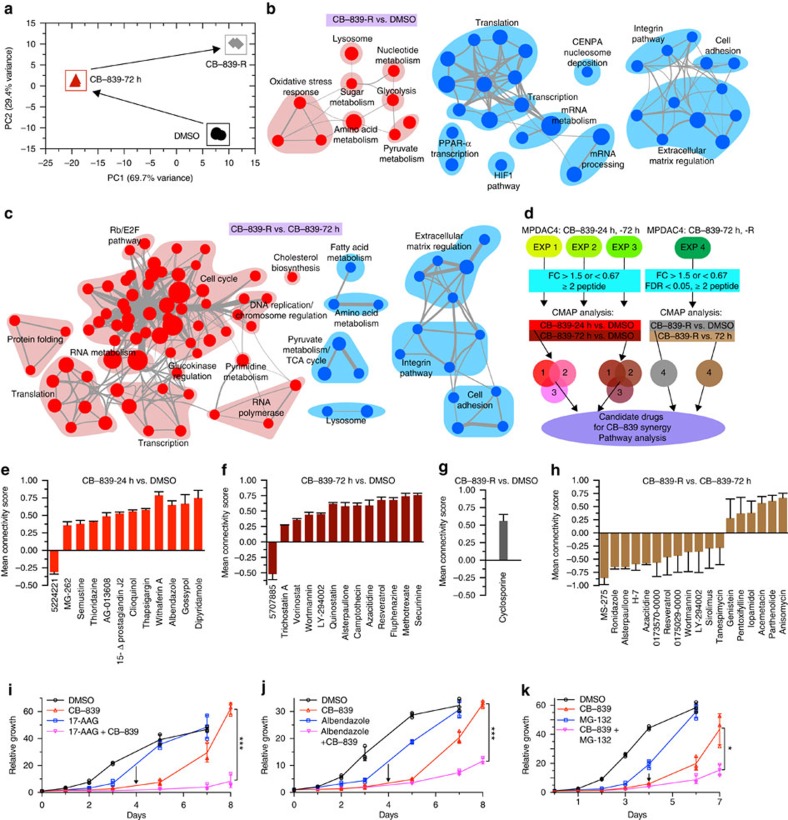
Pancreatic ductal adenocarcinoma is a notoriously difficult-to-treat cancer and patients are in need of novel therapies. We have shown previously that these tumours have altered metabolic requirements, making them highly reliant on a number of adaptations including a non-canonical glutamine (Gln) metabolic pathway and that inhibition of downstream components of Gln metabolism leads to a decrease in tumour growth. Here we test whether recently developed inhibitors of glutaminase (GLS), which mediates an early step in Gln metabolism, represent a viable therapeutic strategy. We show that despite marked early effects on in vitro proliferation caused by GLS inhibition, pancreatic cancer cells have adaptive metabolic networks that sustain proliferation in vitro and in vivo. We use an integrated metabolomic and proteomic platform to understand this adaptive response and thereby design rational combinatorial approaches. We demonstrate that pancreatic cancer metabolism is adaptive and that targeting Gln metabolism in combination with these adaptive responses may yield clinical benefits for patients.


Conflict of interest statement

A.C.K. is a founder and has financial interests in Vescor Therapeutics, LLC. A.C.K. is an inventor on patents pertaining to Kras regulated metabolic pathways, redox control pathways in pancreatic cancer, targeting GOT1 as a therapeutic approach and the autophagic control of iron metabolism. A.C.K is on the SAB of Cornerstone Pharmaceuticals. J.D.M. is an inventor on a patent pertaining to the autophagic control of iron metabolism. All other authors declare no competing financial interests.

Figures

Figure 1
Figure 1. GLSi with CB-839 has antiproliferative activity in PDAC cell lines.
(a) Relative proliferation of PaTu-8988T cells expressing a control shRNA or shRNAs to GLS (#1 and #2). Data are plotted as relative cell proliferation in arbitrary units. Error bars depict±s.d. of three independent wells from a representative experiment (of four experiments). (b,c) Cell proliferation dose–response curves for PaTu-8988T (b) and MPDAC-4 (c) treated with CB-839 for 72 h. The dashed line indicates the relative reporter signal at the time of CB-839 addition. Error bars depict±s.d. of three independent wells from a representative experiment (of three experiments). (d,e) Relative proliferation of PDAC cell lines, PaTu-8998T (d) and MPDAC-4 (e) treated with CB-839 (100 nm) or DMSO. As indicated, glutamate (Glu, 4 mM) was added to the media at the time of CB-839 addition. Error bars depict±s.d. of three (d) or four (e) independent wells from a representative experiment (of four experiments). (f) PaTu-8988T cell viability as determined by trypan blue exclusion assay at 72 h after DMSO and CB-839. Staurosporine (1 μm) and H2O2 (1 mM) positive controls treated for 3 h. Data are represented as mean±s.d. of three independent wells from a representative experiment (of four experiments). (g) Cleaved Caspase-3 western blotting analysis of extracts from PaTu-8988T cells at 72 h after DMSO or CB-839. Staurosporine positive controls treated for 3 h. (h) Relative metabolite abundance in MPDAC-4 cells following 6 h CB-839 treatment. Data are presented as mean total metabolite pools±s.d. of three independent wells from a representative experiment (of three experiments). For all panels, significance determined with t-test. *P<0.05, **P<0.01, ***P<0.001, ns: non-significant, P>0.05.
Figure 2
Figure 2. CB-839 treatment has no antitumour activity in an autochthonous mouse model of PDAC.
(a) CB-839 levels measured by LC/MS-MS in plasma and tumour samples 4 h after oral dosing of 200 mg kg-1 CB-839 of LSL-KrasG12D; p53 L/+, Pdx1-Cre mice bearing pancreatic tumours (plasma, n=5 independent mice; tumour, two separate pieces from each tumour of five mice, n=10). Data are represented as mean±s.e.m. (b) Glutaminase activity measured in tumour lysates from animals (n=4 per group) treated with vehicle or CB-839 as in (a). The percent inhibition by CB-839 relative to vehicle is plotted, n=4. Data are represented as mean±s.e.m. (c) Relative metabolite abundance in tumour lysates from animals treated as in (a) (2–3 tumour pieces from five mice per group, n=11 vehicle treated, n=10 CB-839 treated). Data are presented as mean total metabolite pools±s.e.m. (d) Kaplan–Meier analysis comparing survival of vehicle (black, n=11) and CB-839 (red, n=13) treated LSL-KrasG12D; p53 L/+, Pdx1-Cre mice bearing pancreatic tumours. There was no significant effect on survival (P=0.3441 by Log-rank (Mantel–Cox) test). For panels b,c, significance determined by t-test, *P<0.05, **P<0.01, ***P<0.001, ns: non-significant, P>0.05.
Figure 3
Figure 3. CB-839 treatment has no antitumour activity in cell line-derived transplanted mouse models of PDAC.
(a) MPDAC-4 cells constitutively expressing luciferase were implanted into the pancreata of nude mice. Mice were then randomized to CB-839 treatment (200 mg kg−1, twice daily) or control (vehicle) treatment (n=13 vehicle arm, n=16 CB-839 arm) and imaged weekly with luciferase imaging. Arrow indicates treatment initiation. Data were expressed as mean total flux (p/s)±s.e.m. A t-test was performed at the end point, P=0.3142. (b) Tumour weight from mice at the end point of experiment in (a) presented as mean±s.e.m. P=0.8845 (t-test). (c) MPDAC-4 cells were implanted subcutaneously in nude mice and after the average tumour size of the cohort reached ∼50 mm3 mice were randomized and treated as indicated with vehicle or CB-839 (200 mg kg−1, twice daily), (vehicle, n=14; CB-839, n=13). Tumours were measured twice a week. Error bars represent±s.e.m. A t-test was performed at the end point, P=0.0957. (d) PaTu-8988T cells were grown as xenograft tumours in the flanks of nude mice, mice were randomized and treated as in (c). Tumours were measured weekly (vehicle, n=9; CB-839, n=8). Error bars represent ±s.e.m. A t-test was performed at the end point, P=0.7241. (e) CB-839 levels in plasma from MPDAC-4 tumour bearing mice treated with CB-839 in (c), measured at end point, n=13. Data presented as mean±s.e.m.
Figure 4
Figure 4. PDAC GLSi metabolic profiling identifies common upregulated pathways.
(a) Relative proliferation of MPDAC-4 cell line treated long-term with CB-839 (1 μm) or DMSO. As indicated CB-839 was refreshed at the mid-point of the experiment. Error bars depict±s.d. of four independent wells from a representative experiment (of four experiments). (b) Log2(CB-839 treated sample/control) heatmap for metabolites measured from MPDAC-4 cell culture (at 4, 24 and 72 h) and MPDAC-4 xenograft tumour experiment from Fig. 3c. Values presented for cell culture data are the mean of three independent wells from a representative experiment (of three experiments). Values presented for tumour are the mean of five independent tumours. (c) Relative metabolite abundance in MPDAC-4 cells following 72 h CB-839 treatment. Data are presented as means of total metabolite pools±s.d. of three independent wells from a representative experiment (of three experiments). (d) Metabolite set enrichment analysis (MSEA) of upregulated metabolites from MPDAC-4 72 h CB-839 metabolomics experiment as performed in (b), statistically significant terms are graphed according to fold-enrichment (number of metabolites represented in term in parentheses). (e) Relative metabolite levels (CB-839 treated sample/control) plotted for carnitine metabolites from cell culture experiments (MPDAC-4, PaTu-8988T, means of total metabolite pools±s.d. of three independent wells from a representative experiment (of three experiments)) and MPDAC-4 tumour experiment (tumours from experiment described in Fig. 3c, means of total metabolite pools±s.d., n=5 independent tumours). (f) Relative metabolite abundance in MPDAC-4 flank tumours as in Fig. 3c following long-term CB-839 treatment, n=5 tumours per group, error bars represent s.e.m. All comparisons non-significant, P>0.05. (g) Metabolite set enrichment analysis (MSEA) of significantly upregulated metabolites from MPDAC-4 tumour CB-839 metabolomics experiment. For c,e and f, significance determined by t-test, *P<0.05, **P<0.01, ***P<0.001, ns: non-significant, P>0.05.
Figure 5
Figure 5. PDAC GLSi proteomics identifies up- and downregulated pathways.
(a,b) Volcano plots illustrate statistically significant protein abundance differences in MPDAC-4 cells treated with CB-839 for 24 h (a) or 72 h (b). Volcano plots display the –log10(P value) versus the log2 of the relative protein abundance of (a) mean CB-839 24 h treatment or (b) mean CB-839 72 h treatment to mean control (DMSO). Red circles represent the top 5% upregulated proteins with a P value<0.05, blue circles represent the 5% most downregulated proteins and a P value <0.05. The remainder of proteins are represented as gray circles. Data are from three independent plates from a representative experiment of three experiments. (c) Principal component analysis of the CB-839 treated proteomes represented in a two-dimensional space. (d) Enrichment map of gene set enrichment analysis (GSEA) of CB-839-72 h versus DMSO, FDR<0.01, co-efficient overlap (CO) >0.25, node size is related to number of components identified within a gene set and the width of the line is proportional to the overlap between related gene sets. GSEA terms associated with upregulated (red) and downregulated (blue) proteins are coloured accordingly and grouped into nodes with associated terms. (e) Proteins in the oxidative stress response protein network are upregulated in response to CB-839 treatment. Graphs represent mean of Log2(CB-839 treated sample/control) from MPDAC-4 Experiments 1–3 of select proteins in oxidative stress response pathways (n=9, three independent plates for each Experiment 1–3). Error bars represent±s.e.m. Upregulated (red), downregulated (blue), no relative change (grey). Abbreviations: ALDH1L2: Aldehyde Dehydrogenase 1 Family Member L2, GSR: Glutathione reductase, mitochondrial, GLS: Glutaminase, GLS2: Glutaminase 2, CTH: Cystathionine gamma-lyase, GCLC: Glutamate-cysteine ligase catalytic subunit, GCLM: Glutamate-cysteine ligase regulatory subunit, GPX1: Glutathione peroxidase 1, GSTT3: Glutathione S-transferase Theta 3, MTX: Methotrexate, BSO: L-Buthionine-S,R-sulfoximine.
Figure 6
Figure 6. GLSi induces an oxidative stress response in PDAC cells.
(a) Relative CellRox intensity in MPDAC-4 cells following CB-839 treatment at the indicated times as measured by flow cytometry. Data are presented as mean±s.d. of three independent wells from a representative experiment (of three experiments). (b) Total glutathione levels (left) and ratio of reduced to oxidized (right) after CB-839 treatment. Data are presented as mean±s.d. of three independent wells from a representative experiment (of three experiments). (c) Relative proliferation of MPDAC-4 cell line treated with CB-839 or DMSO with or without N-acetyl cysteine (2 mM). Data are plotted as mean relative cell proliferation, error bars depict±s.d. of four independent wells from a representative experiment (of three experiments). (d) Relative proliferation of MPDAC-4 cell line treated with CB-839 or DMSO with or without hydrogen peroxide (H2O2) (20 μm). Data are plotted as mean relative cell proliferation, error bars depict±s.d. of three independent wells from a representative experiment (of three experiments). Arrow represents time point when treatments were refreshed. Significance determined by t-test in all panels. *P<0.05, **P<0.01, ***P<0.001, ns: non-significant, P>0.05.
Figure 7
Figure 7. GLSi proteomics and metabolomics predicts responsiveness to oxidative stress targeted combination treatment.
(a) Relative proliferation of MPDAC-4 cell line treated with CB-839 or DMSO with or without BSO (100 μm). Data are plotted as mean relative cell proliferation, error bars depict±s.d. of four independent wells from a representative experiment (of three experiments). Arrow represents time point when treatments were refreshed, similarly in c,e. (b) Relative proliferation of CB-839-resistant (CB-839-R) MPDAC-4 cell line treated with CB-839 alone or in combination with BSO (100 μm). Data are plotted as mean relative cell proliferation, error bars depict±s.d. of three independent wells from a representative experiment (of three experiments). (c) Relative proliferation of MPDAC-4 cell line treated with CB-839 or DMSO with or without methotrexate (MTX) (50 nm). Data are plotted as mean relative cell proliferation, error bars depict±s.d. of three independent wells from a representative experiment (of three experiments). (d) Relative proliferation of CB-839-R MPDAC-4 cell line treated with CB-839 alone or in combination with methotrexate (50 nm). Data are plotted as mean relative cell proliferation, error bars depict±s.d. of three independent wells from a representative experiment (of three experiments). (e) Relative proliferation of MPDAC-4 cell line treated with CB-839 or DMSO with or without etomoxir (100 μm). Data are plotted as mean relative cell proliferation, error bars depict±s.d. of three independent wells from a representative experiment (of three experiments). (f) Relative proliferation of CB-839-R MPDAC-4 cell line treated with CB-839 alone or in combination with etomoxir (100 μm). Data are plotted as mean relative cell proliferation, error bars depict±s.d. of three independent wells from a representative experiment (of three experiments). (g) MPDAC-4 cells were implanted subcutaneously in nude mice and after the average tumour size of the cohort reached ∼50 mm3 mice were randomized and treated as indicated with vehicle, CB-839, BSO, or CB-839 and BSO, (n=8 per arm), see methods for full details of dosing. Tumours were measured twice a week. Error bars represent±s.e.m. (h) Data as in (g) reproduced without CB-839 and BSO arms. Error bars represent±s.e.m. Significance determined by t-test in all panels. *P<0.05, **P<0.01, ***P<0.001, ns: non-significant, P>0.05.
Figure 8
Figure 8. GLSi proteomics and metabolomics analysis predicts responsiveness to combinatorial treatment.
(a) Principal component analysis of the CB-839 treated proteomes represented in a two-dimensional space. (b) Enrichment map of GSEA of CB-839-R versus DMSO, FDR<0.05, co-efficient overlap (CO) >0.1, otherwise plotted as in Fig. 5d. (c) Enrichment map of GSEA of CB-839-R versus CB-839-72 h, FDR<0.01, co-efficient overlap (CO) >0.25. (d) Connectivity map (CMAP) workflow schematic for identification of candidate drugs for CB-839 synergy and pathway analysis. (e) CMAP analysis CB-839-24 h versus DMSO. Data represent mean connectivity score±s.d. as determined from CMAP analysis of Experiments 1–3 independently. (f) CMAP analysis CB-839-72 h versus DMSO as in (e). (g) CMAP analysis CB-839-R versus DMSO. Data represent mean connectivity score±s.d. from CMAP analysis of Experiment 4. (h) CMAP analysis CB-839-R versus CB-839-72 h as in g. (i) Relative proliferation of MPDAC-4 cell line treated with CB-839 or DMSO with or without 17-AAG (tanespimycin) (500 nm). (j) Relative proliferation of MPDAC-4 cell line treated with CB-839 or DMSO with or without albendazole (Prestwick-675) (400 nm). (k) Relative proliferation of MPDAC-4 cell line treated with CB-839 or DMSO with or without MG-132 (500 nm). Data for i,j,k are plotted as mean relative cell proliferation, error bars depict±s.d. of three independent wells from a representative experiment (of three experiments). For panels i,j,k, significance determined by t-test, *P<0.05, **P<0.01, ***P<0.001, ns: non-significant, P>0.05.

References

    1. Ying H. et al. Genetics and biology of pancreatic ductal adenocarcinoma. Genes Dev. 30, 355–385 (2016). - PMC - PubMed
    1. Siegel R. L., Miller K. D. & Jemal A. Cancer statistics, 2016. CA. Cancer J. Clin. 66, 7–30 (2016). - PubMed
    1. Almoguera C. et al. Most human carcinomas of the exocrine pancreas contain mutant c-K-ras genes. Cell 53, 549–554 (1988). - PubMed
    1. Waddell N. et al. Whole genomes redefine the mutational landscape of pancreatic cancer. Nature 518, 495–501 (2015). - PMC - PubMed
    1. Bailey P. et al. Genomic analyses identify molecular subtypes of pancreatic cancer. Nature 531, 47–52 (2016). - PubMed

Publication types