. 2017 Jul 3;6(7):e352.
doi: 10.1038/oncsis.2017.54.

Matrix stiffness induces epithelial-mesenchymal transition and promotes chemoresistance in pancreatic cancer cells

Affiliations

Matrix stiffness induces epithelial-mesenchymal transition and promotes chemoresistance in pancreatic cancer cells

A J Rice et al. Oncogenesis. .

Abstract

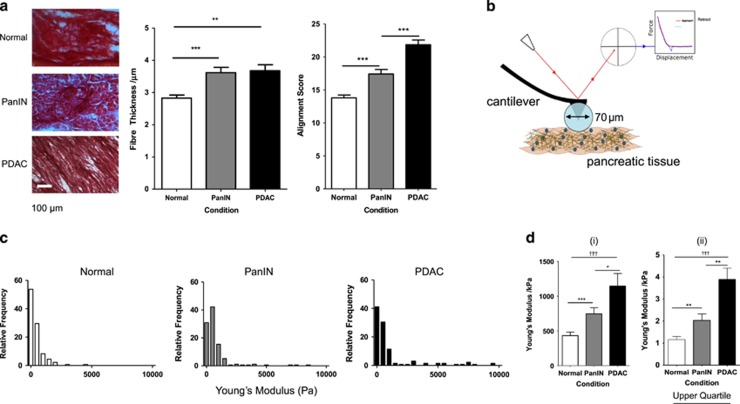
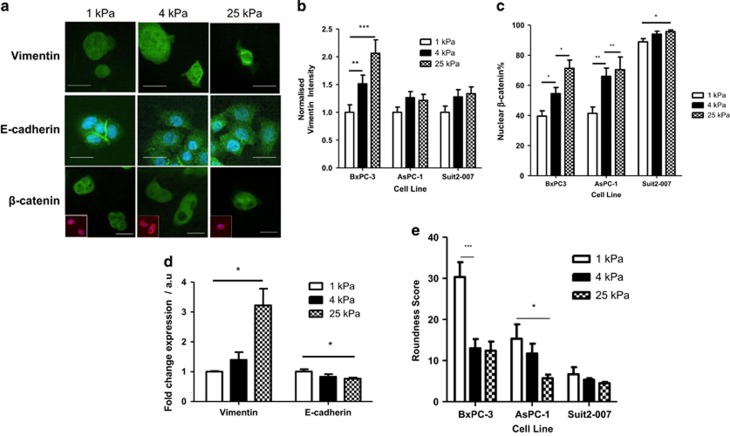
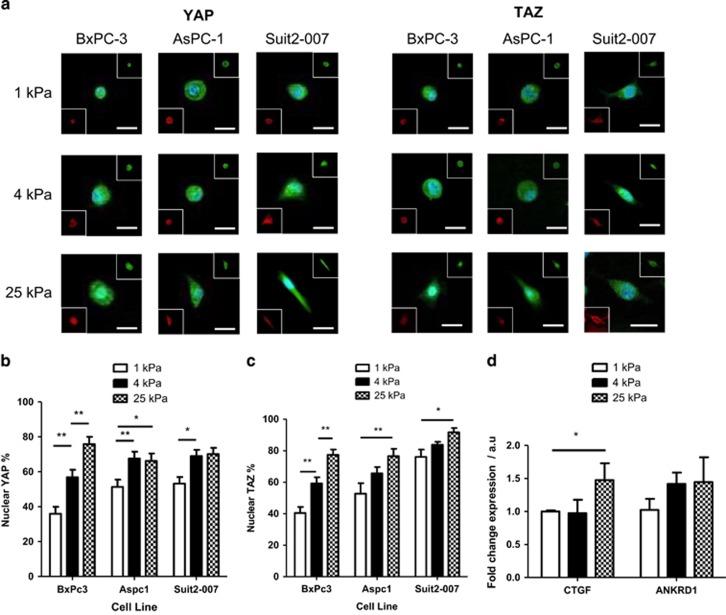
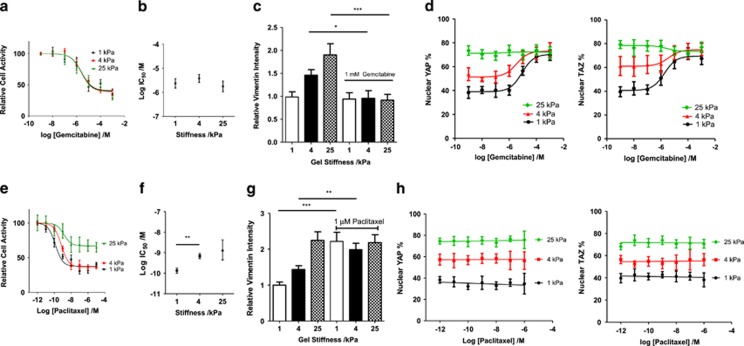
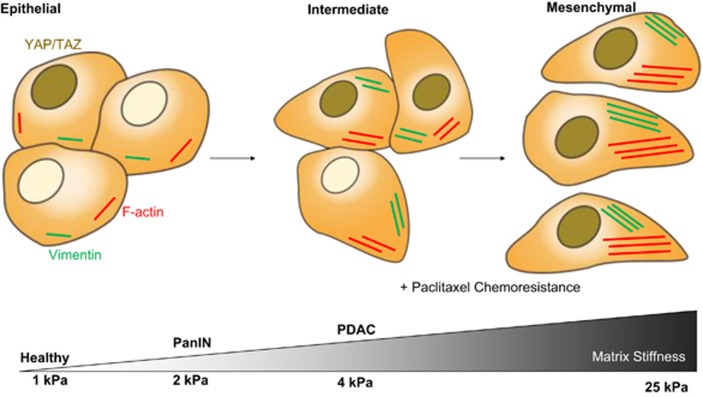
Increased matrix rigidity associated with the fibrotic reaction is documented to stimulate intracellular signalling pathways that promote cancer cell survival and tumour growth. Pancreatic cancer is one of the stiffest of all human solid carcinomas and is characterised by a remarkable desmoplastic reaction. Here we use mouse models, genetically engineered to recapitulate human pancreatic cancer, and several pancreatic cancer cell lines as a model to investigate the effect of matrix stiffness in epithelial-mesenchymal transition (EMT) and resistance to chemotherapeutics. We found that recapitulation of the fibrotic rigidities found in pancreatic cancer tissues promote elements of EMT, including increases in vimentin expression, decreases in E-cadherin expression, nuclear localisation of β-catenin, YAP and TAZ and changes in cell shape towards a mesenchymal phenotype. We also report that stiffness induces chemoresistance to paclitaxel, but not to gemcitabine, both commonly used therapeutics, suggesting that environmental rigidity underlies an aspect of chemoresistance.


Conflict of interest statement

The authors declare no conflict of interest.

Figures

Figure 1
Figure 1
In vivo characterisation of extracellular changes during PDAC progression. (a) Sirius Red staining of 10 μm-thick sections of mouse pancreatic tissue for normal pancreas, PanIN and PDAC. Fibre thickness is quantified through BoneJ analysis (normal, n=41; PanIN, n=48; PDAC, n=71) and alignment score through Radial Summation Alignment Analysis of 75 × 75 μm2 regions of interest (normal, n=65; PanIN, n=45; PDAC, n=52). Values represent mean±s.e.m. **P<0.01, ***P<0.0001. (b) Schematic diagram of AFM determination of Young’s modulus of pancreatic tissue. A laser reflected off a cantilever is deflected by deformation of a cantilever with a 70 μm glass bead attached. This produces a force curve that is fitted to the Hertz model for a Young’s modulus value. (c) Histograms showing the range of local Young’s modulus measurements across pancreatic tissue conditions: normal (n=132), PanIN (n=131), and PDAC (n=175). (d) Bar graph from histograms in panel (c), representing the whole data set (i) and the upper quartile (ii) data points from histograms in panel (c), representing the maximum rigidities present in the tissue. Normal, n=31; PanIN, n=33; PDAC, n=41. Values represent mean±s.e.m. *P<0.05, **P<0.001, ***P<0.0001 for unpaired Mann–Whitney test. †††P<0.0001 for Kruskal–Wallis test.
Figure 2
Figure 2
Role of matrix stiffness in EMT induction. (a) Vimentin, E-cadherin and β-catenin immunofluorescence images of BxPC-3 cells on matrices of varying stiffness. For β-catenin, main image shows merge of marker staining (green), top right inset is marker staining and bottom left inset is phalloidin staining (red) of actin cytoskeleton to show cell shape and DAPI (blue). Scale bar=25 μm. (b) Normalised vimentin intensity (corrected cell total fluorescence). For 1, 4 and 25 kPa, respectively, BxPC-3, n=33, 39, 31; AsPC-1, n=31, 35, 29; Suit2-007, n=41, 33, 45. Values represent mean±s.e.m. **P<0.01, ***P<0.0001. (c) Nuclear localisation percentage for β-catenin and YAP. For 1, 4 and 25 kPa, respectively, BxPC-3, n=13, 9, 13; AsPC-1, n 10, 11, 7; Suit2-007, n=11, 11, 12. Values represent mean±s.e.m. *P<0.05, **P<0.01. (d) Expression of EMT markers vimentin and E-cadherin at the mRNA level. Values represent mean±s.e.m. For an unpaired t-test, *P<0.05. N values for each protein at 1, 4 and 25 kPa, respectively, vimentin: 4, 6, 5; E-cadherin: 3, 6, 4. (e) Quantification of roundness for cells grown on matrices of varying rigidities. For 1, 4 and 25 kPa, respectively, BxPC-3, n=13, 15, 15; AsPC-1, n=19, 19, 15; Suit2-007, n=17, 13, 13. Values represent mean±s.e.m. *P<0.05, ***P<0.001.
Figure 3
Figure 3
Localisation of YAP/TAZ in response to matrix stiffness. (a) Changes in YAP and TAZ localisation to the nucleus in BxPC-3, AsPC-1 and Suit2-007 cell lines, as shown by immunofluorescence, with increasing matrix stiffness. For β-catenin, main image shows merge of marker staining (green) and DAPI (blue) and bottom left inset is a merge of phalloidin staining (red) of actin cytoskeleton to show cell shape and DAPI. Scale bar=25 μm. (b) Nuclear localisation percentage of YAP. For 1, 4 and 25 kPa, respectively, BxPC-3, n=22, 22, 16; AsPC-1, n=14, 14, 13; Suit2-007, n=12, 15, 18. (c) Nuclear localisation percentage of TAZ. For 1, 4 and 25 kPa, respectively, BxPC-3, n=19, 24, 20; AsPC-1, n=20, 19, 21; Suit2-007, n=13, 11, 10. Values represent mean±s.e.m. *P<0.05, **P<0.01. (d) Expression of YAP target genes CTGF and ANKRD1 at the mRNA level. Values represent mean±s.e.m. For an unpaired t-test, *P<0.05. N values for each protein at 1, 4 and 25 kPa, respectively; CTGF: 6, 6, 4; ANKRD1: 3, 5, 3.
Figure 4
Figure 4
The role of matrix stiffness in gemcitabine and paclitaxel chemoresistance. (a) Dose–response curve for BxPC-3 cell viability with increasing concentrations of gemcitabine. For 1, 4 and 25 kPa, respectively, total n=81, 74, 65. Values represent mean±s.e.m. (b) IC50 values from dose–response curves in panel (a). Values represent mean±s.e.m. (c) Normalised vimentin intensity (corrected cell total fluorescence). For 1, 4 and 25 kPa, respectively, for control conditions, n=23,20,20. For 1, 4 and 25 kPa, respectively, for 1 mM gemcitabine conditions, n=18, 13, 15. Values represent mean±s.e.m. *P<0.05, ***P<0.001. (d) Changes in population nuclear YAP percentage. For 1, 4 and 25 kPa, respectively, total n=76, 74, 78. Changes in population nuclear TAZ percentage. For 1, 4 and 25 kPa, respectively, total n=72, 76, 68. Values represent mean±s.e.m. (e) Dose–response curve for BxPC-3 cell viability with increasing concentrations of paclitaxel. For 1, 4 and 25 kPa, respectively, total n=58, 67, 54. Values represent mean±s.e.m. (f) IC50 values from dose–response curves in panel (e). Values represent mean±s.e.m. (g) Normalised vimentin intensity (corrected cell total fluorescence). For 1, 4 and 25 kPa, respectively, for control conditions, n=42, 39, 23. For 1, 4 and 25 kPa, respectively, for 1 mM gemcitabine conditions, n=32, 20, 30. Values represent mean±s.e.m. **P<0.01, ***P<0.001. (h) Changes in population nuclear YAP percentage. For 1, 4 and 25 kPa, respectively, total n=58, 56, 66. Changes in population nuclear TAZ percentage. For 1, 4 and 25 kPa, respectively, total n=77, 59, 65. Values represent mean±s.e.m.
Figure 5
Figure 5
Diagram of stiffness-induced progression of the EMT. The proposed role of stiffness in promoting progression through EMT in pancreatic cancer cells and its relevance to in vivo measurements of tissue stiffness with PDAC progression.

References

    1. Vincent A, Herman J, Schulick R, Hruban RH, Goggins M. Pancreatic cancer. Lancet 2011; 378: 607–620. - PMC - PubMed
    1. Hidalgo M, Cascinu S, Neoptolemos J, Real FX, Laethem J, Van, Heinemann V. Addressing the challenges of pancreatic cancer: future directions for improving outcomes. Pancreatology 2015; 15: 8–18. - PubMed
    1. Hezel AF, Kimmelman AC, Stanger BZ, Bardeesy N, Depinho RA. Genetics and biology of pancreatic ductal adenocarcinoma. Genes Dev 2006; 20: 1218–1249. - PubMed
    1. Erkan M, Hausmann S, Michalski CW, Fingerle AA, Dobritz M. The role of stroma in pancreatic cancer: diagnostic and therapeutic implications. Nat Rev Gastroenterol Hepatol 2012; 9: 454–467. - PubMed
    1. Whatcott CJ, Diep CH, Jiang P, Watanabe A, Lobello J, Sima C et al. Desmoplasia in primary tumors and metastatic lesions of pancreatic cancer. Clin Cancer Res 2015; 21: 3561–3568. - PMC - PubMed