. 2017 Sep;13(9):1045-1052.
doi: 10.1038/nchembio.2417. Epub 2017 Jun 26.

Monitoring thioredoxin redox with a genetically encoded red fluorescent biosensor

Affiliations

Monitoring thioredoxin redox with a genetically encoded red fluorescent biosensor

Yichong Fan et al. Nat Chem Biol. 2017 Sep.

Abstract

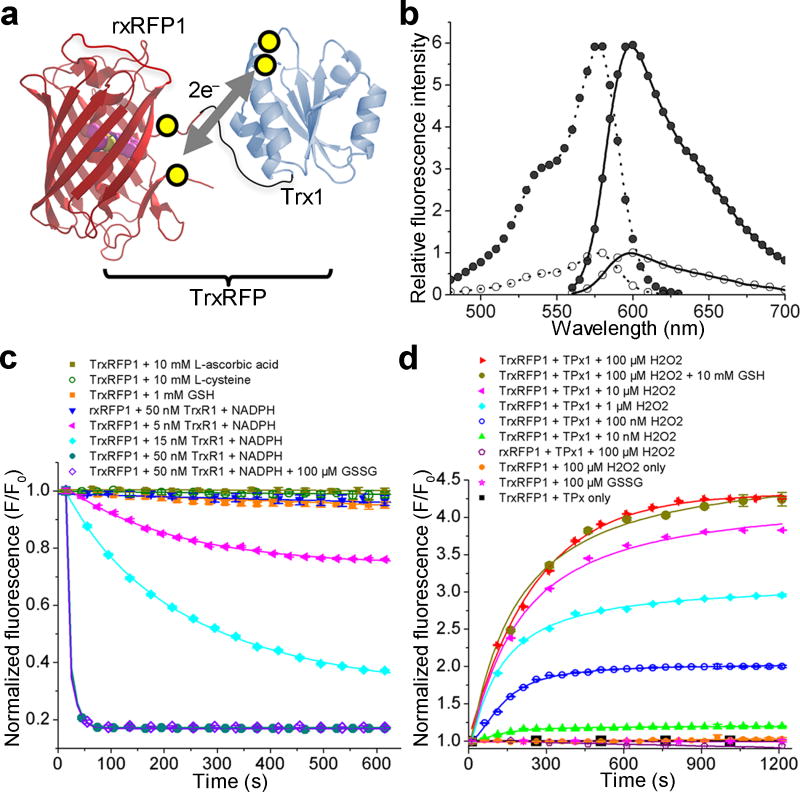
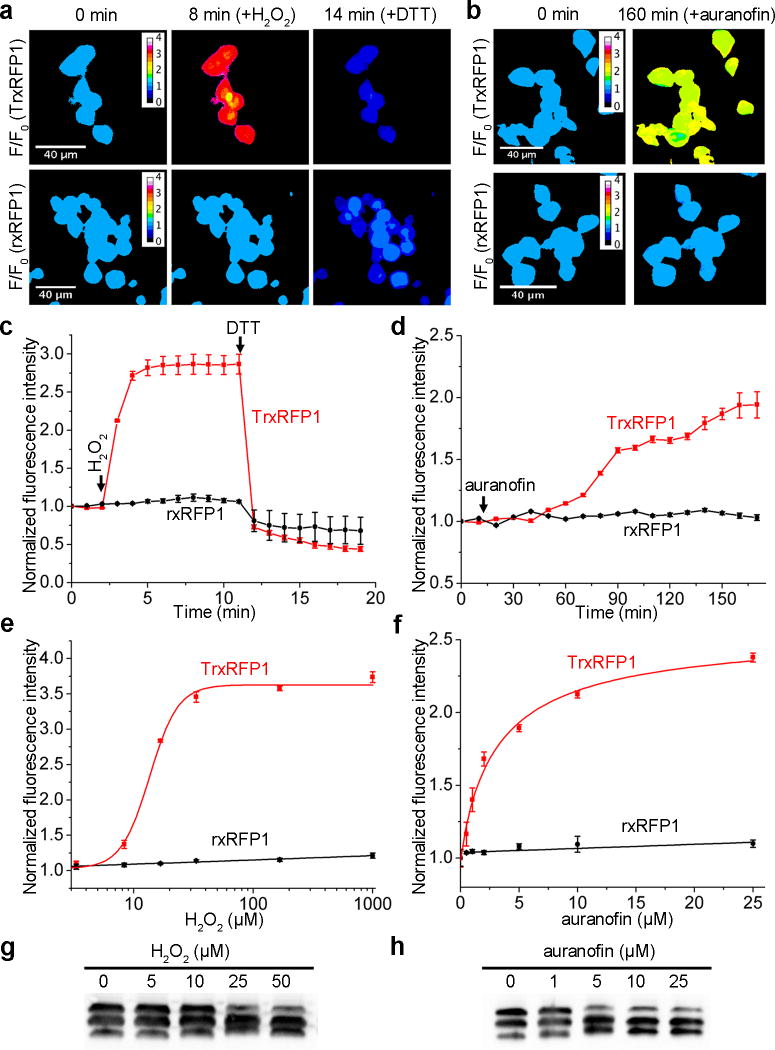
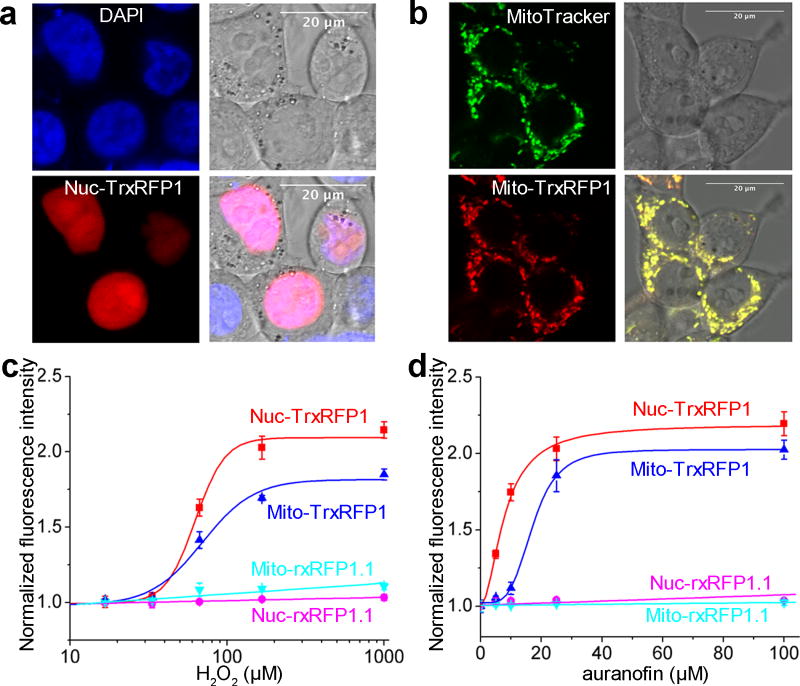
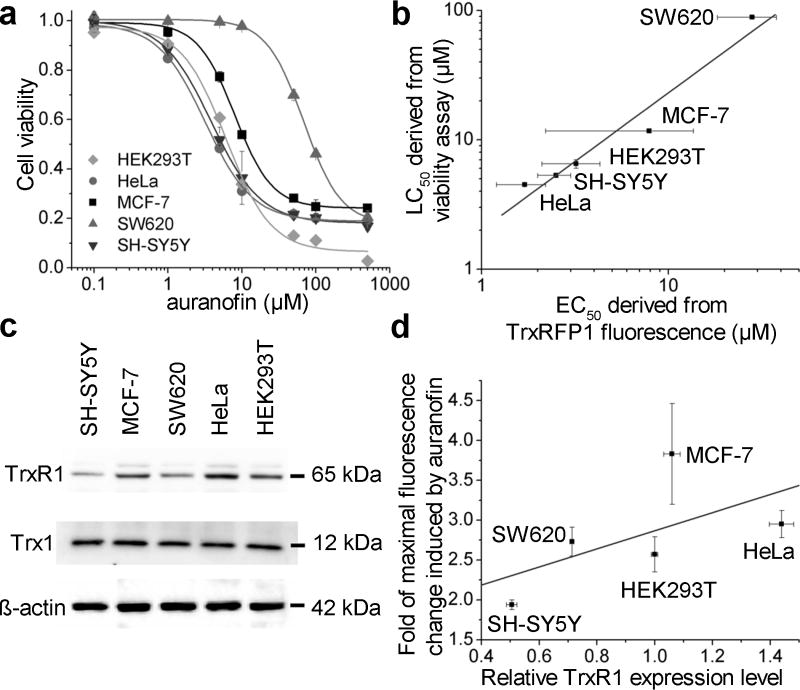
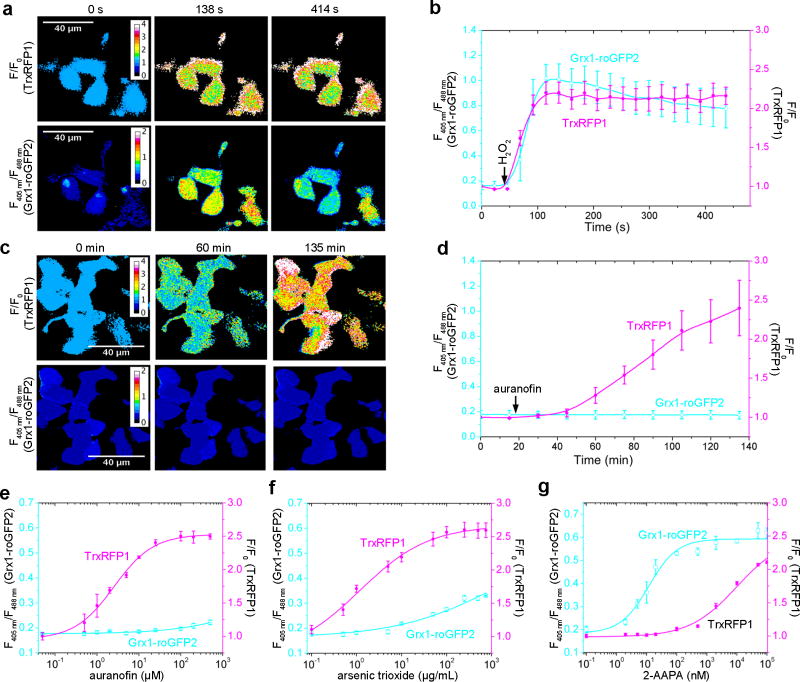
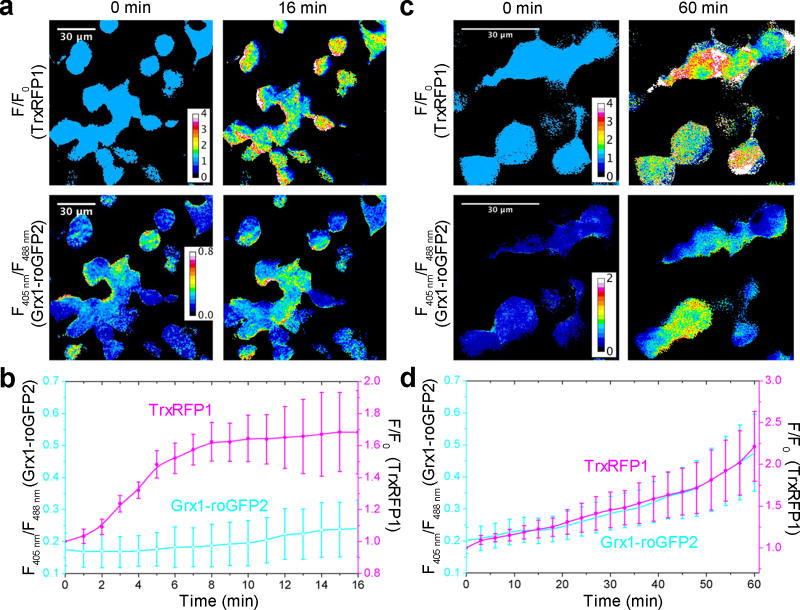
Thioredoxin (Trx) is one of the two major thiol antioxidants, playing essential roles in redox homeostasis and signaling. Despite its importance, there is a lack of methods for monitoring Trx redox dynamics in live cells, hindering a better understanding of physiological and pathological roles of the Trx redox system. In this work, we developed the first genetically encoded fluorescent biosensor for Trx redox by engineering a redox relay between the active-site cysteines of human Trx1 and rxRFP1, a redox-sensitive red fluorescent protein. We used the resultant biosensor-TrxRFP1-to selectively monitor perturbations of Trx redox in various mammalian cell lines. We subcellularly localized TrxRFP1 to image compartmentalized Trx redox changes. We further combined TrxRFP1 with a green fluorescent Grx1-roGFP2 biosensor to simultaneously monitor Trx and glutathione redox dynamics in live cells in response to chemical and physiologically relevant stimuli.


Conflict of interest statement

Competing financial interests

The authors declare no competing financial interests.

Figures

Figure 1
Figure 1. Design and fluorescence characterization of TrxRFP biosensors
(a) Schematic representation of the mechanism for TrxRFP sensors. The yellow circles indicate cysteine residues involved in the redox coupling. (b) Excitation (dotted line) and emission (solid line) spectra of reduced (open circle) and oxidized (filled circle) TrxRFP1. Spectra were normalized to the maximal fluorescence of the reduced form. (c) Kinetic traces for the reduction of oxidized proteins. (d) Kinetic traces for the oxidation of reduced proteins. TrxR1 used in these experiments was a commercial rat TrxR1 containing ~ 50% of the full-length selenocysteine (Sec)-containing enzyme.
Figure 2
Figure 2. Characterization of TrxRFP1 in HEK 293T cells
(a,b) Time-lapse pseudocolored fluorescence images (F/F0) of HEK 293T cells expressing either TrxRFP1 or rxRFP1 sequentially treated with 16.7 µM H2O2 and 10 mM DTT (a) or with 10 µM auranofin (b), showing H2O2- and auranofin- induced fluorescence changes of TrxRFP1 but not rxRFP1. H2O2 and auranofin were added at t = 2 min and t = 12 min, respectively (Scale bar = 40 µm). (c,d) Fluorescence intensity traces for TrxRFP1 or rxRFP1 in HEK 293T. The intensities were normalized to the value at t = 0 min and shown as the mean and s.d. of randomly selected eight cells from three independent replicates. The red and black lines are for TrxRFP1 and rxRFP1, respectively. The arrows indicate the time points for addition of chemicals. (e,f) Fluorescence responses of TrxRFP1 (red) or rxRFP1 (black) in HEK 293T to various concentrations of H2O2 (e) or auranofin (f), suggesting that TrxRFP1 can selectively sense the redox changes of Trx in live cells. Data are shown as mean and s.d. of three independent experiments. (g,h) Redox urea-PAGE and immunoblotting analysis of TrxRFP1 in HEK 293T cells treated with H2O2 (g) or auranofin (h) at the indicated concentrations, showing the increase of protein oxidation in response to the increase of H2O2 or auranofin (Full gel for 2g is in Supplementary Fig. 21d. The full gel for 2h is in Supplementary Fig. 21e). The three bands from top to bottom are interpreted as the TrxRFP1 protein containing no, one, and two disulfide bonds, respectively.
Figure 3
Figure 3. Subcellularly localized TrxRFP1
(a,b) Co-localization of nuclear (a) and mitochondrial (b) TrxRFP1 with a nuclear stain DAPI and a mitochondrial stain MitoTracker Green, respectively (Scale bar = 20 µm). (c,d) Fluorescence responses of nuclear (red) and mitochondrial (blue) TrxRFP1 in HEK 293T to various concentrations of H2O2 (c) or auranofin (d), suggesting that TrxRFP1 can selectively sense the subcellular redox changes of Trx in live cells. Fluorescence responses of nuclear (cyan) and mitochondrial (magenta) rxRFP1.1 are also shown as the controls. Data are represented as mean and s.d. of three independent experiments.
Figure 4
Figure 4. Use of TrxRFP1 in various mammalian cell lines
(a) The viabilities of indicated cell lines in response to 24-h auranofin treatment. (b) The correlation between EC50 values derived from TrxRFP1 fluorescence and LC50 values derived from viability assays of various cell lines (R2 = 0.95). (c) Western blots of endogenous TrxR1, Trx1 and β-actin in various cell lines (Full gel is in Supplementary Fig. 21a–c). (d) A plot for relative TrxR1 expression levels and the fold of fluorescence changes induced by auranofin across various cell lines (R2 = 0.35). Data in panel a are shown as mean and s.d. of three independent experiments. Error bars in panels b and d are s.e.m. from curve fitting or s.d. from quantification of Western blot bands of three independent replicates.
Figure 5
Figure 5. Simultaneous monitoring of thioredoxin and glutathione redox dynamics using TrxRFP1 and Grx1-roGFP2
(a, c) Time-lapse pseudocolored fluorescence images of HEK 293T cells expressing both TrxRFP1 and Grx1-roGFP2 treated with 13.3 µM H2O2 (a) or 15 µM auranofin (c), indicating that H2O2 induces changes in both thioredoxin and glutathione redox systems, whereas auranofin induces the oxidation of thioredoxin but not glutathione (Scale bar = 40 µm). In the top row are pseudocolored ratiometric images (F/F0) for TrxRFP1, and in the bottom row are pseudocolored ratiometric images (405 nm excitation/488 nm excitation) for Grx1-roGFP2. H2O2 and auranofin were added at t = 46 s and t =16 min, respectively. (b,d) Ratio traces for TrxRFP1 or and Grx1-roGFP2 in HEK 293T cells in panels a and c, shown as mean and s.d. of six individual cells from three independent replicates. The magenta and cyan lines are for TrxRFP1 and Grx1-roGFP2, respectively. The arrows indicate the time points for addition of H2O2 or auranofin. (e–g) Fluorescence responses of TrxRFP1 (red) and Grx1-roGFP2 in HEK 293T to various concentrations of auranofin (e), arsenic trioxide (f), or 2-AAPA (g), suggesting that the Trx redox system and the glutathione redox system can be individually perturbed. Data are shown as mean and s.d. of three independent experiments.
Figure 6
Figure 6. Responses of TrxRFP1 to physiological stimuli in HEK 293T cells
(a, b) Time-lapse responses of TrxRFP1 and Grx1-roGFP2 to serum stimulation at t = 0 min, indicating a robust oxidation of Trx (Scale bar = 30 µm). Prior to the 10% FBS treatment, cells were subjected to 6-h serum starvation. (c, d) Time-lapse responses of TrxRFP1 and Grx1-roGFP2 to epidermal growth factor (EGF, 500 ng/mL) treatment at t = 0 min, indicating the oxidation of both Trx and glutathione (Scale bar = 30 µm). Pseudocolored ratiometric images (F/F0) for TrxRFP1 and pseudocolored ratiometric images (405 nm excitation/488 nm excitation) for Grx1-roGFP2 are shown in panels a and c. Ratio traces for TrxRFP1 or and Grx1-roGFP2 are presented in panels b and d as mean and s.d. of eight individual cells from three independent replicates. The magenta and cyan lines are for TrxRFP1 and Grx1-roGFP2, respectively.

Similar articles

Cited by

References

    1. Lu J, Holmgren A. The thioredoxin antioxidant system. Free Radic. Biol. Med. 2014;66:75–87. - PubMed
    1. Sengupta R, Holmgren A. Thioredoxin and glutaredoxin-mediated redox regulation of ribonucleotide reductase. World J. Biol. Chem. 2014;5:68–74. - PMC - PubMed
    1. Matthews JR, Wakasugi N, Virelizier JL, Yodoi J, Hay RT. Thioredoxin regulates the DNA binding activity of NF-κB by reduction of a disulphide bond involving cysteine 62. Nucleic Acids Res. 1992;20:3821–30. - PMC - PubMed
    1. Wei SJ, et al. Thioredoxin nuclear translocation and interaction with redox factor-1 activates the activator protein-1 transcription factor in response to ionizing radiation. Cancer Res. 2000;60:6688–95. - PubMed
    1. Saitoh M, et al. Mammalian thioredoxin is a direct inhibitor of apoptosis signal-regulating kinase (ASK) 1. Embo J. 1998;17:2596–606. - PMC - PubMed