. 2017 Aug;49(8):1202-1210.
doi: 10.1038/ng.3911. Epub 2017 Jul 3.

Ancient selection for derived alleles at a GDF5 enhancer influencing human growth and osteoarthritis risk

Affiliations

Ancient selection for derived alleles at a GDF5 enhancer influencing human growth and osteoarthritis risk

Terence D Capellini et al. Nat Genet. 2017 Aug.

Abstract

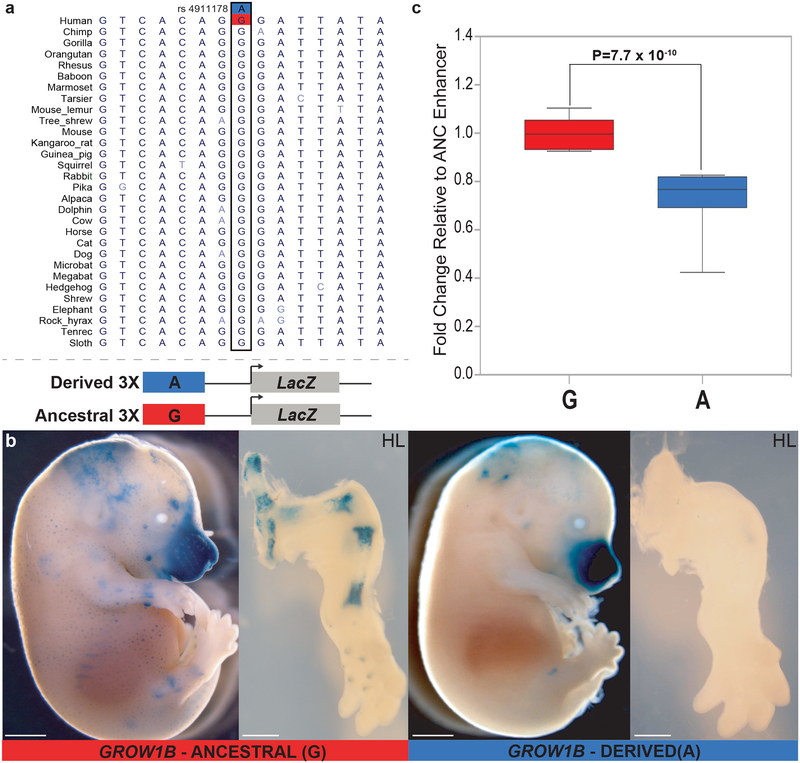
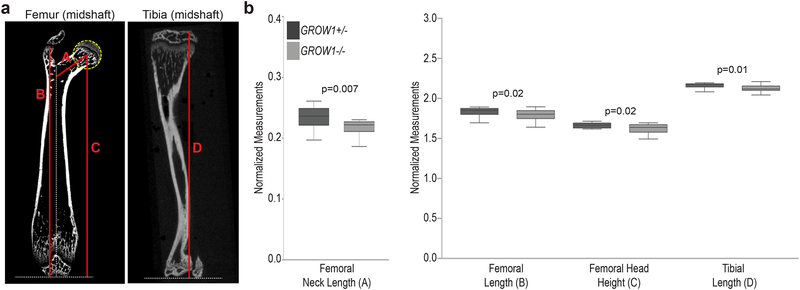
Variants in GDF5 are associated with human arthritis and decreased height, but the causal mutations are still unknown. We surveyed the Gdf5 locus for regulatory regions in transgenic mice and fine-mapped separate enhancers controlling expression in joints versus growing ends of long bones. A large downstream regulatory region contains a novel growth enhancer (GROW1), which is required for normal Gdf5 expression at ends of developing bones and for normal bone lengths in vivo. Human GROW1 contains a common base-pair change that decreases enhancer activity and colocalizes with peaks of positive selection in humans. The derived allele is rare in Africa but common in Eurasia and is found in Neandertals and Denisovans. Our results suggest that an ancient regulatory variant in GROW1 has been repeatedly selected in northern environments and that past selection on growth phenotypes explains the high frequency of a GDF5 haplotype that also increases arthritis susceptibility in many human populations.


Conflict of interest statement

COMPETING FINANCIAL INTERESTS STATEMENT

The authors declare no competing financial interests.

Figures

Figure 1.
Figure 1.. A regulatory scan of the Gdf5 region.
(a) (Top) Genomic positions of BAC constructs covering UPSTREAM (yellow) and DOWNSTREAM (green) sequences surrounding the mouse Gdf5 locus. Vertical blue lines denote position of lacZ cassette engineered in Gdf5 transcript. (a) (Bottom) The DOWNSTREAM BAC drives a broader lacZ expression pattern in long bones and joints compared to the UPSTREAM BAC, and uniquely controls lacZ expression in growth collars (GC) and broad expression domains in articular (*) surfaces of femur and tibia. Whole embryo panels shown at E15.5 (N=3 per line). Dissected long bones at E16.5 (ventral views). s (shoulder), e (elbow), w (wrist), h (hip), k (knee), a (ankle), d (digit) joints. Scale bars = 2 mm (embryo), 1 mm (bone). (b) Localization of the DOWNSTREAM BAC Gdf5 lacZ signal in the proximal femoral head (top) and proximal tibia (bottom) growth collars at E16.5. Gdf5 lacZ signal is detected in the chondrocyte cell collar, within and subjacent to perichondrial and adjacent tendons cells. Gdf5 lacZ signal is also detected in femoral head and proximal tibia articular cartilage. Scale bars = 200 um (sections).
Figure 2.
Figure 2.. DOWNSTREAM BAC rescues long bone and digit growth.
(a) Femoral length is shown as a black line in hindlimb cartoon with femur highlighted in gray. The shortened femur of Gdf5 mutant (bp/bp) mice is rescued to control (bp/+;BAC-) lengths by the presence of the DOWNSTREAM (green)(p = 6.839 × 10⁻⁹) but not UPSTREAM (yellow)(p = 0.152) Gdf5 BAC constructs (N=10 skeletal elements per genotype). (b) Digit length measurements indicated for Digit #3 (grey) and Metatarsal #3 (MT3) in hindpaw cartoon. When compared as a ratio to control (bp/+;BAC-) Digit3 or MT3 lengths, DOWNSTREAM BAC sequences fully restored bp/bp Digit3 lengths (p = 3.793 × 10⁻²⁰) and MT3 lengths (p = 8.339 × 10⁻²⁰) to control values, while UPSTREAM BAC sequences failed to rescue bp/bp Digit3 lengths (p = 0.102) and MT3 lengths to control levels, although MT3 lengths did significantly improve (p =2.327 × 10⁻⁵) (N=10 skeletal elements per genotype). The p-values reflect results obtained from unpaired, two-tailed t-tests between control bp/bp;BAC- and bp/bp;BAC+ samples; see Statistical Methods for further details on plots.
Figure 3.
Figure 3.. Fine mapping of a human GDF5 growth collar enhancer.
(a) Indicated regions from human (hg19) GDF5 were tested for ability to drive lacZ expression in developing forelimbs (FL), hindlimbs (HL), and femoral neck and heads. (b) Two fosmid clones, covering 37 kb (dark purple, far left) and 41 kb (light blue, far right) downstream sequence drive expression at E14.5 either in growth-plates or joint stripes, respectively (N=3 per fosmid line). The 37 kb growth collar lacZ pattern matches that driven by a 2.5 kb sequence (red; GROW1) at E15.5. GROW1 contains at least one smaller 980 bp sequence (yellow, GROW1B), capable of driving expression in growth plates (also see Supplementary Figs. 5 and 6). The 41 kb sequence drives strong expression in distal joints, e.g., knee (k), elbow (e), and digital joints (d) and contains three previously identified joint enhancers (gray; R3, R4, and R5). Scale bars = 1 mm (limbs). (c) When compared to the DOWNSTREAM BAC (green, left), the 37 kb growth region construct (purple) as well as the 2.5 kb (red) and 980 bp (yellow) constructs drive restricted patterns in the proximal femoral neck and shaft, whereas the 41 kb joint region construct (blue) drives expression confined to the femoral head (N > 5 per construct). An asterisk (*) indicates that the trochanter has not yet fully formed at E14.5. Scale bars = 500 um (proximal femora).
Figure 4.
Figure 4.. A functional variant in the human GDF5 growth plate enhancer.
(a) Position of rs4911178 within a 30 vertebrate Multiz alignment (UCSC browser, hg19). A common derived human variant “A” (blue) occurs at an otherwise highly conserved ancestral “G” (red) base in the GROW1B region. (b) In vivo lacZ reporter assay of ancestral “G” and derived “A” GROW1B enhancers (with constructs shown below dashed line in (a)) that differ only at the rs4911178 position. GROW1B with the derived “A” variant maintains facial expression but drives lower lacZ expression in long bone growth collars. Specifically, for the derived enhancer weak growth collar expression was observed in 2 of 11 independent transgenic embryos with facial expression, whereas for the ancestral enhancer growth collar expression was observed in 6 of 9 independent transgenic embryos with facial expression. Hindlimb view highlights the marked difference between both constructs. Scale bars = 2 mm (embryo), 1 mm (hindlimb). (c) In vitro analyses of GROW1B enhancer luciferase activity in Chon-002 cells. The derived “A” GROW1B variant (blue) drives significantly lower expression than the ancestral “G” GROW1B variant (red) (p =7.7 × 10⁻¹⁰). The p-values from independent experiments were combined across seven experiments using Fisher’s combined probability test. See Statistical Methods for further details on plots.
Figure 5.
Figure 5.. rs4911178 global allele frequencies and signatures of selection in the GROW1B region.
(a) The derived “A” (blue) allele at rs4911178 is present at high frequencies in many out-of-African populations compared to the ancestral “G” (red) allele (geographic distribution from Human Genome Diversity Project Selection Browser. (b) CMS selection score in JPT+CHB populations. The composite of multiple signals of positive selection is centered on the rs4911178/GROW1B region. See Methods for further details on plots.
Figure 6.
Figure 6.. Evolutionary history of the GDF5 locus in humans.
(a) Maximum Likelihood tree (left) and visual genotype (right) of phased 1000G, Neandertal, Denisovan, Chimpanzee haplotypes. (left) two clades (A & B) with strong bootstrap support exist, both containing haplotypes from Europe (black), Asia (orange), and Africa (green). Within Clade B, a high frequency haplotype B* occurs in Eurasian individuals. (right) Visual genotype across the 130 kb GDF5 regulatory locus. Clades A and B are partitioned based on the variant at rs4911178. Ancestral (red) or derived (blue) states are shown for SNPs across the interval. Thin line demarcates Clade A and B haplotypes; dashed line demarcates B and B*. Within Clade B, Neandertal and Denisovan haplotypes are most related to haplotypes only in Africa, and are ancestral to the “short height” B* haplotype found in Eurasians. (b) Three models of haplotype evolution at GDF5 locus. Blue X, shared mutations; black X, independent mutations. (c) Multiple GDF5 haplotypes were present in middle-to-late Pleistocene Africa, including haplotype B harboring the derived lower activity growth variant. Neandertal and Denisovan ancestors carried this or a related “shorter-height” haplotype into northern latitudes (dashed lines). During late Pleistocene, haplotypes (B*) related to (B) arose and were positively selected during more recent out-of-Africa migration(s). B* haplotype leads to decreased height via the derived rs4911178 variant in GROW1B (yellow). This variant travels with linked 5’UTR functional variants (e.g., rs143384) as well as variants within adjacent R2 (light purple) and downstream R3, R4, and R5 joint enhancers (light green).
Figure 7.
Figure 7.. GROW1 regulates long bone length in vivo.
(a) Morphometric measurements on P30 femur (left) and tibia (right) samples that underwent μCT (N=12 skeletal elements per genotype). Red lines indicate the following measurements: Femoral Neck Length (A), Femoral Length (B), Femoral Head Height (C), and Tibial Length (D). Yellow dashed circle outlines maximum diameter of the femoral head to specify its anatomical center; white dotted lines depict planes used to accurately measure length. See Methods. (b) Comparison of normalized measurements for GROW1−/− mutant and GROW1+/− (control) mice. Compared to GROW1+/− littermates (dark boxes), GROW1−/ mice (light gray boxes) have significantly shorter femoral neck lengths (p=0.007), femoral lengths (p=0.02), femoral head heights (p=0.02), and tibial lengths (p=0.01). The p-values reflect results obtained from unpaired, two-tailed t-tests. See Statistical Methods for further details on plots.

Similar articles

Cited by

References

    1. Hindorff LA et al. Potential etiologic and functional implications of genome-wide association loci for human diseases and traits. Proc Natl Acad Sci U S A 106, 9362–7 (2009). - PMC - PubMed
    1. Loughlin J Genetic contribution to osteoarthritis development: current state of evidence. Curr Opin Rheumatol 27, 284–8 (2015). - PMC - PubMed
    1. Miyamoto Y et al. A functional polymorphism in the 5’UTR of GDF5 is associated with susceptibility to osteoarthritis. Nat Genet 39, 529–33 (2007). - PubMed
    1. Zhang R et al. A comprehensive meta-analysis of association between genetic variants of GDF5 and osteoarthritis of the knee, hip and hand. Inflamm Res 64, 405–14 (2015). - PubMed
    1. Williams FM et al. GDF5 single-nucleotide polymorphism rs143383 is associated with lumbar disc degeneration in Northern European women. Arthritis Rheum 63, 708–12 (2011). - PMC - PubMed

METHODS-ONLY REFERENCES

    1. Iafrate AJ et al. Detection of large-scale variation in the human genome. Nat Genet 36, 949–51 (2004). - PubMed
    1. Settle SH et al. Multiple joint and skeletal patterning defects caused by single and double mutations in the mouse Gdf6 and Gdf5 genes. Dev Biol 254, 116–30 (2003). - PubMed
    1. Yang L, Mali P, Kim-Kiselak C & Church G CRISPR-Cas-mediated targeted genome editing in human cells. Methods Mol Biol 1114, 245–67 (2014). - PubMed
    1. McLeod MJ Differential staining of cartilage and bone in whole mouse fetuses by alcian blue and alizarin red. S. Teratology 22, 299–301 (1980). - PubMed
    1. Ward LD & Kellis M HaploReg v4: systematic mining of putative causal variants, cell types, regulators and target genes for human complex traits and disease. Nucleic Acids Res 44, D877–81 (2016). - PMC - PubMed

Substances