. 2017 Aug;49(8):1239-1250.
doi: 10.1038/ng.3906. Epub 2017 Jul 3.

The methyltransferase SETDB1 regulates a large neuron-specific topological chromatin domain

Affiliations

The methyltransferase SETDB1 regulates a large neuron-specific topological chromatin domain

Yan Jiang et al. Nat Genet. 2017 Aug.

Abstract

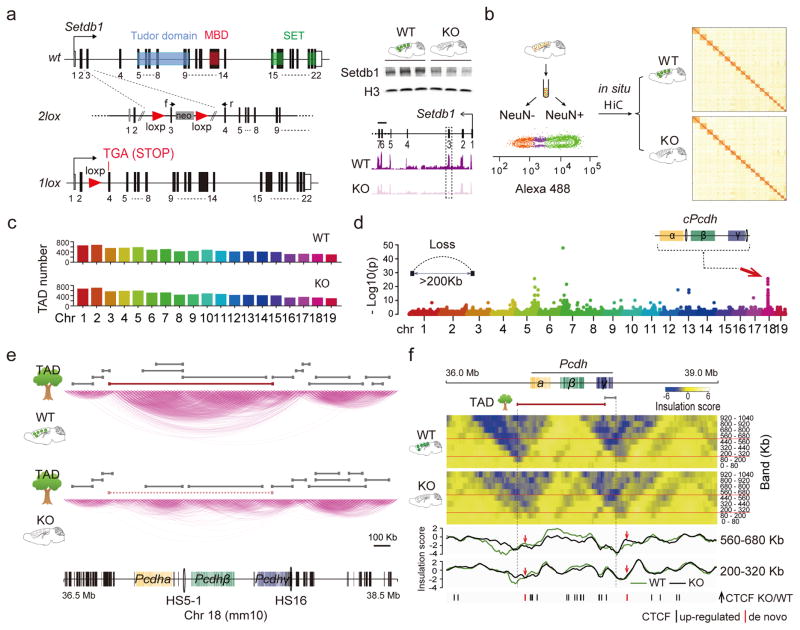
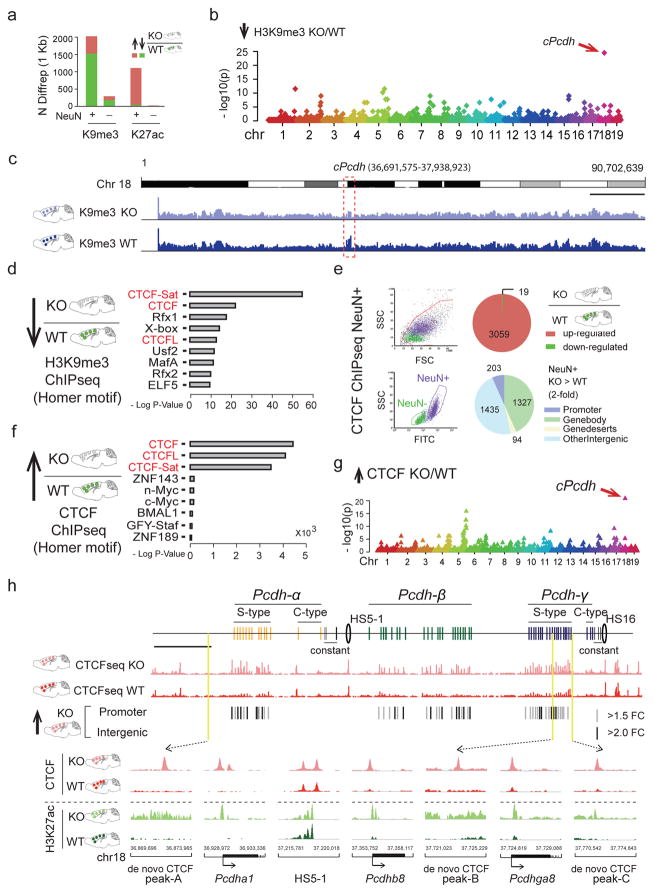
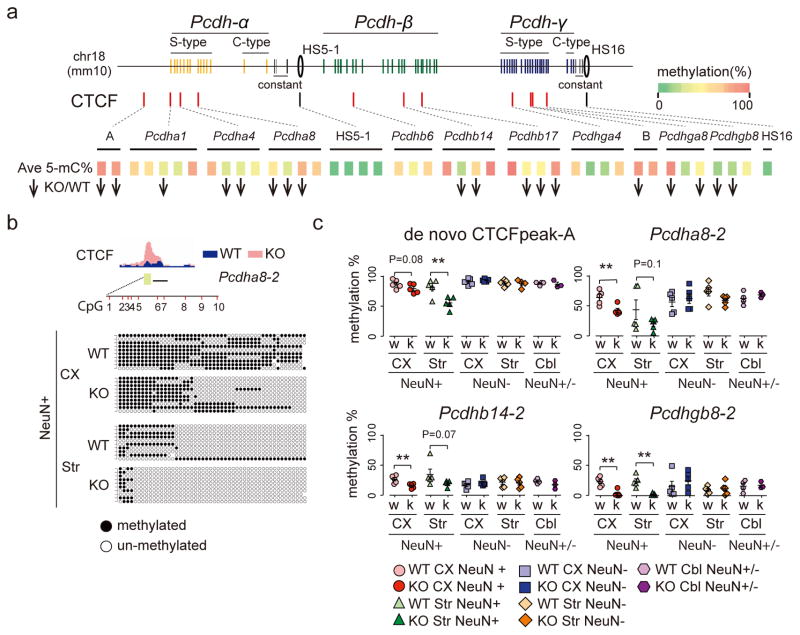
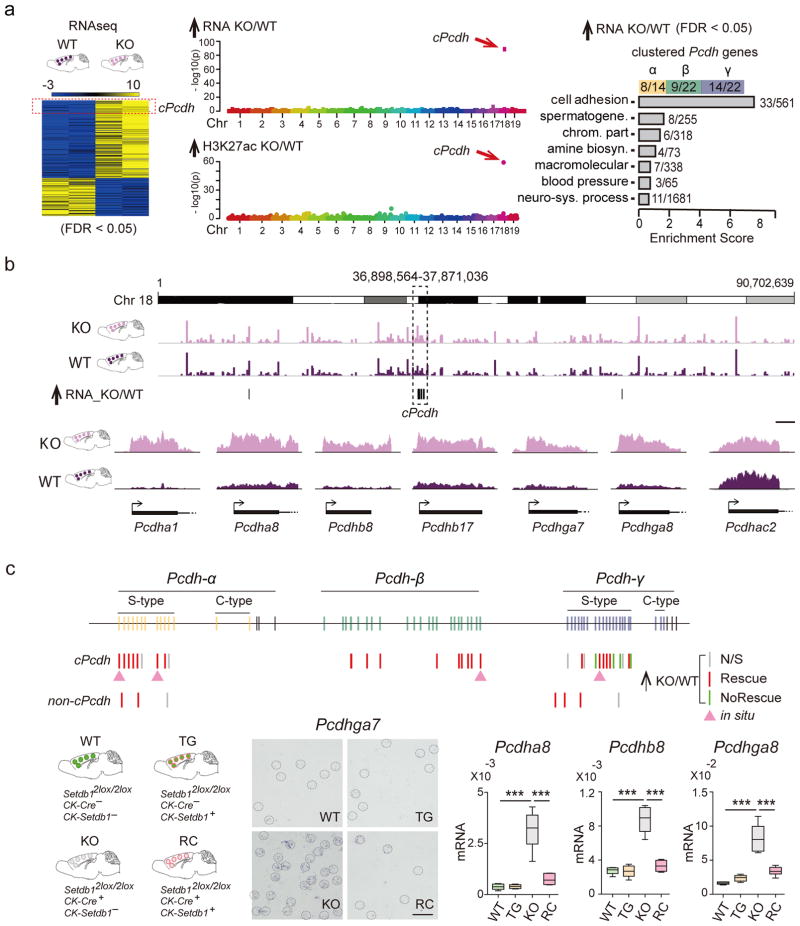
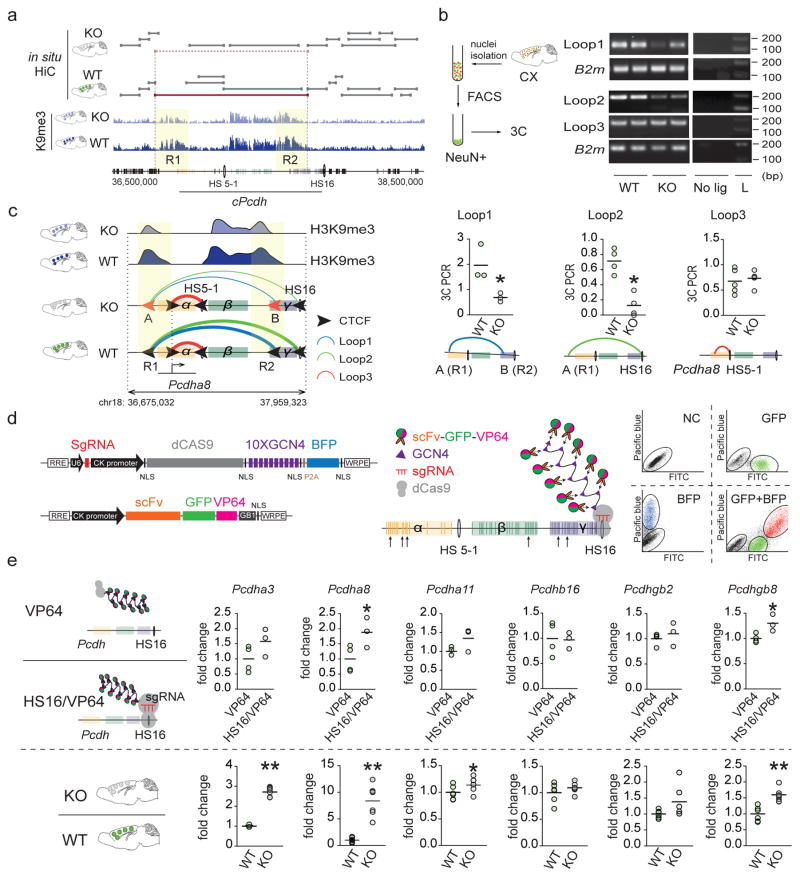
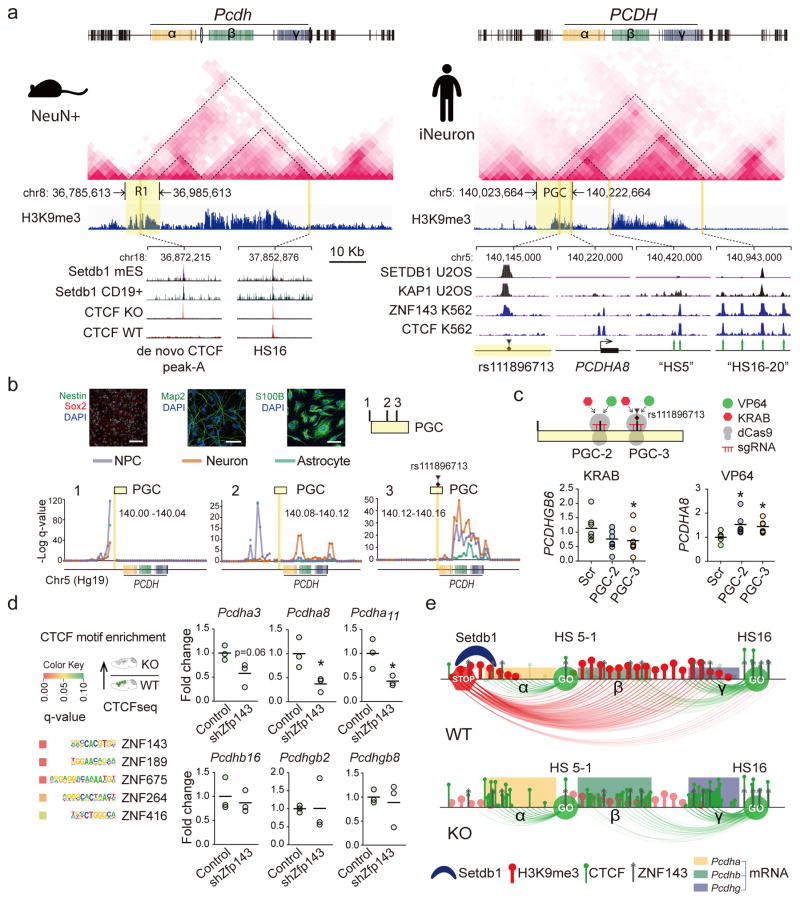
We report locus-specific disintegration of megabase-scale chromosomal conformations in brain after neuronal ablation of Setdb1 (also known as Kmt1e; encodes a histone H3 lysine 9 methyltransferase), including a large topologically associated 1.2-Mb domain conserved in humans and mice that encompasses >70 genes at the clustered protocadherin locus (hereafter referred to as cPcdh). The cPcdh topologically associated domain (TADcPcdh) in neurons from mutant mice showed abnormal accumulation of the transcriptional regulator and three-dimensional (3D) genome organizer CTCF at cryptic binding sites, in conjunction with DNA cytosine hypomethylation, histone hyperacetylation and upregulated expression. Genes encoding stochastically expressed protocadherins were transcribed by increased numbers of cortical neurons, indicating relaxation of single-cell constraint. SETDB1-dependent loop formations bypassed 0.2-1 Mb of linear genome and radiated from the TADcPcdh fringes toward cis-regulatory sequences within the cPcdh locus, counterbalanced shorter-range facilitative promoter-enhancer contacts and carried loop-bound polymorphisms that were associated with genetic risk for schizophrenia. We show that the SETDB1 repressor complex, which involves multiple KRAB zinc finger proteins, shields neuronal genomes from excess CTCF binding and is critically required for structural maintenance of TADcPcdh.


Conflict of interest statement

Competing Financial Interest: The Authors declare no conflicts of interest.

Figures

Figure 1
Figure 1. 3D genomes in Setdb1-deficient cortical neurons
(a) (Left) Conditional Setdb1 ablation with loxP sites surrounding exon 3. Recombination results in frame shift and premature stop (TGA) upstream of Tudor, methyl-CpG-binding (MBD) and catalytic SET domains. (Right) Setdb1 immunoblot (histone H3 loading control) (complete blot shown in Supplementary Figure 1c) and RNA-seq from adult CK-Cre+ Setdb12lox/2lox mutant (K), in comparison to CK-CreSetdb12lox/2lox (WT) cortex. (b) (Left) Flow cytometry-based sorting of adult cortex NeuN immunotagged nuclei. (Right) genome-scale in situ Hi-C contact matrix from WT and KO NeuN+ nuclei. (c) TAD numbers per autosome for mutant (KO) and wildtype (WT) NeuN+, (N=2/genotype). (d) Manhattan plot summarizing loss of long-range DNA loop contacts bypassing >200kb linear genome in KO compared to WT NeuN+. Notice localized aggregates of densely spaced loop losses on chromosomes 5, 7 and 18. (e) in situ HiC 2Mb window showing chromosome 18 conformations in KO and WT at position marked by red arrow in Manhattan blot in panel D, with TADs called (TADtree) in both genotypes marked gray. Large ‘superTAD’ called in WT but lost in KO shown as red line. (f) Contact insulation map for 3Mb window centered on cPcdh locus. (Top) Heatmaps from WT and KO cortical neurons for 9 bands, from 0–80kb to 920–1040kb distance. KO shows loss of superTADcPcdh insulation. (Bottom) Two representative insulation bands reveal Setb1-sensitive insulation zones in KO neurons aligned with excess CTCF peaks, as indicated.
Figure 2
Figure 2. Histone modification and CTCF landscapes in Setdb1-deficient neuronal nuclei
(a) DiffRep counts (1kbsw) for H3K9me3 methylation and H3K27ac acetylation (ChIP-seq) from KO compared to WT adult cortex, for NeuN+ and NeuN. H3K9me3 >1.5-fold; H3K27ac >2-fold; FDR P<0.05. (b) Manhattan plot with linear representation of autosomes, showing localized enrichments (1MBsw) for H3K9me3 hypomethylation in KO. Top-scoring chromosome 18 cPcdh locus corresponds to site affected by loss of long-range loop bundles (Figure 1d). (c) Mouse total chromosome 18 (mm10; merged fastQ N=3 animals) H3K9me3 landscape for NeuN+ KO and WT, with ~1.2 Mb (chr18:36,691,575-37,938,923) cPcdh locus flagged. Scale bar, 10 Mb. (d) CTCF motif (red) enrichment in sequences H3K9me3 hypomethylated in KO. (e) (Left) FACS plots showing separation of crosslinked NeuN+ from NeuN nuclei (adult cortex) for cell-type specific CTCF ChIP-seq. (Right) Mutant NeuN+ showed 3059 CTCF up- and only 19 CTCF down-regulated sequences, affecting primarily inter- and intragenic DNA (>2-fold KO/WT NeuN+ nuclei, N=4 animals/group, FDR P <0.05. (f) Dramatic CTCF motif (red) enrichment among the 3059 CTCF-up sequences. (g) Autosomal genome Manhattan plot showing localized clustering of CTCF up sequences in KO neurons, with cPcdh as top ranking locus (1Mbsw). (H) (Top) cPcdh CTCF landscapes in KO and WT NeuN+ as indicated. Significantly up-regulated (KO>WT) promoter-bound and intergenic CTCF sequences marked separately. Scale bar, 100 kb. (Bottom) Coordinate increase of (red) CTCF and (green) H3K27ac at selected cPcdh promoters and intergenic DNA in KO neurons. In contrast, robust peaks at baseline, independent of genotype, at DNaseI hypersensitive HS5-1(HS5-1a+HS5-1b).
Figure 3
Figure 3. DNA methylation profiling at the cPcdh locus
(a) (Top) red tick marks for 11 cPcdh promoters and 2 intergenic sequences (A,B) with excess/de novo CTCF occupancy in KO neurons; black tick marks for HS5-1 and HS16 with robust CTCF peaks in both KO and WT (see also Figure 2h). (Bottom) Averaged 5mC DNA methylation levels (green-red=0–100%) of 43 amplicons representing the set of 13 regulatory sequences show in Top panel. Bis-seq data were averaged across 47 DNA samples from cortical and striatal NeuN+ and NeuN, and cerebellar homogenate. Downward arrows: 18/43 bis-seq amplicons show mC5 deficit in Setb1-deficient neurons. 0/43 show increase (P<0.5–0.1/amplicon) (see Supplementary Table 13 for details on quantification). (b) Representative bis-seq example from Pcdha8 amplicon no.2 capturing 10 CpG sites. Score cards from 50 randomly selected DNA molecules: circles black/white methylated/not methylated. (c) Quantification of bis-seq amplicons expressed as %methylated. *,**P<0.05(0.01) unpaired one-tailed t-test. Each symbol represents 1 sample from 1 animal. Note methylation deficits specifically for cortical (CX) and striatal (Str) NeuN+ from Setdb1-deficient (k) neurons, compared to wildtype (w).
Figure 4
Figure 4. Transcriptional dysregulation at the cPcdh locus
(a) (Left) genome-wide RNAseq heatmap, blue-yellow range show average levels of expression (log 2), for transcripts with significant (FDR P<0.05) difference in expression of KO compared to WT PFC. (Right) Gene Ontology of differentially expressed genes (FDR P<0.05) highlight Setdb1-dependent regulation of cPcdh cell adhesion genes. (Middle) Manhattan plots for autosomal genome (mouse chromosomes 1–19), showing singular enrichment (1MBsw) for (Top) upregulated transcripts and (Bottom) histone hyperacetylated chromatin at chromosome 18 cPcdh locus, as indicated. (b) (Top) Whole chromosome 18 view on cortex RNA-seq, merged FastQ N=2KO (light purple) and N=2WT (dark purple). (Bottom) representative RNAseq tracks for first exon of specific Pcdhα, Pcdhβ, and Pcdhγ genes. Scale bar, 500bp. Notice increased expression primarily from non-C type Pcdh genes with stochastic expression pattern (S-type), while C-type Pcdh genes remain unaffected. (c) Top: Pcdh and non-Pcdh transcripts tested in adult cortex from mutant and transgenic rescue mice and their respective controls by qRT-PCR and in situ hybridization as indicated. Bottom: Transgenic rescue for representative S-type Pcdh, shown by ISH from middle layers of lateral cerebral cortex (scale bar, 50 μm). Box plots (1st/3rd quartile, median, whiskersmin,max) summarizing qRT-PCR in PFC of WT, TG (CK-Setdb1+ transgenic line), KO and RC (CK-Setdb1+ transgenic rescue of conditional CK-Cre+, Setdb12flox/2lox mutants). N=6/group, ***P<0.001. Pcdha8, t (WT/KO) = 9.59, t (KO/RC)=8.33; Pcdhb8, t (WT/KO)=11.07, t (KO/RC)=10.03; Pcdhga8, t (WT/KO)=10.07, t (KO/RC)=7.39. One-way ANOVA, Bonferroni corrected. Additional ISH gene expression data are shown in Supplementary Figures 12–15.
Figure 5
Figure 5. Epigenomic editing at the cPcdh locus
(a) cPcdh locus and surrounding sequences ~2Mb of mouse chr. 18, including TADs called (TADtree) and H3K9me3 tracks for KO and WT. Notice ‘shrinkage’ of broadly (>100–200kb) stretched ‘R1’ and ‘R2’ blocks of H3K9me3-tagged chromatin in KO neurons. (b) Overview on cell-type specific 3C-PCR, cropped agarose gels showing specific loop products for cPcdh and B2m control. No lig=3C without DNA ligase, L=100bp DNA ladder. Dot graphs summarizing 3C-PCR (mean±S.E.M.; 1dot=1animal) cPcdh loop1,2,3 as indicated. All data normalized to B2m 3C, N(Loop1)=3/group, *P(Loop1)=0.05, Mann Whitney, one-tailed; N(Loop2)=4/group, *P(Loop2)=0.014,Mann Whitney, two-tailed. Loop defects in KO include A/R1(de novo CTCF peak A in R1)-HS16 and A/R1-B/R2 (de novo CTCF peak B in R2). In contrast, shorter-range Pcdha8 promoter-HS5 enhancer loop is maintained in KO neurons. Complete gels shown in Supplementary Figure 16c. (c) Summary presentation of 3C-PCR. (d) dCas9-SunTag superactivation of HS16 cPcdh enhancer with U6-sgRNA cassette upstream of CK-dCas9-10xGCN4epitope-BFP cassette, and CK-svFv-sGFP-VP64 cassette on separate vector. Representative FACS sort shows dually labeled BFP+GFP+ NG108 cells. NC=negative control (e) RT-PCR quantification (mean±S.E.M.; 1dot=1cell culture or animal) of Pcdha3, Pcdha8, Pcdhb16, Pcdhgb2 and Pcdhgb8 transcripts (black arrows in panel d mark genomic positions), normalized to Gapdh RNA. (Top) BFP+GFP+ NG108 cells with (HS16/VP64) and without (VP64) sgRNAHS16 cassette. (Bottom) adult KO and WT PFC. N=4 VP64/3 hs16/vp64 (NG108 cells), *P(Pcdha8)=0.0268, *P(Pcdha11)=0.0437, *P(Pcdhgb8)=0.0126, unpaired t test, one-tailed; N=6/group (mice), **P(Pcdha3)=0.002, **P(Pcdha8)=0.002, *P(Pcdha11)=0.026, **P(Pcdhgb8)=0.0022, Mann Whitney, two-tailed. See also Supplementary Figure 16A for additional 3C-PCR loop quantifications.
Figure 6
Figure 6. Regulatory mechanisms at human and mouse TADcPCDH
(a) (Top) Neuronal in situ Hi-C interaction matrices, and H3K9me3 landscapes, for ~2Mb of mouse and human cPCDH, including superTAD spanning across α,β,γ clusters. (Bottom left) Setdb1 peaks in mouse embryonic stem cell and lymphocytes match to de novo CTCF peak in Setdb1 KO neurons. (Bottom right) ‘PGC’, Psychiatric Genomics Consortium risk haplotype chr5:140,023,664-140,222,664 with lead polymorphism rs111896713 matching to Setdb1, KAP1 and ZNF143 peaks. Note epigenomic similarities of ‘R1’ (mouse) and ‘PGC’ (human). (b) Neural progenitor cell (NPC) differentiation into neurons and astrocytes, with phenotypic markers as indicated. Scale bar, NPC (neuron/astrocyte) 100 (50) μm. Conformations for three representative 40kb bins from 200kb ‘PGC’ haplotype, with bin harboring the index polymorphism (‘PGC-3’) showing dramatically increased cPCDH contact. (c) Dot graphs show cPCDH gene expression in epigenomically edited NPC, with PCDHGB6 (but not PCDHGA8) transcript decreased by sgRNA-guided dCas9-KRAB in 3/3 experiments. dCas9-VP64 elicits increased expression of a subset of Protocadherin transcripts. Scr, scrambled control. All data normalized to 18srRNA, shown as fold change. N=6–9/group, P < 0.05, Mann Whitney, two-tailed. (d) ZNF-specific motif enrichments in CTCF-up sequences. Dot graphs (1dot/cell culture) summarize expression of specific Pcdhα, β and γ genes after shRNA-induced Zfp143 knock-down in NG108 neuroblastoma cells. Unpaired t test, two-tailed, N=3 per treatment. *P<0.05 (e) Schematic summary of TADcPcdh epigenomic architectures in WT and KO neurons. Loss of repressive long-range contacts in KO shifts the balance towards facilitative shorter range promoter-enhancer loopings.

References

    1. Rao SS, et al. A 3D map of the human genome at kilobase resolution reveals principles of chromatin looping. Cell. 2014;159:1665–1680. - PMC - PubMed
    1. Dekker J, Marti-Renom MA, Mirny LA. Exploring the three-dimensional organization of genomes: interpreting chromatin interaction data. Nat Rev Genet. 2013;14:390–403. - PMC - PubMed
    1. Merkenschlager M, Nora EP. CTCF and Cohesin in Genome Folding and Transcriptional Gene Regulation. Annu Rev Genomics Hum Genet. 2016;17:17–43. - PubMed
    1. Cubenas-Potts C, Corces VG. Topologically Associating Domains: An invariant framework or a dynamic scaffold? Nucleus. 2015;6:430–434. - PMC - PubMed
    1. Shen Y, et al. A map of the cis-regulatory sequences in the mouse genome. Nature. 2012;488:116–120. - PMC - PubMed