. 2017 Aug;49(8):1211-1218.
doi: 10.1038/ng.3909. Epub 2017 Jul 3.

The genomic landscape of pediatric and young adult T-lineage acute lymphoblastic leukemia

Affiliations

The genomic landscape of pediatric and young adult T-lineage acute lymphoblastic leukemia

Yu Liu et al. Nat Genet. 2017 Aug.

Abstract

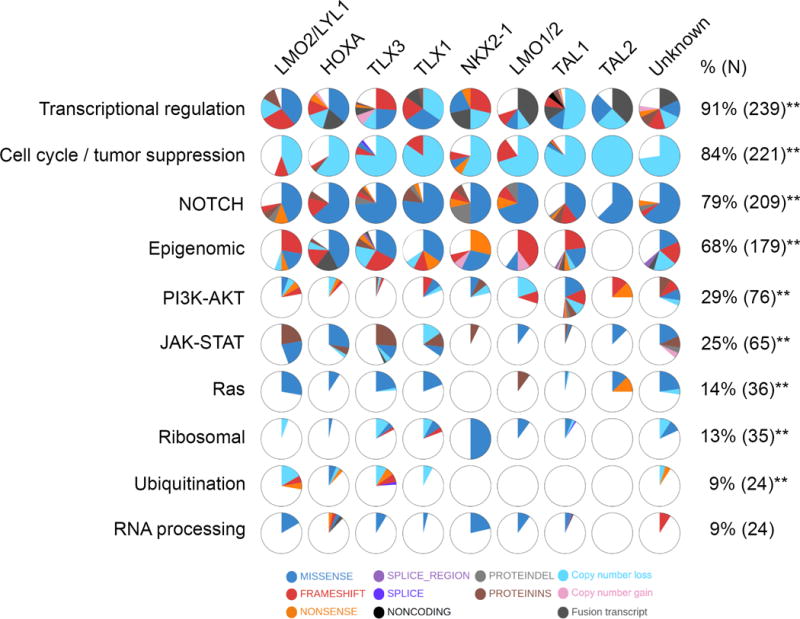
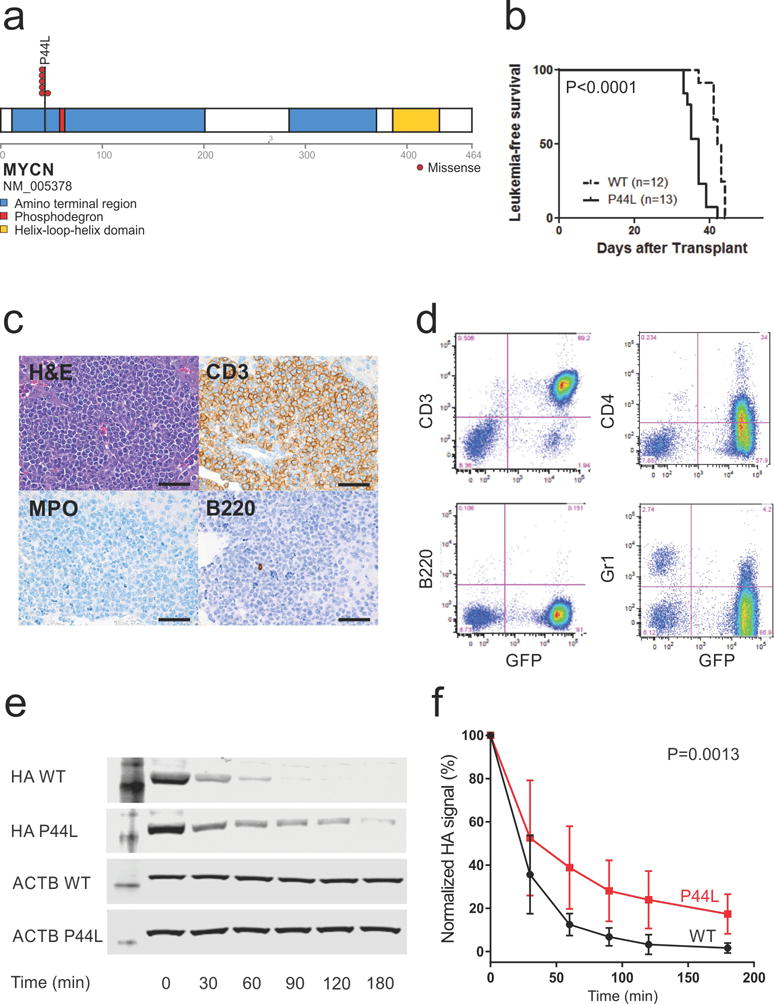
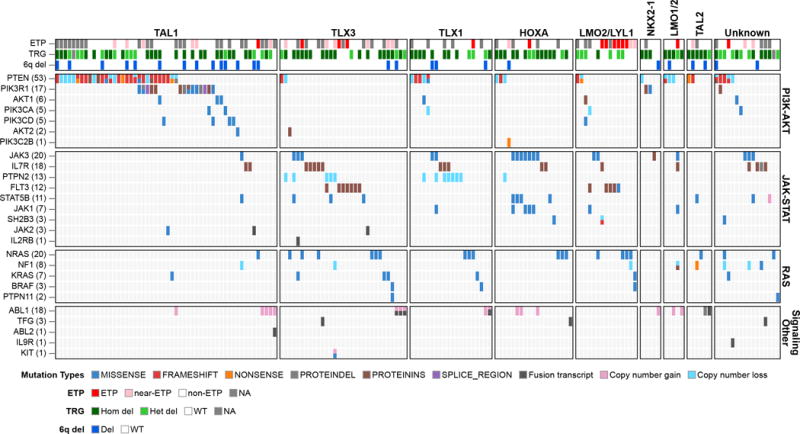
Genetic alterations that activate NOTCH1 signaling and T cell transcription factors, coupled with inactivation of the INK4/ARF tumor suppressors, are hallmarks of T-lineage acute lymphoblastic leukemia (T-ALL), but detailed genome-wide sequencing of large T-ALL cohorts has not been carried out. Using integrated genomic analysis of 264 T-ALL cases, we identified 106 putative driver genes, half of which had not previously been described in childhood T-ALL (for example, CCND3, CTCF, MYB, SMARCA4, ZFP36L2 and MYCN). We describe new mechanisms of coding and noncoding alteration and identify ten recurrently altered pathways, with associations between mutated genes and pathways, and stage or subtype of T-ALL. For example, NRAS/FLT3 mutations were associated with immature T-ALL, JAK3/STAT5B mutations in HOXA1 deregulated ALL, PTPN2 mutations in TLX1 deregulated T-ALL, and PIK3R1/PTEN mutations in TAL1 deregulated ALL, which suggests that different signaling pathways have distinct roles according to maturational stage. This genomic landscape provides a logical framework for the development of faithful genetic models and new therapeutic approaches.


Conflict of interest statement

COMPETING FINANCIAL INTERESTS

The authors declare no competing financial interests.

Figures

Figure 1
Figure 1. The fifty-five most common targets of sequence mutation in T-ALL
The left panel shows genes with mutations ordered by recurrence, and stratified by mutation type. Gene symbols in blue denote those previously found to be mutated in adult T-ALL cases, but not children. Those in red have not previously been reported in T-ALL. Genes on chromosome X are indicated with asterisks. The center panel depicts the number of mutations for each gene per case. The right panel indicates mutant allele fraction (MAF) of sequence mutation across the cohort.
Figure 2
Figure 2. Recurrently mutated pathways in T-ALL
Ten recurrently mutated pathways and the proportion of cases in each T-ALL subgroup shown as pie diagrams. The majority of pathways showed significant associations between prevalence of alteration and T-ALL subgroup, **, P<0.01.
Figure 3
Figure 3. A network depicting association between genetic alterations and T-ALL subgroups and stages of T-cell development
Nodes represent genetic alterations and are color-coded by the T-ALL subtype in which they are most enriched. The size of each node represents the frequency of the genetic alteration across the entire cohort. Lines connecting the nodes indicate statistically significant co-occurrence of a gene-gene pair or a gene-subtype pair. Intra- and inter- subtype co-occurrence is shown in red and blue, respectively with the thickness of each line represents the significance of P value. Nodes in gray are genetic alterations that are not specifically enriched in a T-ALL subtype.
Figure 4
Figure 4. Accelerated leukemogenesis in mutant MYCN driven T-ALL
a, MYCN mutations in T-ALL. The putative MYCN phosphodegron is showin in red. b, Kaplan-Meier curves from 1 of two experiments showing leukemia-free survival of mice transplanted with thymocytes transduced with the wild-type P44L MYCN vectors, N=10 per arm. c, Leukemic infiltrates were present in the liver (shown), kidney, spleen, thymus, and bone marrow of all animals. Tumors were of T cell lineage (CD3+, RUNX1+, MPO−, GATA1−, TdT−). Bars, 75μm. d, Expression of CD3, CD4, B220 and Gr1 in leukemic cells. e–f. Immunoblot analysis of MYCN expression (via the HA epitope tag) in NIH3T3 cells showing increased stability following cycloheximide treatment for MYCN P44L. The estimated half-life for wild-type MYCN was 0.47 hours (95% CI −.38–0.6) compared to 0.96 hours (0.77–1.27) for MYCN P44L (P=0.0013). Two independent cycloheximide treatment experiments were performed, with one representative experiment shown in e and data in f showing mean ± SD. Immunoblots in e have been cropped.
Figure 5
Figure 5. Signaling mutations in T-ALL
Heatmap showing the enrichment of PI3K mutations in TAL1-deregulated ALL cases, and the enrichment of JAK-STAT and Ras mutations in TLX1/3 deregulated cases.

References

    1. Hunger SP, Mullighan CG. Acute Lymphoblastic Leukemia in Children. N Engl J Med. 2015;373:1541–52. - PubMed
    1. Aifantis I, Raetz E, Buonamici S. Molecular pathogenesis of T-cell leukaemia and lymphoma. Nat Rev Immunol. 2008;8:380–90. - PubMed
    1. Coustan-Smith E, et al. Early T-cell precursor leukaemia: a subtype of very high-risk acute lymphoblastic leukaemia. Lancet Oncology. 2009;10:147–156. - PMC - PubMed
    1. Inukai T, et al. Clinical significance of early T-cell precursor acute lymphoblastic leukaemia: results of the Tokyo Children’s Cancer Study Group Study L99-15. Br J Haematol. 2012;156:358–65. - PubMed
    1. Weng AP, et al. Activating mutations of NOTCH1 in human T cell acute lymphoblastic leukemia. Science. 2004;306:269–71. - PubMed

METHODS ONLY REFERENCES

    1. Li H, Durbin R. Fast and accurate short read alignment with Burrows-Wheeler transform. Bioinformatics. 2009;25:1754–60. - PMC - PubMed
    1. Zhou X, et al. Exploring genomic alteration in pediatric cancer using ProteinPaint. Nat Genet. 2016;48:4–6. - PMC - PubMed
    1. Parker M, et al. C11orf95-RELA fusions drive oncogenic NF-kappaB signalling in ependymoma. Nature. 2014;506:451–5. - PMC - PubMed
    1. Anders S, Pyl PT, Huber W. HTSeq–a Python framework to work with high-throughput sequencing data. Bioinformatics. 2015;31:166–9. - PMC - PubMed
    1. Hoadley KA, et al. Multiplatform analysis of 12 cancer types reveals molecular classification within and across tissues of origin. Cell. 2014;158:929–44. - PMC - PubMed