. 2017 Aug;20(8):1133-1141.
doi: 10.1038/nn.4596. Epub 2017 Jul 3.

Reorganization of corticospinal output during motor learning

Affiliations

Reorganization of corticospinal output during motor learning

Andrew J Peters et al. Nat Neurosci. 2017 Aug.

Abstract

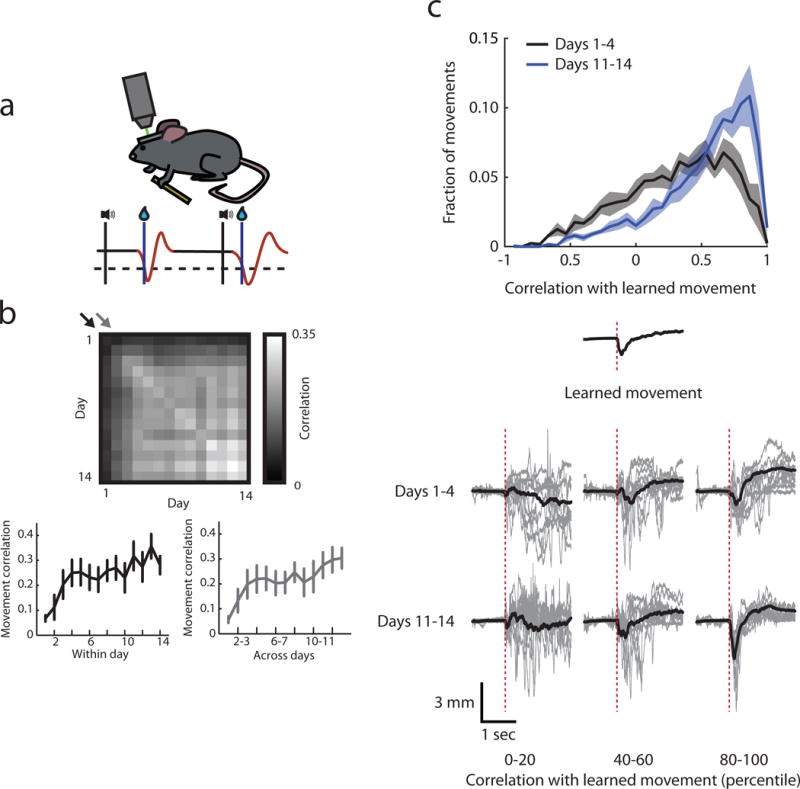
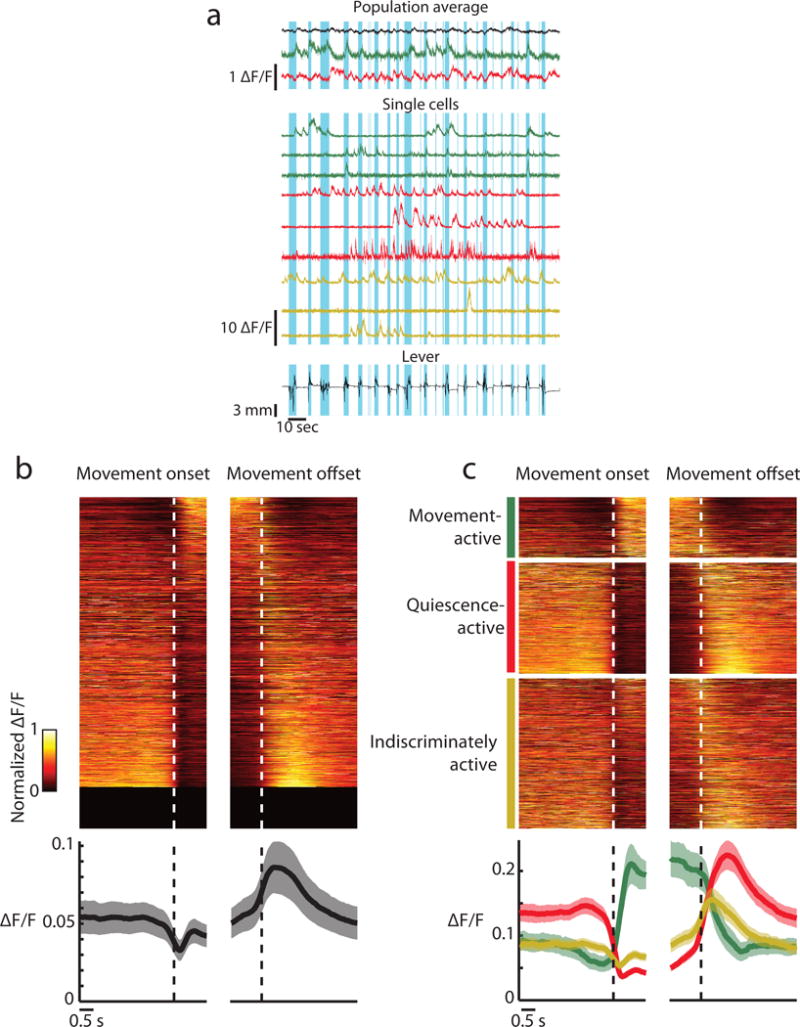
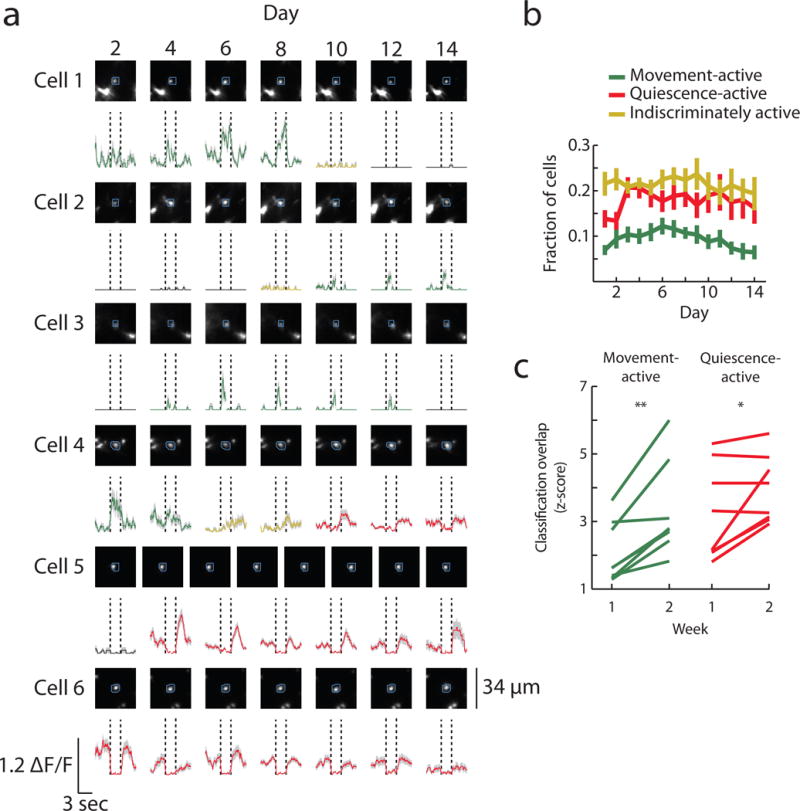
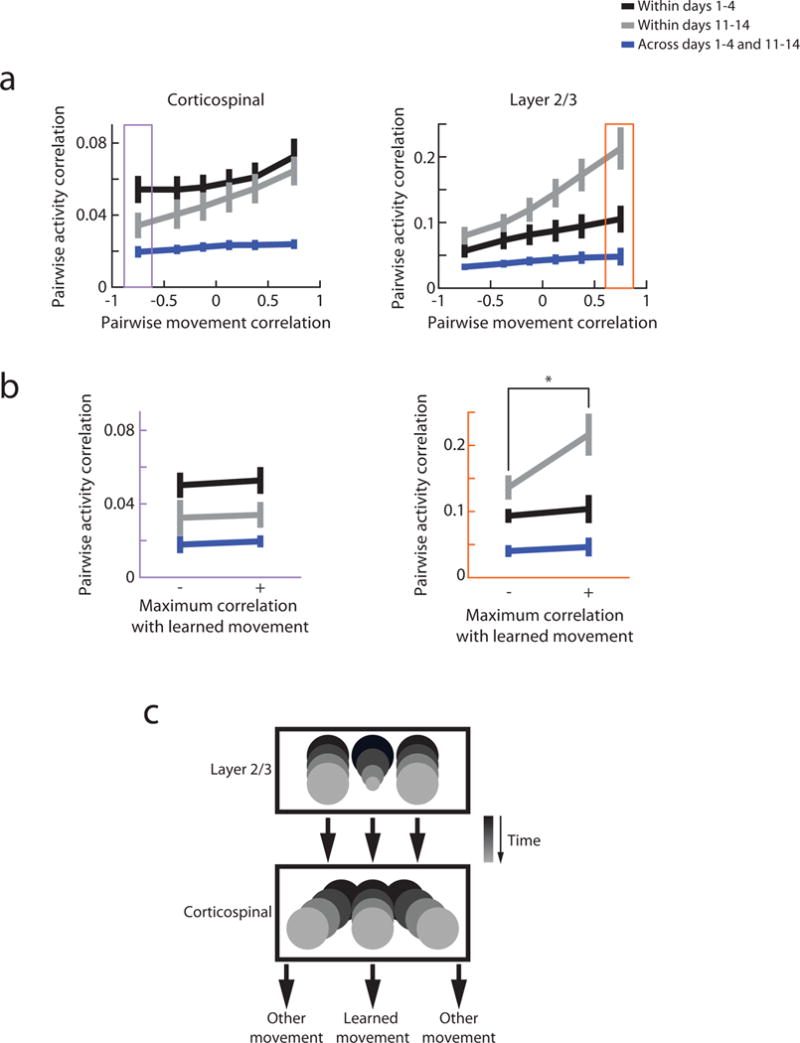
Motor learning is accompanied by widespread changes within the motor cortex, but it is unknown whether these changes are ultimately funneled through a stable corticospinal output channel or whether the corticospinal output itself is plastic. We investigated the consistency of the relationship between corticospinal neuron activity and movement through in vivo two-photon calcium imaging in mice learning a lever-press task. Corticospinal neurons exhibited heterogeneous correlations with movement, with the majority of movement-modulated neurons decreasing activity during movement. Individual cells changed their activity across days, which led to changed associations between corticospinal activity and movement. Unlike previous observations in layer 2/3, activity accompanying learned movements did not become more consistent with learning; instead, the activity of dissimilar movements became more decorrelated. These results indicate that the relationship between corticospinal activity and movement is dynamic and that the types of activity and plasticity are different from and possibly complementary to those in layer 2/3.


Figures

Figure 1
Figure 1. Corticospinal neuron labeling
(a) Schematic of injections to selectively express GCaMP6f in corticospinal neurons. (b) GCaMP6f-expressing cells are located in deep layers of the motor cortex and send axons through the pyramidal tract to the spinal cord. Left: ventral view of the brain. Center: dorsal view of the brain. Right: coronal brain slice including the motor cortex. (c) GCaMP6f-expressing corticospinal axons terminate in the intermediate lamina of the cervical spinal cord and do not extend to the thoracic or lumbar sections. Left: cervical spinal cord slice stained for NeuN (red) and GCaMP6f (green). Right: zooms of spinal cord slices in cervical (left), thoracic (middle), and lumbar (right) segments, illustrating the corticospinal tract (top row) and the intermediate spinal lamina (bottom row), corresponding to insets 1 and 2 on left. (d) Corticospinal neurons send collaterals to areas outside of the spinal cord. Left pictures are zoom of insets shown in pictures on right.
Figure 2
Figure 2. Imaging apical dendrites of corticospinal neurons
(a) Left: coronal section of the motor cortex, illustrating deep corticospinal cells and prominent apical dendrites. Middle: schematic of imaging plane. Right: example in vivo two-photon images of corticospinal dendrites across days, top left blue outlined images are zooms of the central regions outlined in blue. The same corticospinal dendrites could readily be identified each day. (b) Schematic of automated region-of-interest generation. Left: images are aligned across days (green unfilled circles represent imaged position, green filled circles represent aligned position). Center left: active regions are detected by thresholding across all images from all days (white circles), and the centroids of those regions are stored (red dots). Center right: the shapes of active regions are defined as contiguous pixels which are above threshold on at least 50% of the frames in which the predetermined centroid is above threshold. Right: regions-of-interest are created as the borders of active shapes. (c) Left: example semi-simultaneous recordings from a corticospinal neuron soma and its four apical dendrite branches. Images are side-projection (left), dendrite plane (top right), and soma plane (bottom right), traces are min-max normalized fluorescence from dendrites (colors correspond to regions of interest) and soma (black). Right: Histogram of L2 normalized fluorescence trace dot product among pairs of dendrites from different neurons (black, non-sibling branches) or the same neuron (blue, sibling branches) maximum normalized within each group. Red dotted line represents cutoff for defining sibling branches in dense imaging. (d) Example fluorescence traces from dendrite imaging. Indicated blue traces are putative sibling dendrites above the similarity threshold.
Figure 3
Figure 3. Lever press task
(a) Schematic of task. (b) Rewarded movement stereotypy increases across days. Top: median correlations between rewarded movements of all pairs of days. Bottom left: rewarded movement correlation within days corresponding to the diagonal of the top plot indicated by the black arrow, movements within days become increasingly stereotyped across time (Pearson’s correlation, r = 0.40, p < 0.001). Bottom right: rewarded movement correlation across adjacent days corresponding to the diagonal of the top plot indicated by the gray arrow, movements across days become increasingly stereotyped across time (Pearson’s correlation, r = 0.39, p < 0.001). Error bars are s.e.m. across animals. (c) Mice perform one movement (“learned movement”) more often after learning but retain variability. Top: histogram of the correlation between all movements and the learned movement (defined as the average movement across days 11–14) in the early and late stages of learning. Mice produce more movements that look like the learned movement late in learning (two-sample Kolmogorov-Smirnov test, p < 0.001). Creating a template movement from days 1–4 did not result in a shifted distribution across learning (two-sample Kolmogorov-Smirnov test, p = 0.06), indicating that the shift in distribution is not an artifact of creating a template from the later days. Error bars are s.e.m. across animals. Middle: learned movement from an example animal. Bottom: example movements binned by correlation percentile to the learned movement. Gray, single movements, black, average of all movements within bin.
Figure 4
Figure 4. Corticospinal neurons are heterogeneously related to movement
(a) Example activity from a single mouse. Top, population average of all neurons (black), movement-active neurons (green) and quiescence-active neurons (red). Middle, single cells that are movement-active (green), quiescence-active (red) and indiscriminately active (yellow). Bottom, lever movements. Blue highlighted regions represent portions of the lever trace which were detected as movement. (b) Activity of all cells aligned to movement onset and offset (dashed lines). Top: activity of all recorded cells in all animals min-max normalized for the average within each day then averaged across days (1553 cells), sorted by the coefficient of the first principal component of average activity across cells. Bottom: average activity across all cells, then averaged across animals. Error bars are s.e.m. across animals. (c) Average activity of active classes of cells aligned to movement onset and offset (dashed lines). Top: activity of all recorded cells that fell into each category on at least one day, min-max normalized within day and then averaged across days with that classification, sorted by the coefficient of the first principal component of average activity across all cells (413 movement-active cells, 760 quiescence-active cells, 1026 indiscriminately active cells). Note that if a cell was classified differently across days, then it will appear under multiple classes and averaged across the days with that classification. Bottom: average activity across all cells of a given classification averaged across days with that classification, then averaged across animals. Error bars are s.e.m. across animals.
Figure 5
Figure 5. Relationship between corticospinal activity and movement is dynamic
(a) Example classified neurons. Top: maximum projection images from each day, blue circles indicate ROIs. Bottom: average fluorescence traces aligned to movement onset (left vertical black lines) and movement offset (right vertical black lines), green, movement-active; red, quiescence-active; yellow, indiscriminately active; black, silent classification. (b) Fraction of classified cells across time, error bars are s.e.m. The fraction of quiescence cells increases after the first two days (paired Wilcoxon signed-rank test between the mean of days 1–2 and the mean of days 3–4 after z-scoring all values within animals, p = 0.008). (c) Mean fraction of neurons with same classification across days, expressed as a z-score relative to shuffling classifications within each day to control for number of classified neurons ((observed value – mean of shuffled values)/(standard deviation of shuffled values)). Both populations are more stable in the second week compared to the first (Wilcoxon signed-rank test, movement-active: p = 0.008, quiescence-active: p = 0.04).
Figure 6
Figure 6. Changes in activity across time
(a) Left (majority classification): fraction of all recorded cells divided by their majority classification within weeks (that is, the largest number of days with a given classification. For example, if a cell is classified as movement-active in 3 days and quiescence-active in 2 days of a week, then the cell’s majority classification of the week is movement-active). Center (average activity): average ΔF/F values across all cells during all movement and quiescence epochs. Activity during both movement and quiescence is stable in the first week while activity in both states decreases in the second week (Pearson’s correlation coefficient of values z-scored within animal, movement week 1 r = 0.02, p = 0.9; movement week 2 r = −0.51, p < 0.001; quiescence week 1 r = −0.23, p = 0.1; quiescence week 2 r = −0.26, p = 0.0497). Right (movement-aligned activity): average movement-aligned activity across all cells and across groups of days denoted by colored lines. Error bars are s.e.m. across animals. (b) Plots as in (a) for different groups of cells according to their classification by week. Cell populations are indicated by pie charts and correspond to cells stably movement-active (top left), stably quiescence-active (top right), switching out of movement-active (center left), switching to movement-active (center right), switching out of quiescence-active (bottom left), and switching to quiescence-active (bottom right). Activity during movement for stably movement-active cells increased in the first week and decreased in the second week, and activity during quiescence for stably quiescence-active cells did not change in the first week and decreased in the second week (Pearson’s correlation coefficient of values z-scored within animal, stably movement-active cells during movement week 1 r = 0.53, p < 0.001; stably movement-active cells during movement week 2 r = −0.48, p < 0.001; stably quiescence-active cells during quiescence week 1 r = 0.14, p = 0.3; stably quiescence-active cells during quiescence week 2 r = −0.53, p < 0.001). Error bars are s.e.m. across animals.
Figure 7
Figure 7. Cell-type-specific differences in the relationship between movement and activity
(a) Pairwise correlation in population activity as a function of correlation of accompanying movements. Left; corticospinal, right; layer 2/3. The interaction between movement correlation and activity correlation becomes stronger over time for both corticospinal and layer 2/3 cells (paired Wilcoxon sign-rank test of the fitted slope for black vs. gray lines, corticospinal p = 0.008, layer 2/3 p = 0.02). In corticospinal cells, this derived from less correlated activity for negatively correlated movements (paired Wilcoxon signed-rank test for negatively correlated movement bins for black vs. gray lines, p = 0.009). In layer 2/3 cells, activity became more correlated for similar movements (paired Wilcoxon signed-rank test for positively correlated movement bins for black vs. gray lines, p < 0.001). The activity patterns after learning were novel compared to those before learning (paired Wilcoxon sign-rank test of the fitted slope for gray vs. blue lines, corticospinal p = 0.008, layer 2/3 p = 0.02). Error bars are s.e.m. across animals. (b) Pairwise correlation in population activity for movements separated by type of movements. Left: pairwise correlation of corticospinal population activity on pairs of trials with dissimilar movements (from data within the purple box in Fig. 7a, left). Correlation in activity does not depend on the type of movement made (paired Wilcoxon signed-rank test, black line p = 0.9, gray line p = 0.4, blue line p = 0.5). Right: pairwise correlation in layer 2/3 population activity on pairs of trials with similar movements (from data within the orange box in Fig. 7a, right). Correlation in activity is higher specifically for learned movements late in learning (paired Wilcoxon signed-rank test, black line p = 0.5, gray line p = 0.02, blue line p = 1). Error bars are s.e.m. across animals. (c) Schematic of population-specific changes in relationship between activity and movement. Boxes represent spaces of potential activity patterns, circles represent activity patterns which are associated with given movements within each day, and days progress from black to gray. Utilized activity drifts across time in both populations. In layer 2/3 this is accompanied by a more consistent activity pattern specifically for the learned movement (smaller circle). Conversely, in corticospinal neurons, different movements associate with more separable activity patterns (separation of gray circles).

References

    1. Heffner R, Masterton B. Variation in form of the pyramidal tract and its relationship to digital dexterity. Brain Behav Evol. 1975;12:161–200. - PubMed
    1. Armand J. The origin, course and terminations of corticospinal fibers in various mammals. Prog Brain Res. 1982;57:329–60. - PubMed
    1. Oswald MJ, Tantirigama MLS, Sonntag I, Hughes SM, Empson RM. Diversity of layer 5 projection neurons in the mouse motor cortex. Front Cell Neurosci. 2013;7:174. - PMC - PubMed
    1. Evarts EV. Relation of pyramidal tract activity to force exerted during voluntary movement. J Neurophysiol. 1968;31:14–27. - PubMed
    1. Isomura Y, Harukuni R, Takekawa T, Aizawa H, Fukai T. Microcircuitry coordination of cortical motor information in self-initiation of voluntary movements. Nat Neurosci. 2009;12:1586–93. - PubMed