. 2017 Aug;20(8):1150-1161.
doi: 10.1038/nn.4594. Epub 2017 Jun 26.

Spatiotemporal profile of postsynaptic interactomes integrates components of complex brain disorders

Affiliations

Spatiotemporal profile of postsynaptic interactomes integrates components of complex brain disorders

Jing Li et al. Nat Neurosci. 2017 Aug.

Abstract

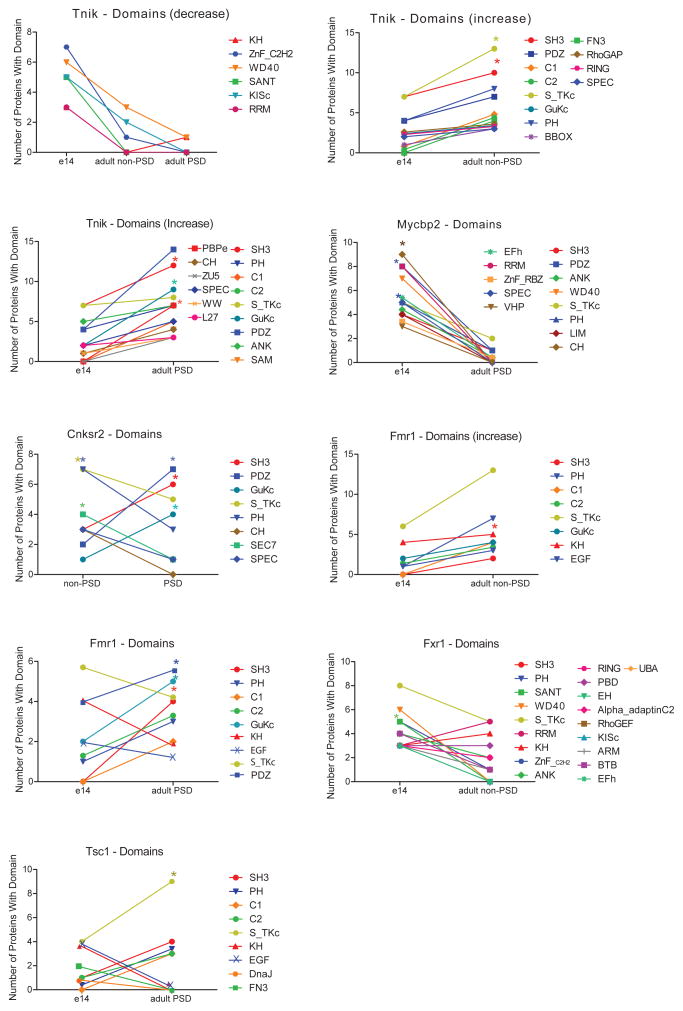
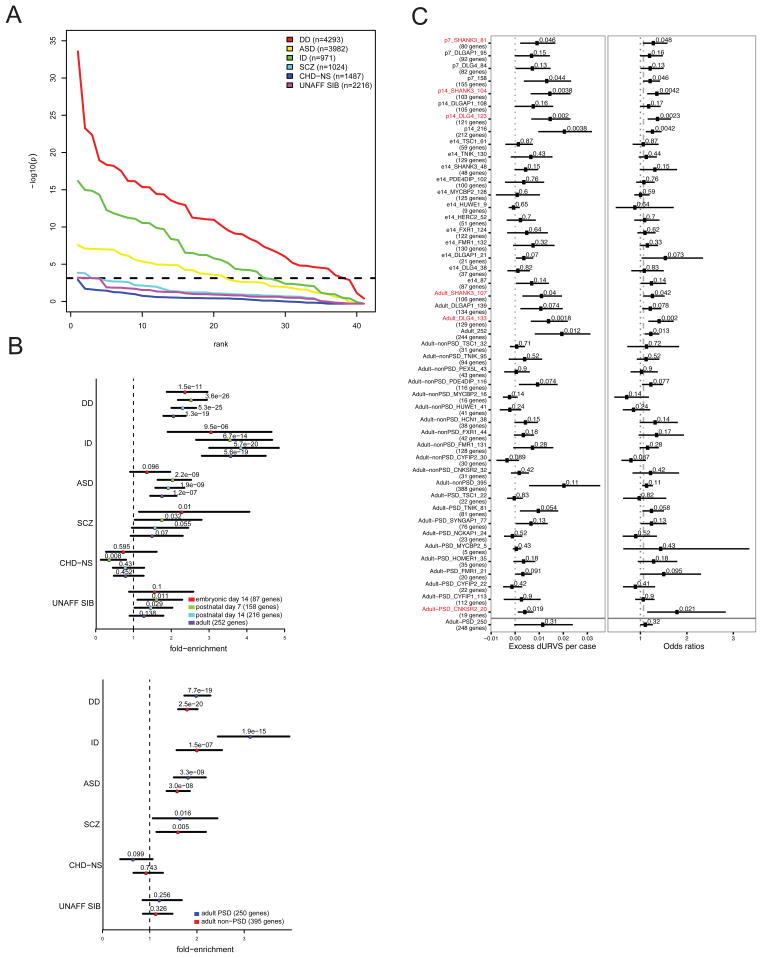
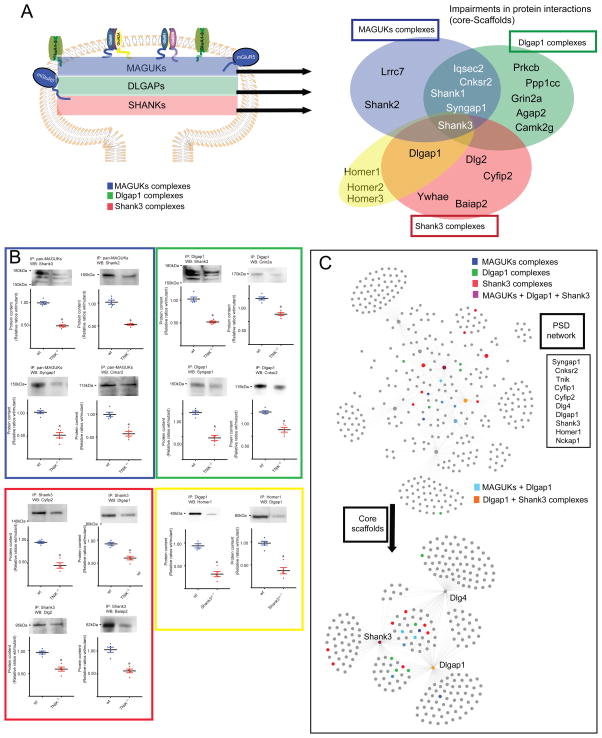
The postsynaptic density (PSD) contains a collection of scaffold proteins used for assembling synaptic signaling complexes. However, it is not known how the core-scaffold machinery associates in protein-interaction networks or how proteins encoded by genes involved in complex brain disorders are distributed through spatiotemporal protein complexes. Here using immunopurification, proteomics and bioinformatics, we isolated 2,876 proteins across 41 in vivo interactomes and determined their protein domain composition, correlation to gene expression levels and developmental integration to the PSD. We defined clusters for enrichment of schizophrenia, autism spectrum disorders, developmental delay and intellectual disability risk factors at embryonic day 14 and adult PSD in mice. Mutations in highly connected nodes alter protein-protein interactions modulating macromolecular complexes enriched in disease risk candidates. These results were integrated into a software platform, Synaptic Protein/Pathways Resource (SyPPRes), enabling the prioritization of disease risk factors and their placement within synaptic protein interaction networks.


Figures

Figure 1
Figure 1
Developmental PSD-scaffold interactomes A. Cartoon of distribution of core PSD-scaffold families. B. Protein interactomes of core PSD-scaffolds Dlg4, Dlgap1 and Shank3 at embryonic day 14 (e14), postnatal day 7 (p7), postnatal day 14 (p4) and Adult mouse prefrontal cortex (PFC). Interactomes are derived from three independent experiments. C. Cartoon representation of protein interactions from core PSD-scaffolds. Figure represents a developmental change in core scaffolds through development with DLG scaffolds binding to NMDAR (NR1/NR2B) and DLGAPs in e14 protein complexes but not to SHANKs scaffolds. SHANKs protein complexes associate to downstream protein interactors at e14, without linking to DLGs and DLGAPs. Upstream components are first associated at p7. NR2A receptors at p14 and full scaffold interactions are observed in adult protein complexes. D. Percentage of scaffold-interactions reported in databases (Biogrid/Mentha) considering human, mouse and rat samples in in-vivo and in-vitro assays.
Figure 2
Figure 2
Human developmental transcriptome correlation in scaffold protein complexes A–D: Shows the correlation of mRNA expression levels for components of Dlg4, Dlgap1 and Shank3 protein complexes using Brainspan database. Average pairwise squared sample correlation (ACS) across all genes in Dlg4, Dlgap1 and Shank3 protein complexes are compared to pseudo-complexes (green) created by randomly sampling genes with similar expression values (n = 10,000 trials). The average sample correlation across each pseudo-complex shows that protein interactions grouped in scaffold complexes are significantly more correlated at each developmental stage. E. Correlation analysis illustrating the degree of similarity between scaffold complexes through development.
Figure 3
Figure 3
Protein domain profiling of PSD-scaffold interactomes A. Plots show developmental change and enrichment of protein domains present in Dlg4, Dlgap1 and Shank3 protein complexes. Domains were manually curated from SMART and Pfam databases and considered for analysis when present in at least 4 proteins in the complex. *P < 0.05, hypergeometric test followed by Bonferroni correction. B. Cartoon representing protein domain-domain interactions of core-scaffold domains (SAM, PDZ, GKAP, GUKc, ANK, SH3) through development. C–D. Chart and cartoon of domain architectures present in adult-PSD scaffold complexes. Chart shows the distribution of domain (x-axis) architectures present in individual proteins (y-axis) in complexes.
Figure 4
Figure 4
Developmental PSD scaffold network A. Developmental Dlg4, Dlgap1 and Shank3 protein interactions network. Color boxes show Dlg4, Dlgap1 and Shank3 developmental nodes (e14/p7/p14/Adult). Orange nodes indicate scaffold interactors used in interactome analysis. B. Brainspan mRNA expression correlation analysis of protein complexes of scaffold-interactors compared to pseudo-complexes (n = 10,000 trials). ACS shows significant correlation for protein interactions irrespective of developmental stage or cellular localization. D. Correlation analysis of protein interactions within protein complexes identifies major clustering components within components of adult PSD protein complexes associated to scaffolds and e14 stage.
Figure 5
Figure 5
Protein domain profiling of protein interactomes Protein domain composition and enrichment in e14, adult, PSD and non-PSD fraction of protein complexes for scaffold interactors. Protein domains were manually curated from SMART and Pfam databases. Charts shows changes in the composition of protein domains between two different stages, PSD/non-PSD, e14/Adult. *P < 0.05, hypergeometric test followed by Bonferroni correction.
Figure 6
Figure 6
Analyisis of synaptic interactomes in complex brain disorders A. Enrichment of de novo coding mutations on exome sequenced parent-proband trio cohorts for autism (ASD), developmental delay (DD), intellectual disability (ID), and schizophrenia (SCZ) in protein interaction complexes. Chart shows enrichment of protein-truncating and missense mutations (nonsynonymous) in protein interaction networks with respect to the baseline, as described in Samocha et al 2014, which indicates the simulated multiple testing correction (alpha=0.05) level. Controls including de novo mutations from unaffected siblings (UNAFF-SIB) of ASD and SCZ probands, and probands diagnosed with congenital heart disease but without any associated neurodevelopmental or syndromic phenotype (CHD-NS) are included. Two-sided binomial exact test. B. Shows enrichment analysis of nonsynonymous mutations in developmental (e14, p7, p14, Adult) scaffold complexes and in same protein complexes from PSD and non-PSD interactomes. Color boxes indicate protein complexes cellular localization and developmental stage. Top plot shows Dlg4, Dlgap1 and Shank3 developmental complexes collapsed per developmental stage showing fold-enrichment over mutation model expectations. Bottom plot shows comparison of scaffold interactors with PSD and non-PSD interactomes, All PSD and all non-PSD interactios were collapsed and plot shows fold-enrichment over the mutation model expectation. Two-sided binomial exact test. C. Shows enrichment for ultra-rare protein-altering variants (URVs) in individuals with schizophrenia. Graphs shows enrichment for PSD scaffolds Dlg4, Shank3 at different developmental stages and for the GWAS hit, Cnksr2, protein complexes. Figure includes scaffolds and interactors protein complexes, together with all complexes at any developmental stage (e14, p7, p14, Adult). Number of genes considered for analysis are displayed between parenthesis (genes correspond to proteins present in interactomes). Enrichment analysis and P values were determined using a linear (left) and a logistic (right) regression model (right) using exome-wide dURV count as a covariant to correct for average exome-wide burden (dot-dashed line). Horizontal bars indicate 95% confidence interval. Enrichment and P values were computed as described in Genovese et al., 2016 (methods).
Figure 7
Figure 7
Disruption of scaffold networks by mutations in high connected nodes A. Venn diagram shows disruption in protein interactions in MAGUK (blue), Dlgap1 (green), Shank3 (red) protein complexes in and Homer1, Dlgap1 protein complexes in Tnik−/− and Shank3ΔC−/+ mutant mice. Protein interactions were determined by immunoisolation of scaffold complexes and quantitation by HPLC-MS/MS in adult wt and mutant mouse PFC. Ratios of mutant/wt that scored as <0.67 in three independent experiments were considered a biological change. C. Clustering of PSD complexes, showing Tnik, Shank3, Cnksr2, Syngap1, Cyfip1, Cyfip2, Homer1, Nckap1, Dlg4 and Dlgap1 protein interactions. Color-boxes indicates disrupted interactions within the PSD protein interaction network. Disrupted interactions correspond to highly connected nodes within the network. Inset shows most abundant (top) protein domains present in proteins with impaired associations in PSD complexes. C. Shows confirmation of impairments in protein complexes shown in Figure 7A, B (same color code) by WB analysis of protein complexes determined in wt and mutant mouse. Representative cropped images of WB from PFC samples n = 4 independent experiments or more: Tnik−/−, IP: Shank3, WB: Dlg2 (n = 4 independent experiments); Tnik−/−, IP: Dlgap1, WB: Cnksr2 (n = 4 independent experiments); wt, IP: Dlgap1, WB: Homer1 (n = 4 independent experiments); wt IP: Homer1, WB: Dlgap1 (n = 6 independent experiments). All data represented as mean ± s.e.m. *P < 0.05, two tailed unpaired t test.

Similar articles

Cited by

References

    1. Bayes A, et al. Characterization of the proteome, diseases and evolution of the human postsynaptic density. Nature neuroscience. 2011;14:19–21. - PMC - PubMed
    1. Collins MO, et al. Molecular characterization and comparison of the components and multiprotein complexes in the postsynaptic proteome. Journal of neurochemistry. 2006;97(Suppl 1):16–23. - PubMed
    1. Coba MP, et al. Neurotransmitters drive combinatorial multistate postsynaptic density networks. Science signaling. 2009;2:ra19. doi: 10.1126/scisignal.2000102. - DOI - PMC - PubMed
    1. Collins MO, et al. Proteomic analysis of in vivo phosphorylated synaptic proteins. The Journal of biological chemistry. 2005;280:5972–5982. doi: 10.1074/jbc.M411220200. - DOI - PubMed
    1. Husi H, Ward MA, Choudhary JS, Blackstock WP, Grant SG. Proteomic analysis of NMDA receptor-adhesion protein signaling complexes. Nature neuroscience. 2000;3:661–669. - PubMed

MeSH terms

Substances