

An "EAR" on Environmental Surveillance and Monitoring: A Case Study on the Use of Exposure-Activity Ratios (EARs) to Prioritize Sites, Chemicals, and Bioactivities of Concern in Great Lakes Waters
- PMID: 28671818
- PMCID: PMC6132252
- DOI: 10.1021/acs.est.7b01613
An "EAR" on Environmental Surveillance and Monitoring: A Case Study on the Use of Exposure-Activity Ratios (EARs) to Prioritize Sites, Chemicals, and Bioactivities of Concern in Great Lakes Waters
Abstract
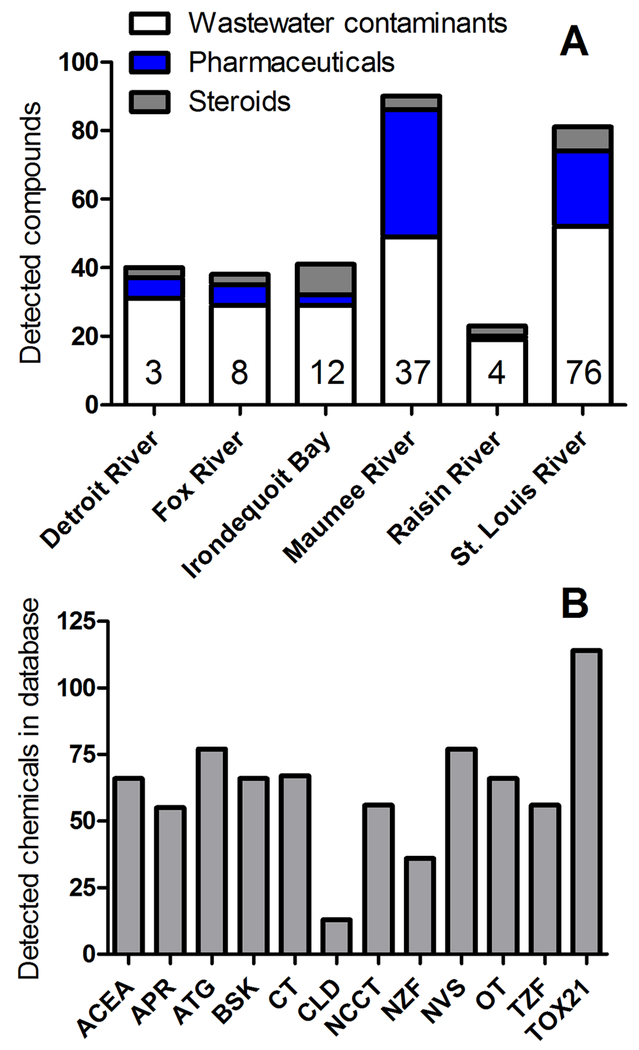
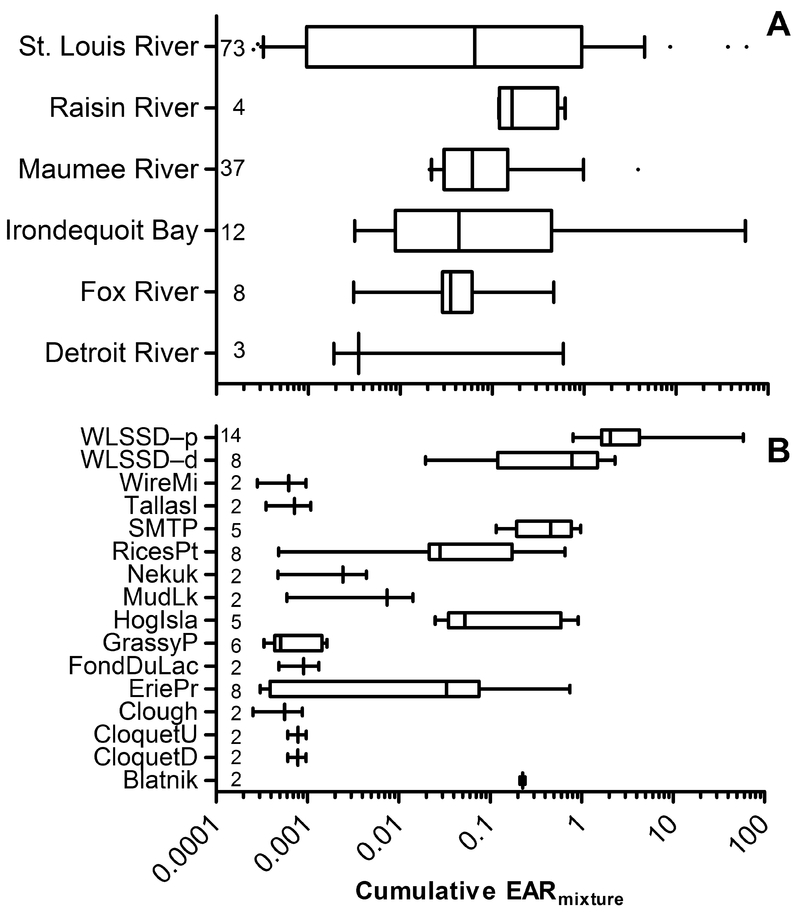
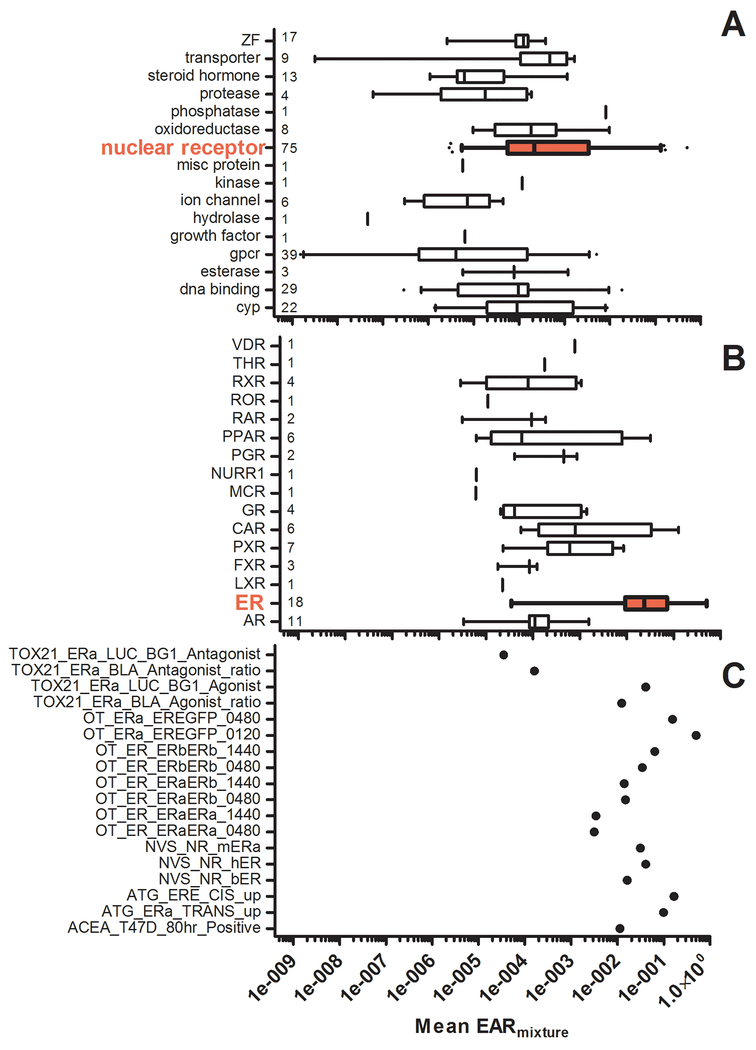
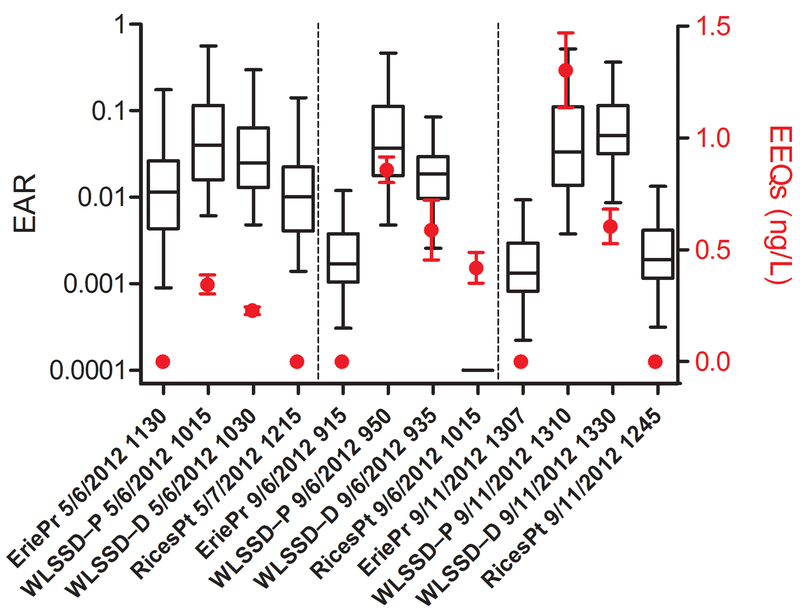
Current environmental monitoring approaches focus primarily on chemical occurrence. However, based on concentration alone, it can be difficult to identify which compounds may be of toxicological concern and should be prioritized for further monitoring, in-depth testing, or management. This can be problematic because toxicological characterization is lacking for many emerging contaminants. New sources of high-throughput screening (HTS) data, such as the ToxCast database, which contains information for over 9000 compounds screened through up to 1100 bioassays, are now available. Integrated analysis of chemical occurrence data with HTS data offers new opportunities to prioritize chemicals, sites, or biological effects for further investigation based on concentrations detected in the environment linked to relative potencies in pathway-based bioassays. As a case study, chemical occurrence data from a 2012 study in the Great Lakes Basin along with the ToxCast effects database were used to calculate exposure-activity ratios (EARs) as a prioritization tool. Technical considerations of data processing and use of the ToxCast database are presented and discussed. EAR prioritization identified multiple sites, biological pathways, and chemicals that warrant further investigation. Prioritized bioactivities from the EAR analysis were linked to discrete adverse outcome pathways to identify potential adverse outcomes and biomarkers for use in subsequent monitoring efforts.
Figures
References
-
- Lee KE, Langer SK, Menheer MA, Hansen DS, Foreman WT, Furlong ET, Jorgenson ZG, Choy SJ, Moore JN, Banda, JoAnn, and Gefell DJ, 2015, Chemicals of emerging concern in water and bottom sediment in the Great Lakes Basin, 2012—Collection methods, analytical methods, quality assurance, and study data: U.S. Geological Survey Data Series 910, 14 p., 10.3133/ds910. - DOI
-
- Kolpin DW; Furlong ET; Meyer MT; Thurman EM; Zaugg SD; Barber LB; Buxton HT, Pharmaceuticals, hormones, and other organic wastewater contaminants in U.S. streams, 1999–2000: a national reconnaissance. Environ. Sci. Technol. 2002, 36, (6), 1202–11. - PubMed
-
- Hug C; Ulrich N; Schulze T; Brack W; Krauss M, Identification of novel micropollutants in wastewater by a combination of suspect and nontarget screening. Environ. Pollut. 2014, 184, 25–32. - PubMed
-
- Peng H; Chen C; Saunders DM; Sun J; Tang S; Codling G; Hecker M; Wiseman S; Jones PD; Li A; Rockne KJ; Giesy JP, Untargeted identification of organo-bromine compounds in lake sediments by ultrahigh-resolution mass spectrometry with the data-independent precursor isolation and characteristic fragment method. Anal. Chem. 2015, 87, (20), 10237–46. - PubMed
-
- Peng H; Chen C; Cantin J; Saunders DM; Sun J; Tang S; Codling G; Hecker M; Wiseman S; Jones PD; Li A; Rockne KJ; Sturchio NC; Giesy JP, Untargeted screening and distribution of organo-bromine compounds in sediments of Lake Michigan. Environ. Sci. Technol. 2016, 50, (1), 321–30. - PubMed
MeSH terms
Substances
Grants and funding
LinkOut - more resources
Full Text Sources
Other Literature Sources
Research Materials
