Comparative Study
. 2017 Aug 1;56(30):3993-4004.
doi: 10.1021/acs.biochem.7b00224. Epub 2017 Jul 19.

Efficient Reduction of Vertebrate Cytoglobins by the Cytochrome b5/Cytochrome b5 Reductase/NADH System

Affiliations
Comparative Study

Efficient Reduction of Vertebrate Cytoglobins by the Cytochrome b5/Cytochrome b5 Reductase/NADH System

Matthew B Amdahl et al. Biochemistry. .

Abstract

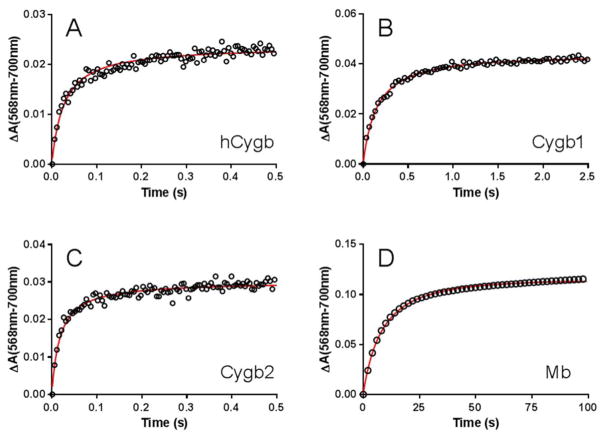
Cytoglobin is a heme-containing protein ubiquitous in mammalian tissues. Unlike the evolutionarily related proteins hemoglobin and myoglobin, cytoglobin shows a six-coordinated heme binding, with the heme iron coordinated by two histidine side chains. Cytoglobin is involved in cytoprotection pathways through yet undefined mechanisms, and it has recently been demonstrated that cytoglobin has redox signaling properties via nitric oxide (NO) and nitrite metabolism. The reduced, ferrous cytoglobin can bind oxygen and will react with NO in a dioxygenation reaction to form nitrate, which dampens NO signaling. When deoxygenated, cytoglobin can bind nitrite and reduce it to NO. This oxidoreductase activity could be catalytic if an effective reduction system exists to regenerate the reduced heme species. The nature of the physiological cytoglobin reducing system is unknown, although it has been proposed that ascorbate and cytochrome b5 could fulfill this role. Here we describe that physiological concentrations of cytochrome b5 and cytochrome b5 reductase can reduce human and fish cytoglobins at rates up to 250-fold higher than those reported for their known physiological substrates, hemoglobin and myoglobin, and up to 100-fold faster than 5 mM ascorbate. These data suggest that the cytochrome b5/cytochrome b5 reductase system is a viable reductant for cytoglobin in vivo, allowing for catalytic oxidoreductase activity.


Figures

Figure 1
Figure 1. Reduction of globins by Asc
The reduction of the three Cygbs and Mb (20 μM) by increasing concentrations of Asc was monitored by UV-Visible spectroscopy. For the three Cygbs, the reduction shows a hyperbolic behavior with a faster initial rate that decays into a second, more linear phase. All experiments were conducted at 37° C in 100 mM sodium phosphate, pH 7.4. Each trace is the average of 3 individual traces.
Figure 2
Figure 2. Rate constants for Asc-mediated reduction of Cygbs and Mb
Plots show the initial rate of globin reduction for a mixture of 20 μM ferric Cygb or Mb and varying concentrations of Asc. While the relationship becomes non-linear for Cygbs at high (>10 mM) Asc concentrations, a linear fit to all points at ≤10 mM Asc allows estimation of the second-order rate constants for the reduction of each protein by Asc. Red lines indicate the fits to the Michaelis-Menten equation (Cygbs) or a linear fit (Mb).
Figure 3
Figure 3. Reduction of globins by the CYB5/CYB5R/NADH system as compared to Asc
Panel A; Globins (20 μM) were incubated with 2 μM CYB5, 0.2 μM CYB5R. The reaction was initiated by the addition of 100 μM NADH. Panel B; Globins (20 μM) were mixed with 5 mM Asc. Panel C; Globins (20 μM) were incubated with 0.2 μM CYB5R. The reaction was initiated by the addition of 100 μM NADH. The reduction of the globins was monitored by UV-Visible spectroscopy. All experiments were conducted at 37° C in 100 mM sodium phosphate, pH 7.4. Each plotted trace is the average of 2 or more individual traces.
Figure 4
Figure 4. Determination of apparent KM values of the CYB5/CYB5R/NADH reducing system for Cygb and Mb
2 μM CYB5, 0.2 μM CYB5R and 100 μM NADH were premixed and the reactions was initiated by the addition of the indicated concentration of Cygb/Mb. The plots indicate the observed initial rates at each globin concentration. Red lines denote the fit of the data to the Michaelis-Menten equation. Reactions were carried out in 100 mM sodium phosphate, pH 7.4 at 37 °C.
Figure 5
Figure 5. Stopped-flow kinetics for the reaction of ferric globins with ferrous CYB5
Ferric globins (8–10 μM) were mixed with ferrous CYB5 (5–60 μM) in the stopped-flow instrument. The plots show the changes in absorbance at 568 nm (open circles) after subtracting the absorbance value at 700 nm at each time point. The traces are fitted according to Equation 6 (red lines). Reactions were carried out in 100 mM sodium phosphate, pH 7.4 at 25 °C.
Figure 6
Figure 6. Determination of reaction rate constants for the reaction of CYB5 with Cygb and Mb
The plots indicate the observed initial rates versus the CYB5 concentration for each of the three Cygbs and Mb. Lines denote the fit to Equation 5. All data was gathered at 25° C. At least three experimental sets generated for each protein, the points indicate a representative experiment for each protein.
Figure 7
Figure 7. Computer simulations and experimental assessment of the NO dioxygenase activity of Cygb
Panels A and B, simulated traces for the reduction of Cygb (20 μM) by different concentrations of CYB5 (Panel A) or Asc (Panel B). For the CYB5 calculations, the concentration of reduced CYB5R was kept constant at 0.2 μM. Oxygen concentration was kept constant at 130 μM (10% O2). Only the concentrations of the ferrous-oxy species (FeII-O2) are shown; the rest of the Cygb is mostly in the ferric (FeIII) form. See methods for details. Panels C and D, measured NO dioxygenase activity of Cygb in the presence of 2 μM CYB5 (Panel C) or 5 mM Asc (Panel D) in O2 saturated buffer. The red arrows indicate the additions of NO-saturated buffer (5 μM NO final concentration). The reactions with Asc are shown in wider panels to maintain same timescales. Dotted lines indicate 100% ferrous-oxy Cygb levels.
Figure 8
Figure 8. Electrostatic surfaces of CYB5 and selected heme globins
The surface potential for CYB5, hCygb, Mb and Ngb is shown. Positive potential is represented in blue, negative surface potential in red. The heme group is represented as red sticks. The scale under each structure indicates the relative magnitude of the color scale. The PDB structures used are 3NER (CYB5), 1UMO (hCygb), 5MBN (Mb), and 1OJ6 (Ngb). Protein structures and electrostatic surface potentials were generated with PyMOL .

References

    1. Kawada N, Kristensen DB, Asahina K, Nakatani K, Minamiyama Y, Seki S, Yoshizato K. Characterization of a stellate cell activation-associated protein (STAP) with peroxidase activity found in rat hepatic stellate cells. J Biol Chem. 2001;276:25318–25323. - PubMed
    1. Burmester T, Ebner B, Weich B, Hankeln T. Cytoglobin: a novel globin type ubiquitously expressed in vertebrate tissues. Mol Biol Evol. 2002;19:416–421. - PubMed
    1. Burmester T, Weich B, Reinhardt S, Hankeln T. A vertebrate globin expressed in the brain. Nature. 2000;407:520–523. - PubMed
    1. Trent JT, 3rd, Hargrove MS. A ubiquitously expressed human hexacoordinate hemoglobin. J Biol Chem. 2002;277:19538–19545. - PubMed
    1. Hankeln T, Wystub S, Laufs T, Schmidt M, Gerlach F, Saaler-Reinhardt S, Reuss S, Burmester T. The cellular and subcellular localization of neuroglobin and cytoglobin -- a clue to their function? IUBMB Life. 2004;56:671–679. - PubMed

Publication types

MeSH terms