. 2017 Jul 3;12(7):e0180148.
doi: 10.1371/journal.pone.0180148. eCollection 2017.

Fatty acid transport protein 1 regulates retinoid metabolism and photoreceptor development in mouse retina

Affiliations

Fatty acid transport protein 1 regulates retinoid metabolism and photoreceptor development in mouse retina

Aurélie Cubizolle et al. PLoS One. .

Abstract

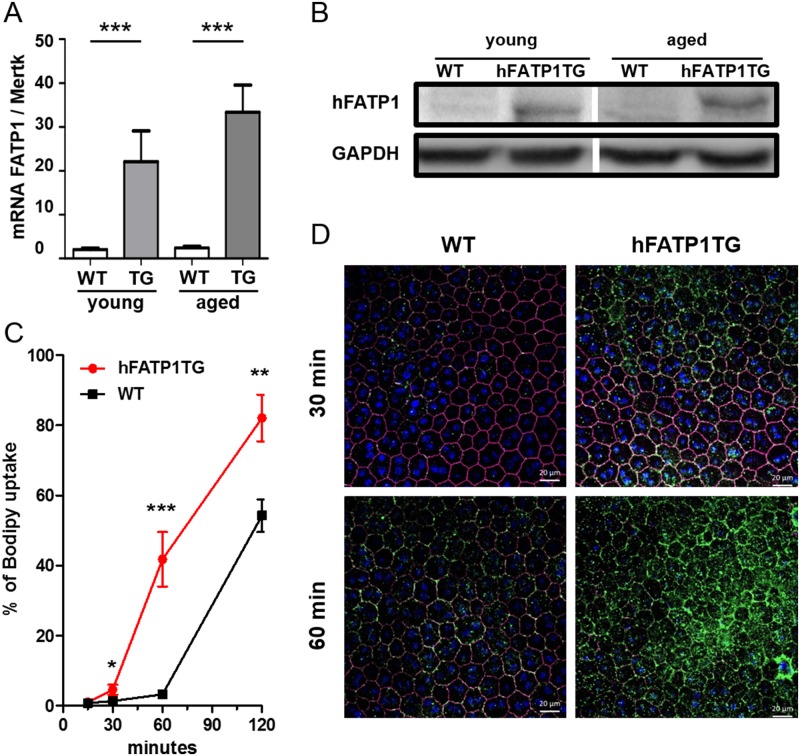
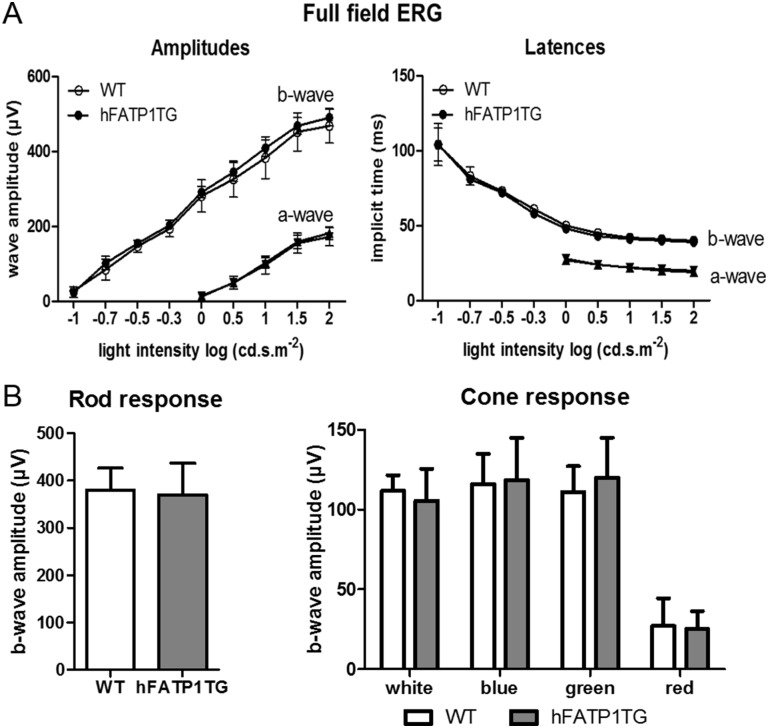
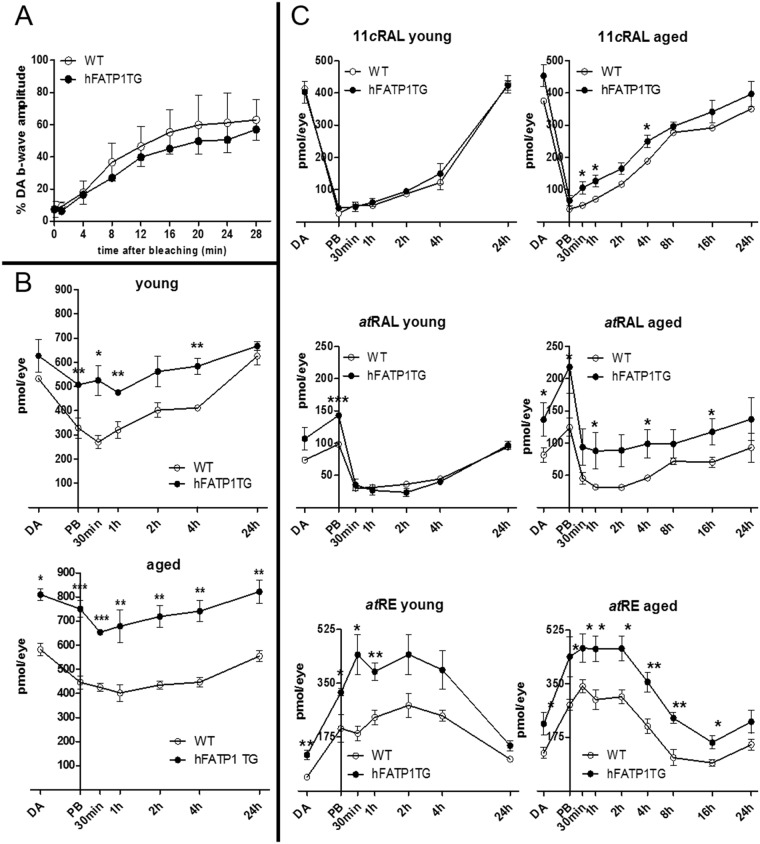
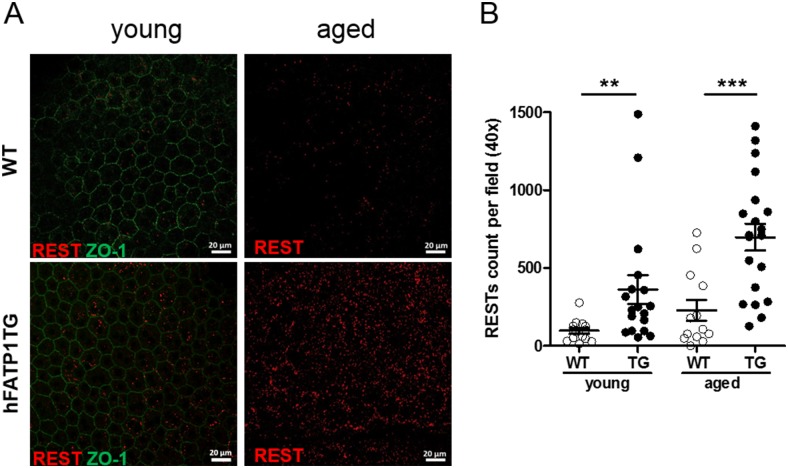
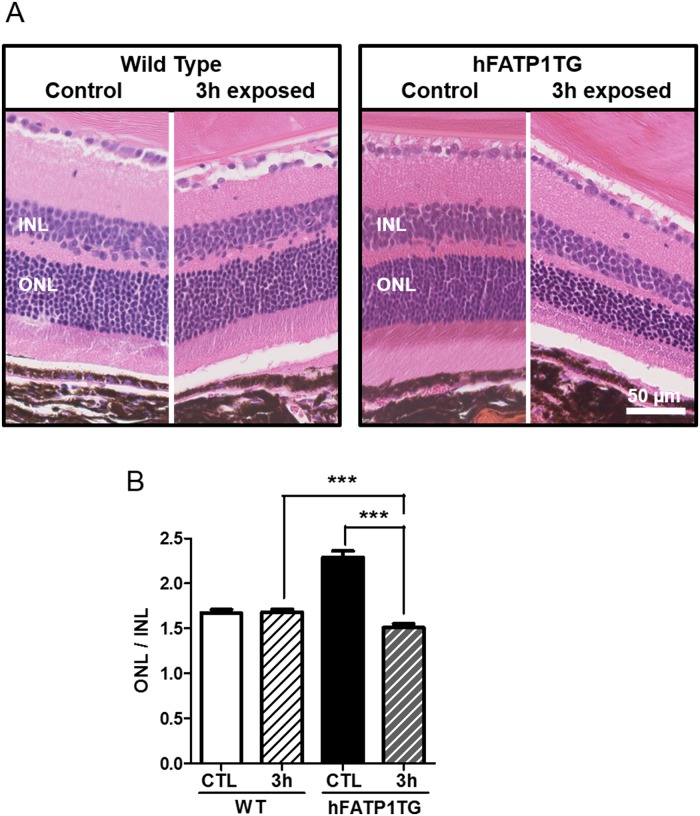
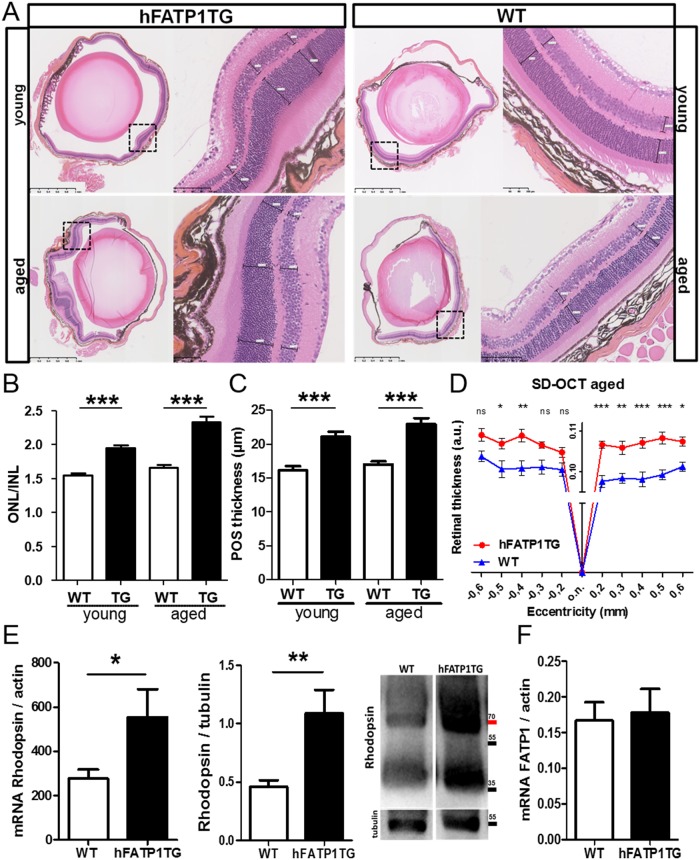
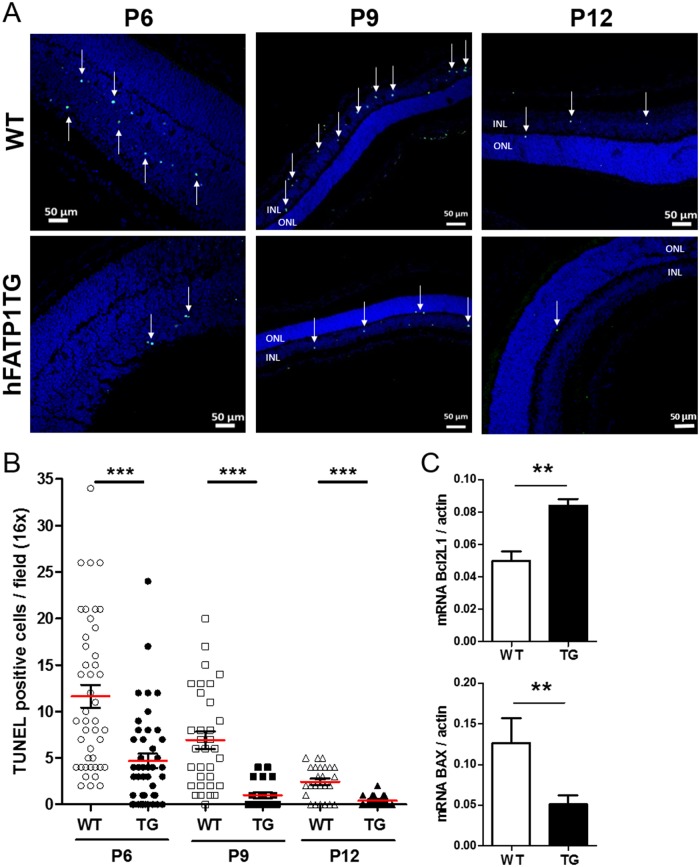
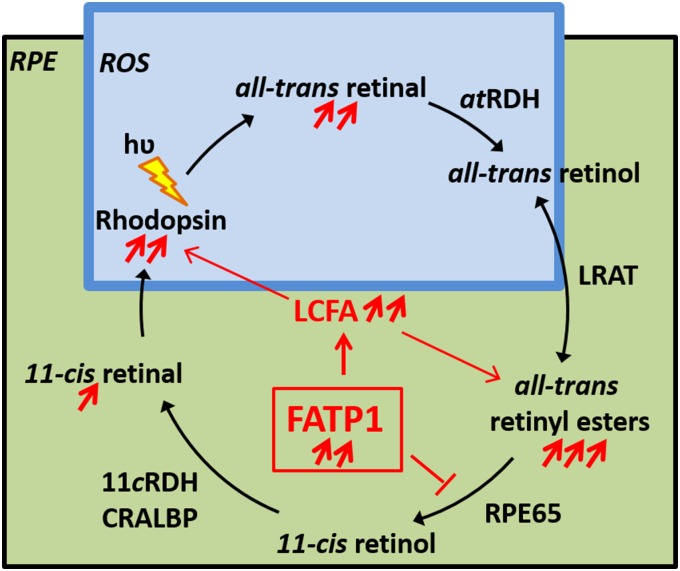
In retinal pigment epithelium (RPE), RPE65 catalyzes the isomerization of all-trans-retinyl fatty acid esters to 11-cis-retinol in the visual cycle and controls the rhodopsin regeneration rate. However, the mechanisms by which these processes are regulated are still unclear. Fatty Acid Transport Protein 1 (FATP1) is involved in fatty acid uptake and lipid metabolism in a variety of cell types. FATP1 co-localizes with RPE65 in RPE and inhibits its isomerase activity in vitro. Here, we further investigated the role of FATP1 in the visual cycle using transgenic mice that overexpress human FATP1 specifically in the RPE (hFATP1TG mice). The mice displayed no delay in the kinetics of regeneration of the visual chromophore 11-cis-retinal after photobleaching and had no defects in light sensitivity. However, the total retinoid content was higher in the hFATP1TG mice than in wild type mice, and the transgenic mice also displayed an age-related accumulation (up to 40%) of all-trans-retinal and retinyl esters that was not observed in control mice. Consistent with these results, hFATP1TG mice were more susceptible to light-induced photoreceptor degeneration. hFATP1 overexpression also induced an ~3.5-fold increase in retinosome autofluorescence, as measured by two-photon microscopy. Interestingly, hFATP1TG retina contained ~25% more photoreceptor cells and ~35% longer outer segments than wild type mice, revealing a non-cell-autonomous effect of hFATP1 expressed in the RPE. These data are the first to show that FATP1-mediated fatty acid uptake in the RPE controls both retinoid metabolism in the outer retina and photoreceptor development.


Conflict of interest statement

Competing Interests: The authors have declared that no competing interests exist.

Figures

Fig 1
Fig 1. Validation of hFATP1 overexpression in the RPE of hFATP1TG mice.
(A) qPCR analysis of FATP1 mRNA expression (human and mouse) in RPE of young (1–3-month-old, n = 4) and aged (6–9-month-old, n = 6) wild type (WT) and hFATP1 transgenic (TG) mice. Results are normalized to Mertk mRNA expression. (B) Western blot of hFATP1 protein expression in RPE of young and aged WT and hFATP1TG mice. GAPDH was probed as a loading control. (C) Kinetics of Bodipy C12 uptake, expressed as a percentage of total fluorescence, in flat-mounted RPE from young hFATP1TG and WT mice. The data are from n = 4–5 mice. *p < 0.05, **p < 0.01, ***p < 0.001. (D) Confocal fluorescence microscopy of Bodipy C12 uptake in flat mounts of RPE from young WT and hFATP1TG mice. DAPI and ZO-1 labeling permitted visualization of nuclei and tight junctions, respectively, of individual RPE cells.
Fig 2
Fig 2. Visual function is not impaired by hFATP1 overexpression.
(A) Full-field electroretinogram (ERG) analysis to determine light sensitivity of aged wild type (WT, n = 10) and hFATP1TG (n = 17) mice show no differences in a-wave and b-wave amplitudes or latencies. (B) Maximal b-wave amplitudes of rod and cone photoreceptors in aged WT (n = 6) and hFATP1TG (n = 8) mice. White light was used as stimulus for total rod and/or cone responses. Blue and green lights activate S and M cone photopigments respectively. No statistically significant differences were observed in any of the parameters measured.
Fig 3
Fig 3. Kinetics of the recovery of retinoids during dark adaptation of hFATP1TG mice.
(A) Kinetics of b-wave amplitude recovery in aged wild type (WT, n = 14) and hFATP1TG (n = 16) mice kept in darkness for the indicated times after photobleaching. Values are expressed as the percentage of the b-wave amplitude in dark-adapted (DA) mice. (B) HPLC quantification of total retinoids during dark adaptation of young (n = 3 per group) and aged (n = 6 per group) WT and hFATP1TG mice. (C) Kinetics of the recovery of 11cRAL (top), atRAL (middle), and atRE (bottom) contents in the retina of young (2-month-old, n = 3) and aged (4–6-month-old, n = 6) WT and hFATP1TG mice. Measurements were performed after overnight dark adaptation (DA), immediately after photobleaching (PB), or after being kept in darkness for the indicated times after PB. *p < 0.05, **p < 0.01, ***p < 0.001.
Fig 4
Fig 4. Age-related accumulation of retinosomes in the RPE of hFATP1TG mice.
(A) Two-photon microscopy (wavelength 780 nm) of retinosome (REST) autofluorescence (red) in whole flat mount preparations of RPE. Immunostaining of tight junctions with anti-ZO-1 (green) delineates RPE cells. (B) Quantification of autofluorescent RESTs in RPE of young and aged WT and hFATP1TG (hF1TG) mice (n = 3–4). Means± SEM are calculated from 13–20 fields. **p < 0.01, ***p < 0.001.
Fig 5
Fig 5. Light-induced retinal degeneration in hFATP1TG mice.
(A) H&E and safranin staining of the retinas of aged wild type (WT) and hFATP1TG mice (n = 3 per group) after dark adaptation (control) or bright light exposure (3 h, 20,000 lux) followed by darkness for 5 days. (B) Quantification of photoreceptor loss measured as the ratio of outer and inner nuclear layer thickness (ONL/INL) under the conditions shown in (A). The INL thickness did not change significantly with age and was used as the reference. ***p < 0.001.
Fig 6
Fig 6. Non-cell-autonomous effects of hFATP1 in the neural retina.
(A) H&E and safranin staining of 5 μm sagittal sections of eyecups of young (3-month-old) and aged (6–15-month-old) hFATP1TG and wild type (WT) mice. (B) Quantification of the ratio of outer and inner nuclear layer thickness (ONL/INL) of young and aged WT and transgenic (TG) and mice (n = 20 sections per mouse, 5 mice per group). (C) Quantification of photoreceptor outer segment (POS) length in young and aged WT mice and transgenic (TG) (n = 20 measures of length throughout the retina per mouse, 5 mice per group). (D) Spectral domain-optical coherence tomography (SD-OCT) measurements of retinal thickness of aged hFATP1TG and WT mice (n = 4 per group). o.n., optic nerve. (E) Quantification of rhodopsin mRNA (qPCR) and protein (western blot) levels in the neural retina of WT (n = 7) and hFATP1TG (n = 8) mice. (F) qPCR quantification of FATP1 mRNA levels in the neural retina of WT (n = 8) and transgenic (n = 7) mice. Data were normalized to actin mRNA and tubulin protein levels. *p < 0.05, **p < 0.01, ***p < 0.001.
Fig 7
Fig 7. Non-cell-autonomous effects of hFATP1 on photoreceptor development.
(A) TUNEL labeling (green foci, indicated by white arrows) in the retina of hFATP1TG and wild type (WT) mice on postnatal (P) days 6, 9, and 12 (n = 5 mice per group). (B) Quantification of TUNEL positive cells in the retina of P6, P9, and P12 transgenic (F1TG) and WT mice. TUNEL-positive cells were counted in all regions of the retina and are expressed as the number per field at 16× magnification (n = 5 mice per group). The results reveal a high frequency of apoptosis at P6 and P9, which is suppressed by hFATP1 overexpression. Mean values are represented by red bars. (C) qPCR quantification of Bcl2L1 and BAX mRNA in the neural retina of young hFATP1TG (hF1TG, n = 7) and wild type (WT, n = 6) mice. mRNA levels were normalized with actin.**p < 0.01, ***p < 0.001.
Fig 8
Fig 8. Regulation of the visual retinoid cycle by FATP1.
Schematic summarizing the effects of FATP1 overexpression in the mouse RPE. Rhodopsin, the light-sensitive protein in rods, is located in the disk membranes of rod outer segments (ROS). Absorption of a photon (hʋ) induces 11-cis to all-trans isomerization of retinaldehyde. All-trans-retinal then dissociates from rhodopsin and is reduced to all-trans-retinol, which is taken up by an RPE cell. Also in the RPE, FATP1 promotes long chain fatty acid (LCFA) uptake, thus providing LCFA-CoA for formation of phospholipids. All-trans-retinol is esterified with a phosphatidylcholine (PC)-derived LCFA to form all-trans-retinyl esters in a reaction catalyzed by LRAT. RPE65 then converts all-trans-retinyl esters to 11-cis-retinol. All-trans retinyl esters accumulate in the transgenic hFATP1TG RPE, suggesting increased levels of LCFAs and/or inhibition of RPE65. In ROS, the response to light remains unchanged, although rhodopsin expression increases. This increase is related to a greater number of PRs and their longer outer segments. Consequently, the rate of all-trans retinal formation is elevated, resulting in susceptibility to degeneration induced by light.

Similar articles

Cited by

References

    1. Sparrow JR, Hicks D, Hamel CP (2010) The retinal pigment epithelium in health and disease. Curr Mol Med 10: 802–823. - PMC - PubMed
    1. Bretillon L, Thuret G, Gregoire S, Acar N, Joffre C, et al. (2008) Lipid and fatty acid profile of the retina, retinal pigment epithelium/choroid, and the lacrimal gland, and associations with adipose tissue fatty acids in human subjects. Exp Eye Res 87: 521–528. doi: 10.1016/j.exer.2008.08.010 - DOI - PubMed
    1. Wright CB, Redmond TM, Nickerson JM (2015) A History of the Classical Visual Cycle. Prog Mol Biol Transl Sci 134: 433–448. doi: 10.1016/bs.pmbts.2015.06.009 - DOI - PubMed
    1. Sears AE, Palczewski K (2016) Lecithin:Retinol Acyltransferase: A Key Enzyme Involved in the Retinoid (visual) Cycle. Biochemistry 55: 3082–3091. doi: 10.1021/acs.biochem.6b00319 - DOI - PMC - PubMed
    1. Jin M, Li S, Moghrabi WN, Sun H, Travis GH (2005) Rpe65 is the retinoid isomerase in bovine retinal pigment epithelium. Cell 122: 449–459. doi: 10.1016/j.cell.2005.06.042 - DOI - PMC - PubMed

LinkOut - more resources