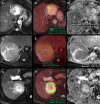
Quantitative assessment of simultaneous F-18 FDG PET/MRI in patients with various types of hepatic tumors: Correlation between glucose metabolism and apparent diffusion coefficient
- PMID: 28672016
- PMCID: PMC5495334
- DOI: 10.1371/journal.pone.0180184
Quantitative assessment of simultaneous F-18 FDG PET/MRI in patients with various types of hepatic tumors: Correlation between glucose metabolism and apparent diffusion coefficient
Abstract
Purpose: Metabolism and water diffusion may have a relationship or an effect on each other in the same tumor. Knowledge of their relationship could expand the understanding of tumor biology and serve the field of oncologic imaging. This study aimed to evaluate the relationship between metabolism and water diffusivity in hepatic tumors using a simultaneous positron emission tomography/magnetic resonance imaging (PET/MRI) system with F-18 fluorodeoxyglucose (FDG) and to reveal the metabolic and diffusional characteristics of each type of hepatic tumor.
Methods: Forty-one patients (mean age 63 ± 13 years, 31 male) with hepatic tumors (18 hepatocellular carcinoma [HCC], six cholangiocarcinoma [CCC], 10 metastatic tumors, one neuroendocrine malignancy, and six benign lesions) underwent FDG PET/MRI before treatment. Maximum standard uptake (SUVmax) values from FDG PET and the apparent diffusion coefficient (ADC) from the diffusion-weighted images were obtained for the tumor and their relationships were examined. We also investigated the difference in SUVmax and ADC for each type of tumor.
Results: SUVmax showed a negative correlation with ADC (r = -0.404, p = 0.009). The median of SUVmax was 3.22 in HCC, 6.99 in CCC, 6.30 in metastatic tumors, and 1.82 in benign lesions. The median of ADC was 1.039 × 10⁻³ mm/s2 in HCC, 1.148 × 10⁻³ mm/s2 in CCC, 0.876 × 10⁻³ mm/s2 in metastatic tumors, and 1.323 × 10⁻³ mm/s2 in benign lesions. SUVmax was higher in metastatic tumors than in benign lesions (p = 0.023). Metastatic tumors had a lower ADC than CCC (p = 0.039) and benign lesions (p = 0.004). HCC had a lower ADC than benign lesions, with a suggestive trend (p = 0.06).
Conclusion: Our results indicate that SUVmax is negatively correlated with ADC in hepatic tumors, and each group of tumors has different metabolic and water diffusivity characteristics. Evaluation of hepatic tumors by PET/MRI could be helpful in understanding tumor characteristics.
Conflict of interest statement
Figures


Similar articles
-
Correlation between standardized uptake value and apparent diffusion coefficient of neoplastic lesions evaluated with whole-body simultaneous hybrid PET/MRI.AJR Am J Roentgenol. 2013 Nov;201(5):1115-9. doi: 10.2214/AJR.13.11304. AJR Am J Roentgenol. 2013. PMID: 24147485
-
Measurement of apparent diffusion coefficient with simultaneous MR/positron emission tomography in patients with peritoneal carcinomatosis: comparison with 18F-FDG-PET.J Magn Reson Imaging. 2014 Nov;40(5):1121-8. doi: 10.1002/jmri.24497. Epub 2013 Nov 8. J Magn Reson Imaging. 2014. PMID: 24923481
-
Diffusion-weighted magnetic resonance imaging in metastatic gastrointestinal stromal tumor (GIST): a pilot study on the assessment of treatment response in comparison with 18F-FDG PET/CT.Acta Radiol. 2013 Oct;54(8):837-42. doi: 10.1177/0284185113485732. Epub 2013 May 9. Acta Radiol. 2013. PMID: 23761549
-
Hyperaccumulation of (18)F-FDG in order to differentiate solid pseudopapillary tumors from adenocarcinomas and from neuroendocrine pancreatic tumors and review of the literature.Hell J Nucl Med. 2013 May-Aug;16(2):97-102. doi: 10.1967/s002449910084. Epub 2013 May 20. Hell J Nucl Med. 2013. PMID: 23687644 Review.
-
Hepatic epithelioid angiomyolipoma mimicking hepatocellular carcinoma on MR and 18F-FDG PET/CT imaging: A case report and literature review.Hell J Nucl Med. 2022 May-Aug;25(2):205-209. doi: 10.1967/s002449912480. Epub 2022 Aug 3. Hell J Nucl Med. 2022. PMID: 35913867 Review.
Cited by
-
State of the art in magnetic resonance imaging of hepatocellular carcinoma.Radiol Oncol. 2018 Nov 26;52(4):353-364. doi: 10.2478/raon-2018-0044. Radiol Oncol. 2018. PMID: 30511939 Free PMC article. Review.
-
Morphological, dynamic and functional characteristics of liver pseudolesions and benign lesions.Radiol Med. 2022 Feb;127(2):129-144. doi: 10.1007/s11547-022-01449-w. Epub 2022 Jan 13. Radiol Med. 2022. PMID: 35028886 Review.
-
Dynomics: A Novel and Promising Approach for Improved Breast Cancer Prognosis Prediction.J Pers Med. 2023 Jun 15;13(6):1004. doi: 10.3390/jpm13061004. J Pers Med. 2023. PMID: 37373993 Free PMC article.
-
Magnetic resonance imaging for characterization of hepatocellular carcinoma metabolism.Front Physiol. 2022 Dec 15;13:1056511. doi: 10.3389/fphys.2022.1056511. eCollection 2022. Front Physiol. 2022. PMID: 36589457 Free PMC article. Review.
-
Spatial relationship of 2-deoxy-2-[18F]-fluoro-D-glucose positron emission tomography and magnetic resonance diffusion imaging metrics in cervical cancer.EJNMMI Res. 2018 Jun 15;8(1):52. doi: 10.1186/s13550-018-0403-7. EJNMMI Res. 2018. PMID: 29904822 Free PMC article.
References
-
- Kumar V A A, Aster J. Robbins & Cotran Pathologic Basis of Disease Saunders; 2015. pp. 870–873
-
- Assy N, Nasser G, Djibre A, Beniashvili Z, Elias S, Zidan J. Characteristics of common solid liver lesions and recommendations for diagnostic workup. World J Gastroenterol. 2009; 15: 3217–3227. doi: 10.3748/wjg.15.3217 - DOI - PMC - PubMed
-
- Czernin J, Allen-Auerbach M, Schelbert HR. Improvements in cancer staging with PET/CT: literature-based evidence as of September 2006. J Nucl Med. 2007; 48 Suppl 1: 78S–88S. - PubMed
-
- Gambhir SS, Czernin J, Schwimmer J, Silverman DH, Coleman RE, Phelps ME. A tabulated summary of the FDG PET literature. J Nucl Med. 2001; 42: 1S–93S. - PubMed
-
- Folpe AL, Lyles RH, Sprouse JT, Conrad EU 3rd, Eary JF. (F-18) fluorodeoxyglucose positron emission tomography as a predictor of pathologic grade and other prognostic variables in bone and soft tissue sarcoma. Clin Cancer Res. 2000; 6: 1279–1287. - PubMed
MeSH terms
Substances
LinkOut - more resources
Full Text Sources
Other Literature Sources
Medical

