

Mountaintops phylogeography: A case study using small mammals from the Andes and the coast of central Chile
- PMID: 28672032
- PMCID: PMC5495339
- DOI: 10.1371/journal.pone.0180231
Mountaintops phylogeography: A case study using small mammals from the Andes and the coast of central Chile
Erratum in
-
Correction: Mountaintops phylogeography: A case study using small mammals from the Andes and the coast of central Chile.PLoS One. 2017 Oct 2;12(10):e0186031. doi: 10.1371/journal.pone.0186031. eCollection 2017. PLoS One. 2017. PMID: 28968446 Free PMC article.
Abstract
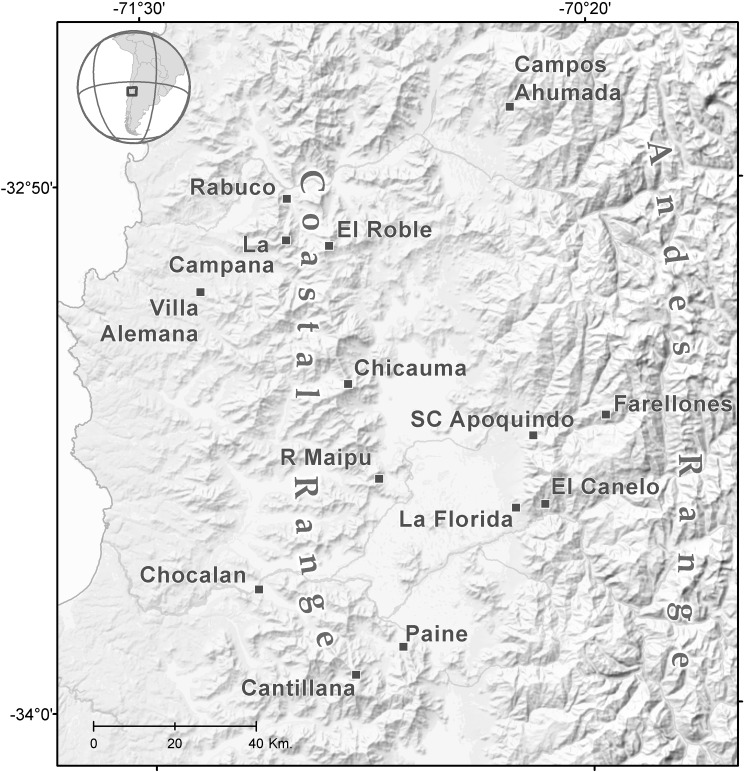
We evaluated if two sigmodontine rodent taxa (Abrothrix olivacea and Phyllotis darwini) from the Andes and Coastal mountaintops of central Chile, experienced distributional shifts due to altitudinal movements of habitat and climate change during and after the Last Glacial Maximum (LGM). We tested the hypothesis that during LGM populations of both species experienced altitudinal shifts from the Andes to the lowlands and the coastal Cordillera, and then range retractions during interglacial towards higher elevations in the Andes. These distributional shifts may have left remnants populations on the mountaintops. We evaluated the occurrence of intraspecific lineages for each species, to construct distribution models at LGM and at present, as extreme climatic conditions for each lineage. Differences in distribution between extreme climatic conditions were interpreted as post-glacial distributional shifts. Abrothrix olivacea displayed a lineage with shared sequences between both mountain systems, whereas a second lineage was restricted to the Andes. A similar scenario of panmictic unit in the past was recovered for A. olivacea in the Andes, along with an additional unit that included localities from the rest of its distribution. For P. darwini, both lineages recovered were distributed in coastal and Andean mountain ranges at present as well, and structuring analyses for this species recovered coastal and Andean localities as panmictic units in the past. Niche modeling depicted differential postglacial expansions in the recovered lineages. Results suggest that historical events such as LGM triggered the descending of populations to Andean refuge areas (one of the A. olivacea's lineages), to the lowlands, and to the coastal Cordillera. Backward movements of populations after glacial retreats may have left isolates on mountaintops of the coastal Cordillera, suggesting that current species distribution would be the outcome of climate change and habitat reconfiguration after LGM.
Conflict of interest statement
Figures


References
-
- Hewitt GM. Genetic consequences of climatic oscillations in the Quaternary. Philos Trans R Soc London B Biol Sci. 2004;359: 183–195. doi: 10.1098/rstb.2003.1388 - DOI - PMC - PubMed
-
- Hewitt GM. The genetic legacy of the Quaternary ice ages. Nature. 2000;405: 907–913. doi: 10.1038/35016000 - DOI - PubMed
-
- Lessa EP, Cook JA, Patton JL. Genetic footprints of demographic expansion in North America, but not Amazonia, during the Late Quaternary. Proc Natl Acad Sci U S A. 2003;100: 10331–10334. doi: 10.1073/pnas.1730921100 - DOI - PMC - PubMed
-
- Hollin JT, Schilling DH. Late Wisconsin-Weichselian mountain glaciers and small ice caps In: Hughes GD and TG, editor. The Last great Ice Sheets. New York: Wiley; 1981. pp. 179–206.
-
- Mercer JH. Cenozoic Glaciation in the Southern Hemisphere. Annual Review of Earth and Planetary Sciences 1983. pp. 99–132. doi: 10.1146/annurev.ea.11.050183.000531 - DOI
MeSH terms
LinkOut - more resources
Full Text Sources
Other Literature Sources
Miscellaneous
