Comparative Study
. 2017 Jul 20;68(16):4463-4477.
doi: 10.1093/jxb/erx220.

Getting back to nature: a reality check for experiments in controlled environments

Affiliations
Comparative Study

Getting back to nature: a reality check for experiments in controlled environments

Maria Grazia Annunziata et al. J Exp Bot. .

Abstract

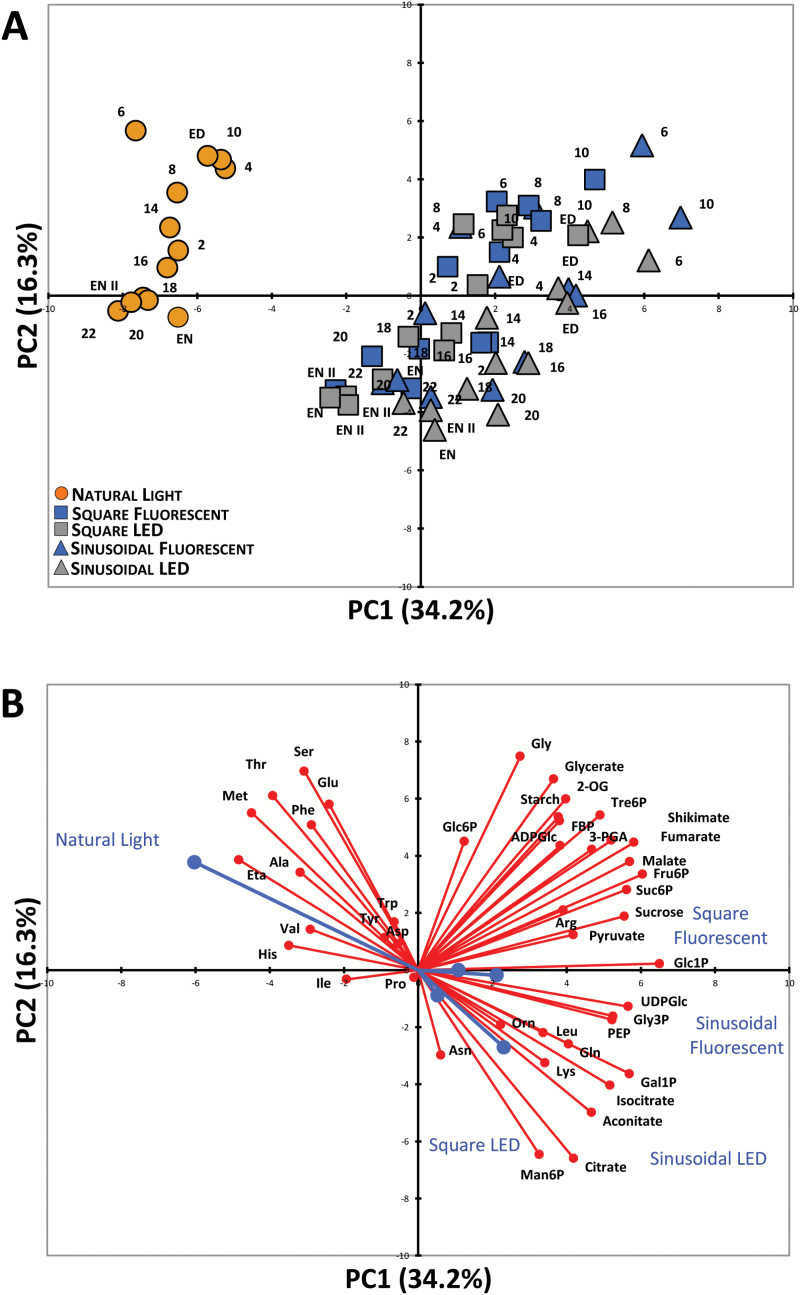
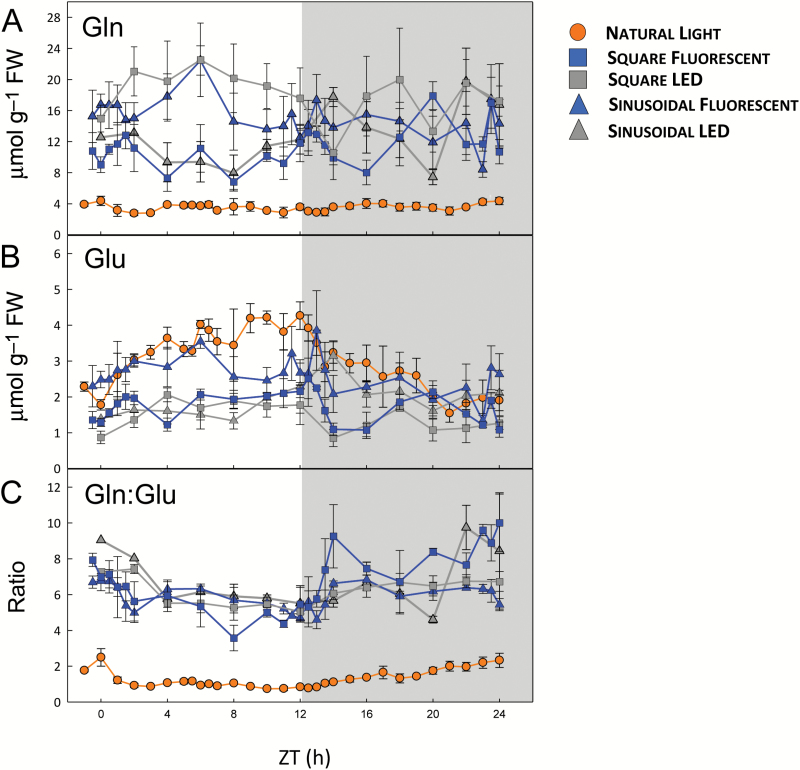
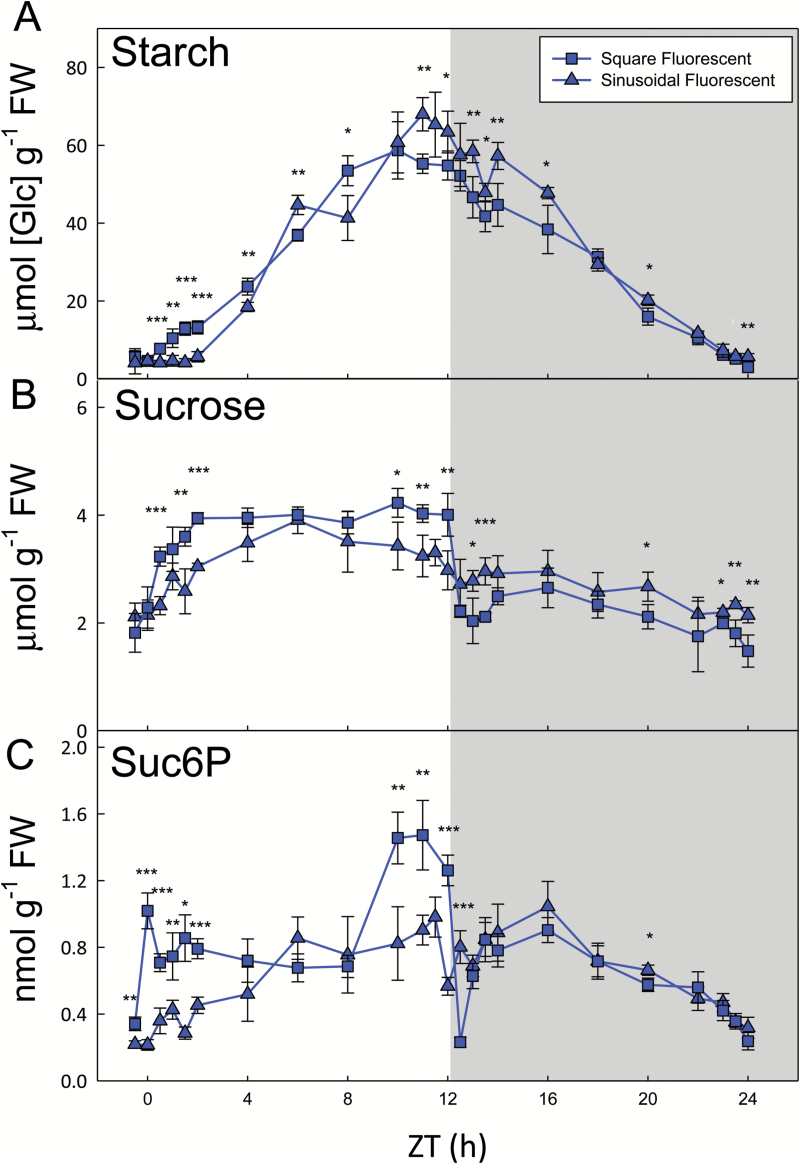
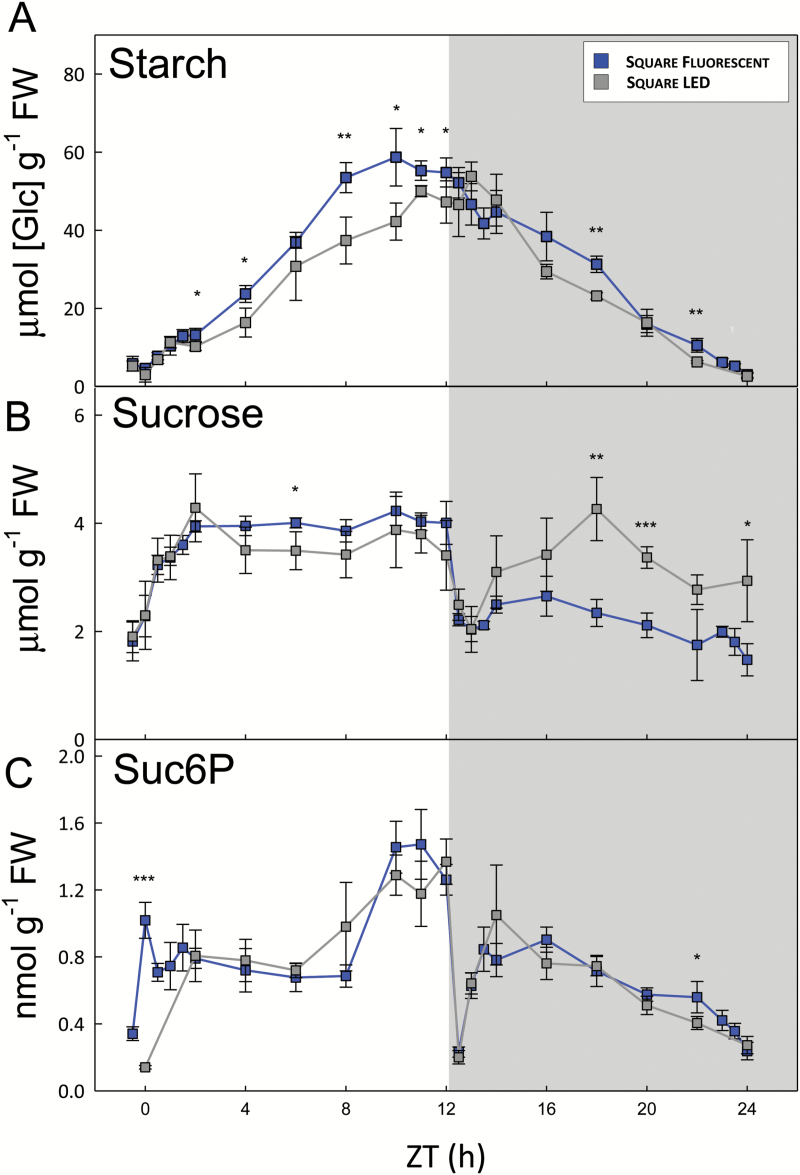
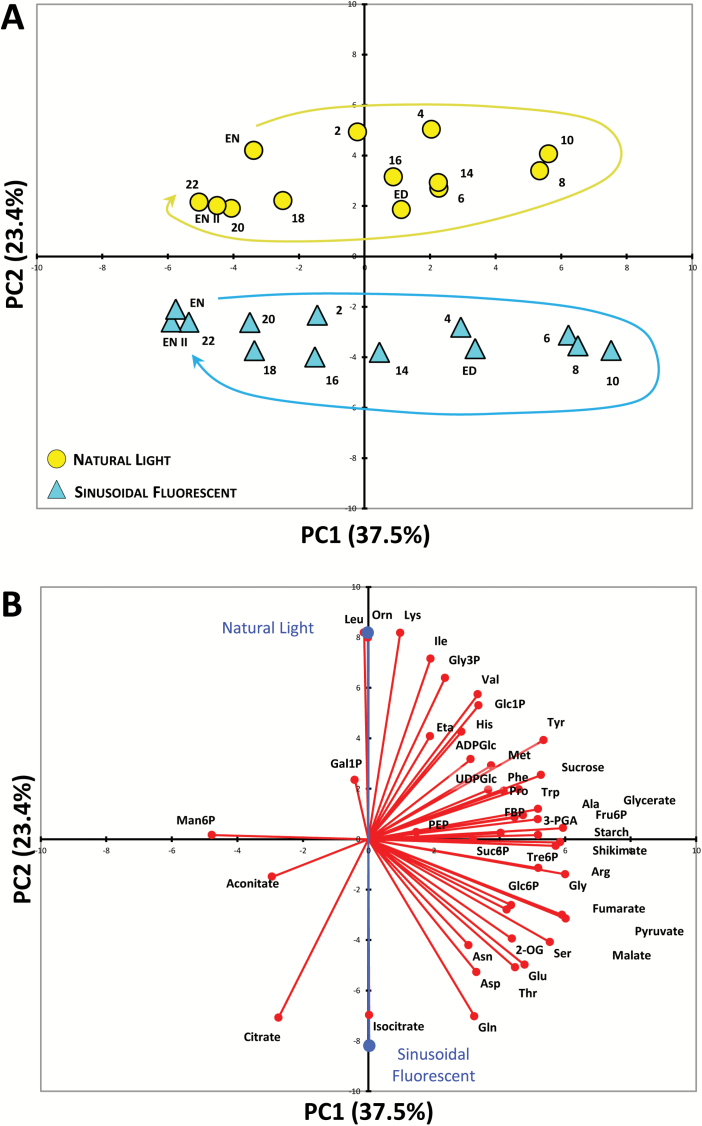
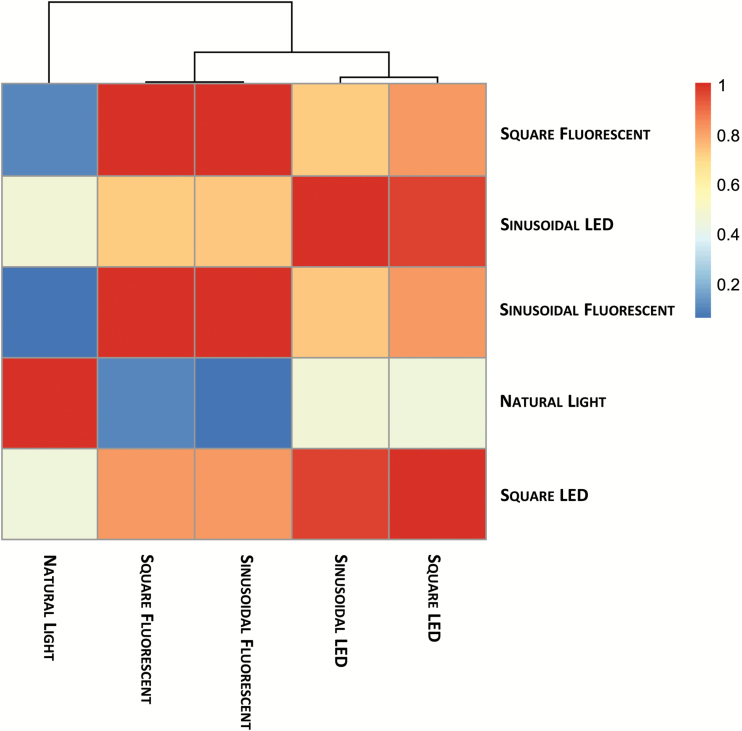
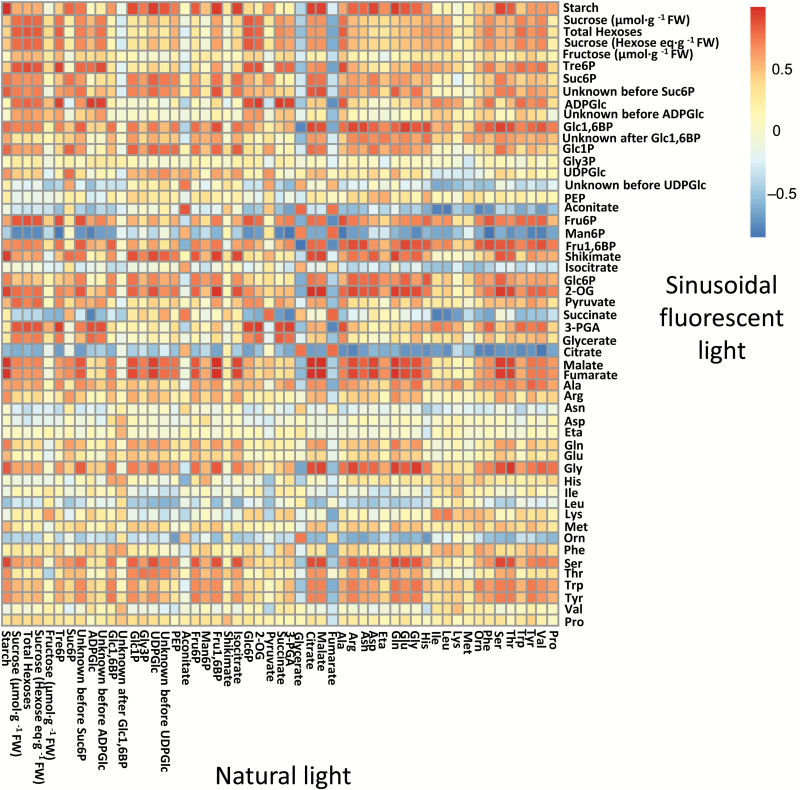
Irradiance from sunlight changes in a sinusoidal manner during the day, with irregular fluctuations due to clouds, and light-dark shifts at dawn and dusk are gradual. Experiments in controlled environments typically expose plants to constant irradiance during the day and abrupt light-dark transitions. To compare the effects on metabolism of sunlight versus artificial light regimes, Arabidopsis thaliana plants were grown in a naturally illuminated greenhouse around the vernal equinox, and in controlled environment chambers with a 12-h photoperiod and either constant or sinusoidal light profiles, using either white fluorescent tubes or light-emitting diodes (LEDs) tuned to a sunlight-like spectrum as the light source. Rosettes were sampled throughout a 24-h diurnal cycle for metabolite analysis. The diurnal metabolite profiles revealed that carbon and nitrogen metabolism differed significantly between sunlight and artificial light conditions. The variability of sunlight within and between days could be a factor underlying these differences. Pairwise comparisons of the artificial light sources (fluorescent versus LED) or the light profiles (constant versus sinusoidal) showed much smaller differences. The data indicate that energy-efficient LED lighting is an acceptable alternative to fluorescent lights, but results obtained from plants grown with either type of artificial lighting might not be representative of natural conditions.

Keywords: Amino acid; Arabidopsis; LED lighting; controlled environment; organic acid; starch; sucrose; thaliana; trehalose 6-phosphate; visible light spectrum.


Figures

Fig. 1.
Fig. 1.
Principal component analysis (PCA) of metabolite data from Arabidopsis plants. (A) PCA of metabolite data from plants grown in a naturally illuminated greenhouse (orange circles) or in controlled environment chambers with a 12-h photoperiod and daily light integral (DLI) of 7 mol m−2 d−1. The artificial illumination was provided by white fluorescent tubes (blue symbols) or LED lights (grey symbols), with either a constant (squares) or sinusoidal (triangles) light profile during the day. Numbers indicate the time of harvest in hours after dawn (zeitgeber time, ZT); ED, end of day (ZT12); EN I, end of preceding night (ZT0); EN II, end of night (ZT24). The percentages of total variance represented by principal component 1 (PC1) and principal component 2 (PC2) are shown in parentheses. (B) The loadings of individual metabolites (red) on the principal components shown in (A) and the (average) loadings of the individual experimental conditions (blue). Glucose and fructose were not included in the PCA due to the very high variability in the data.
Fig. 2.
Fig. 2.
Diurnal profiles of glutamine (Gln) and glutamate (Glu) in arabidopsis plants growing in natural or artificial light with a 12-h photoperiod. Arabidopsis thaliana Col-0 plants were grown in a naturally illuminated greenhouse around the vernal equinox in 2012 (orange circles) and in controlled environment chambers with a 12-h photoperiod and daily light integral (DLI) of 7 mol m−2 d−1. Artificial illumination was provided by white fluorescent tubes (blue symbols) or LEDs (grey symbols), with either a constant (squares) or sinusoidal (triangles) light profile. Rosettes were harvested from 4-week-old plants throughout a 24-h diurnal cycle for metabolite analysis. (A) Gln and (B) Glu were measured by HPLC, and the Gln:Glu ratio is shown in (C). Data are means ±SD (n=3 for LED conditions and n=4 for the others). ZT, zeitgeber time (hours after dawn).
Fig. 3.
Fig. 3.
Carbohydrate content of arabidopsis plants grown with constant or sinusoidal fluorescent light profiles. Arabidopsis thaliana Col-0 plants were grown in controlled environment chambers with a 12-h photoperiod and daily light integral (DLI) of 7 mol m−2 d−1. Illumination was provided by white fluorescent tubes with either a constant (squares) or sinusoidal (triangles) light profile, and rosettes were harvested from 4-week-old plants throughout a 24-h diurnal cycle for metabolite analysis. (A) Starch and (B) sucrose were measured enzymatically, and (C) sucrose 6′-phosphate (Suc6P) was measured by LC-MS/MS. Data are means ±SD (n=4). At each time point, significant differences between the two conditions are indicated as follows: *P<0.05, **P<0.01, ***P<0.001 (Student’s t-test). ZT, zeitgeber time (hours after dawn).
Fig. 4.
Fig. 4.
Carbohydrate content of arabidopsis plants grown with constant irradiance under fluorescent or LED lights. Arabidopsis thaliana Col-0 plants were grown in controlled environment chambers with a 12-h photoperiod and daily light integral (DLI) of 7 mol m−2 d−1. Illumination was provided by either white fluorescent tubes (blue) or LEDs (grey) with a constant irradiance during the day, and rosettes were harvested from 4-week-old plants throughout a 24-h diurnal cycle for metabolite analysis. (A) Starch and (B) sucrose were measured enzymatically, and (C) sucrose 6′-phosphate (Suc6P) was measured by LC-MS/MS. Data are means ±SD (n=4, fluorescent; n=3, LED). At each time point, significant differences between the two conditions are indicated as follows: *P<0.05, **P<0.01, ***P<0.001 (Student’s t-test). ZT, zeitgeber time (hours after dawn).
Fig. 5.
Fig. 5.
Principal component analysis (PCA) of metabolite data from arabidopsis plants. (A) PCA of metabolite data from plants grown in a naturally illuminated greenhouse (yellow circles) or in a controlled environment chamber with a 12-h photoperiod and daily light integral (DLI) of 12 mol m−2 d−1. The artificial illumination was provided by white fluorescent tubes with a sinusoidal (blue triangles) light profile during the day. Numbers indicate the time of harvest in hours after dawn (zeitgeber time, ZT); ED, end of day (ZT12); EN I, end of preceding night (ZT0); EN II, end of night (ZT24), and the diurnal trajectories are indicated by the arrows. The percentages of total variance represented by principal component 1 (PC1) and principal component 2 (PC2) are shown in parentheses. (B) The loadings of individual metabolites (red) on the principal components shown in (A) and the (average) loadings of the individual experimental conditions (blue). Glucose and fructose were not included in the PCA due to the very high variability in the data.
Fig. 6.
Fig. 6.
RV coefficient and correlation-based clustering of metabolite time-series data. Metabolite time-series data from Arabidopsis thaliana plants grown under natural or artificial light regimes with a 12-h photoperiod and daily light integral (DLI) of 7 mol m−2 d−1 were analysed by correlation-based clustering. A similarity score was calculated for each pair of growth conditions based on the covariance between the time-series of metabolite data. The results are displayed as a heat map with colours indicating the similarity score, where a value of 0 (blue) indicates no similarity and 1 (red) indicates complete correspondence of the compared covariance structures.
Fig. 7.
Fig. 7.
Correlation analysis of metabolite time-series data. Correlation matrix of metabolite time-series data from Arabidopsis thaliana plants grown under natural or fluorescent light with a 12-h photoperiod and daily light integral (DLI) of 12 mol m−2 d−1. The results are presented as a heat map with the correlation score indicated by the shading: red, significant positive correlation after Bonferroni correction; blue, significant negative correlation after Bonferroni correction; white, no significant correlation.

References

    1. Britz SJ, Hungerford WE, Lee DR. 1985. Photoperiodic regulation of photosynthate partitioning in leaves of Digitaria decumbens Stent. Plant Physiology 78, 710–714. - PMC - PubMed
    1. Britz SJ, Hungerford WE, Lee DR. 1987. Rhythms during extended dark periods determine rates of net photosynthesis and accumulation of starch and soluble sugars in subsequent light periods in leaves of Sorghum. Planta 171, 339–345. - PubMed
    1. Bruce TJ, Aradottir GI, Smart LE, et al. 2015. The first crop plant genetically engineered to release an insect pheromone for defence. Scientific Reports 5, 11183. - PMC - PubMed
    1. Carillo P, Parisi D, Woodrow P, Pontecorvo G, Massaro G, Annunziata MG, Fuggi A, Sulpice R. 2011. Salt-induced accumulation of glycine betaine is inhibited by high light in durum wheat. Functional Plant Biology 38, 139–150. - PubMed
    1. Darko E, Heydarizadeh P, Schoefs B, Sabzalian MR. 2014. Photosynthesis under artificial light: the shift in primary and secondary metabolism. Philosophical Transactions of the Royal Society Series B 369, 20130243. - PMC - PubMed

Publication types