

A comprehensive genomic pan-cancer classification using The Cancer Genome Atlas gene expression data
- PMID: 28673244
- PMCID: PMC5496318
- DOI: 10.1186/s12864-017-3906-0
A comprehensive genomic pan-cancer classification using The Cancer Genome Atlas gene expression data
Abstract
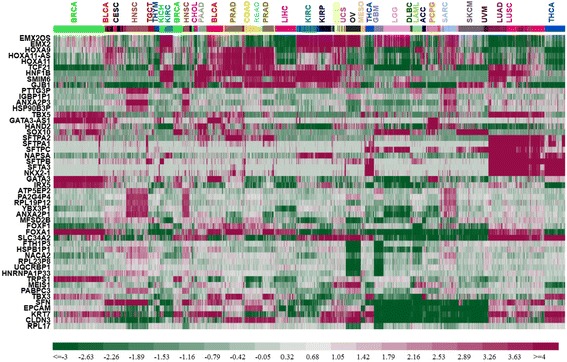
Background: The Cancer Genome Atlas (TCGA) has generated comprehensive molecular profiles. We aim to identify a set of genes whose expression patterns can distinguish diverse tumor types. Those features may serve as biomarkers for tumor diagnosis and drug development.
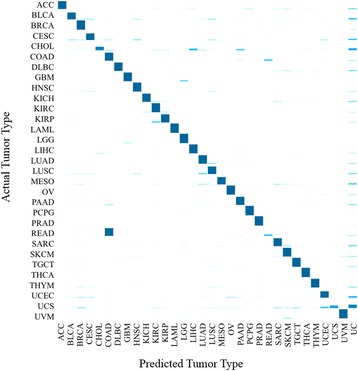
Methods: Using RNA-seq expression data, we undertook a pan-cancer classification of 9,096 TCGA tumor samples representing 31 tumor types. We randomly assigned 75% of samples into training and 25% into testing, proportionally allocating samples from each tumor type.
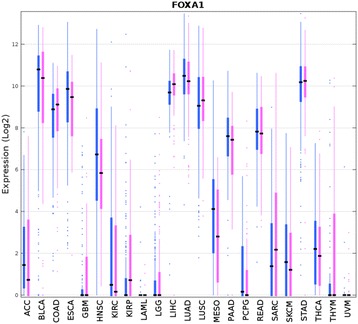
Results: We could correctly classify more than 90% of the test set samples. Accuracies were high for all but three of the 31 tumor types, in particular, for READ (rectum adenocarcinoma) which was largely indistinguishable from COAD (colon adenocarcinoma). We also carried out pan-cancer classification, separately for males and females, on 23 sex non-specific tumor types (those unrelated to reproductive organs). Results from these gender-specific analyses largely recapitulated results when gender was ignored. Remarkably, more than 80% of the 100 most discriminative genes selected from each gender separately overlapped. Genes that were differentially expressed between genders included BNC1, FAT2, FOXA1, and HOXA11. FOXA1 has been shown to play a role for sexual dimorphism in liver cancer. The differentially discriminative genes we identified might be important for the gender differences in tumor incidence and survival.
Conclusions: We were able to identify many sets of 20 genes that could correctly classify more than 90% of the samples from 31 different tumor types using TCGA RNA-seq data. This accuracy is remarkable given the number of the tumor types and the total number of samples involved. We achieved similar results when we analyzed 23 non-sex-specific tumor types separately for males and females. We regard the frequency with which a gene appeared in those sets as measuring its importance for tumor classification. One third of the 50 most frequently appearing genes were pseudogenes; the degree of enrichment may be indicative of their importance in tumor classification. Lastly, we identified a few genes that might play a role in sexual dimorphism in certain cancers.
Keywords: And sex dimorphism; Classification; Ga/KNN; Pan-cancer; RNA-seq; TCGA.
Conflict of interest statement
Competing interests
The authors declare that they have no competing interests.
Publisher’s Note
Springer Nature remains neutral with regard to jurisdictional claims in published maps and institutional affiliations.
Figures

References
Publication types
MeSH terms
LinkOut - more resources
Full Text Sources
Other Literature Sources
