. 2017 Jul 4:6:e27081.
doi: 10.7554/eLife.27081.

Polyglycerol-opioid conjugate produces analgesia devoid of side effects

Affiliations

Polyglycerol-opioid conjugate produces analgesia devoid of side effects

Sara González-Rodríguez et al. Elife. .

Abstract

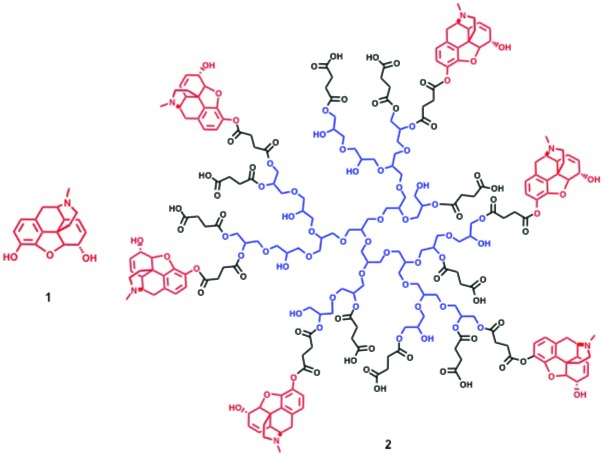
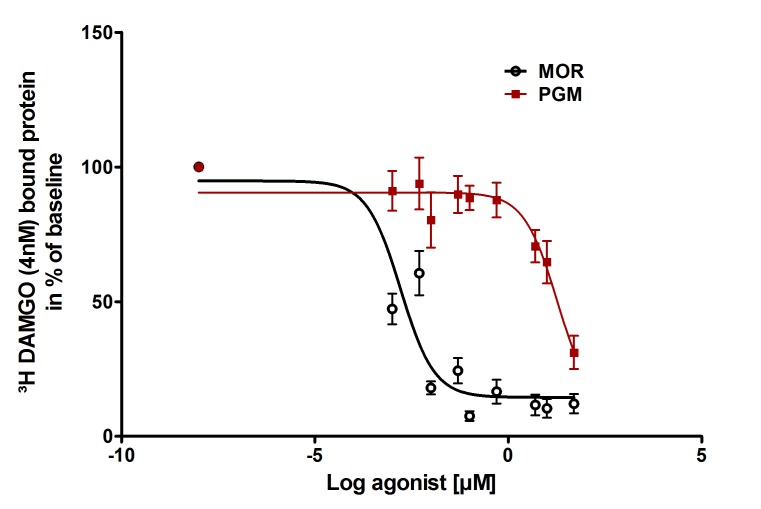
Novel painkillers are urgently needed. The activation of opioid receptors in peripheral inflamed tissue can reduce pain without central adverse effects such as sedation, apnoea, or addiction. Here, we use an unprecedented strategy and report the synthesis and analgesic efficacy of the standard opioid morphine covalently attached to hyperbranched polyglycerol (PG-M) by a cleavable linker. With its high-molecular weight and hydrophilicity, this conjugate is designed to selectively release morphine in injured tissue and to prevent blood-brain barrier permeation. In contrast to conventional morphine, intravenous PG-M exclusively activated peripheral opioid receptors to produce analgesia in inflamed rat paws without major side effects such as sedation or constipation. Concentrations of morphine in the brain, blood, paw tissue, and in vitro confirmed the selective release of morphine in the inflamed milieu. Thus, PG-M may serve as prototype of a peripherally restricted opioid formulation designed to forego central and intestinal side effects.

Keywords: inflammation; nanocarrier; neuroscience; opioid; pain; polymer; rat.


Conflict of interest statement

The authors declare that no competing interests exist.

Figures

Figure 1.
Figure 1.. Structures of morphine (1) and PG-M (2).
DOI: http://dx.doi.org/10.7554/eLife.27081.002
Figure 2.
Figure 2.. UV-visible spectrum of dialyzed PG-M showing the characteristic signal of morphine at 285 nm indicating the presence of the morphine molecule in its active form within the conjugate structure.
Amounts of morphine in all chemical experiments were calculated based on UV-visible quantification using a calibration curve generated from free morphine. The UV spectrum for each sample was acquired using 30 scans per sample for maximized S/N ratio, and represents N = 3 experimental replicates. DOI: http://dx.doi.org/10.7554/eLife.27081.003
Figure 3.
Figure 3.. 1H nuclear magnetic resonance (NMR) spectroscopy of purified PG-M showing resonance signals from morphine along with those from the PG scaffold, indicating successful conjugation of the small molecule morphine on hyperbranched PG.
PG-M was purified by dialysis and size exclusion chromatography. NMR of the lyophilized product shows signals from aromatic protons of morphine from 5.1 to 6.6 ppm. Further protons from the conjugate molecule are also assigned to the spectrum. There was no evidence for the presence of free morphine salt or any other small molecular impurities in the sample. The spectral acquisition is a result of N = 32 scans to optimize S/N ratio, and the representative spectrum is obtained from N = 3 experiments. DOI: http://dx.doi.org/10.7554/eLife.27081.004
Figure 4.
Figure 4.. Thin-layer chromatography (TLC) of PG-M showing retention of morphine (M) at baseline on normal-phase silica plate (lane 3), and no evidence of non-covalently entrapped morphine within the conjugate, as indicated by positive Dragendorf and Ninhydrin test.
Representative chromatograph obtained from N = 3 experiments. DOI: http://dx.doi.org/10.7554/eLife.27081.005
Figure 5.
Figure 5.. Gel permeation chromatogram (GPC) of morphine and PG-M.
Left: GPC of PG-M using water as eluent shows the monodispersed signal of the pure conjugate with a PDI of 1.12 at a flow rate of 1 ml/min (N = 3 experimental replicates). The average molecular weight of PG-M was 21.4 kDa. This permits low-molecular-weight fractions, originating most likely from the conjugation of morphine (M) to low-molecular-weight PG remaining from the initial anionic polymerization process for the synthesis of the hyperbranched scaffold. Due to the statistical nature of molecular weight distribution of hyperbranched polymers, it was not possible to obtain a monomodal MALDI signal of PG or PG-M. The bottom excerpt shows zoom into PG-M peak. Right: GPC of M-salt (top) and PG-M (bottom), incubated in buffer without enzymes. Measurements were performed using BioSil SEC250 columns (Biorad) with a mobile phase flow rate of 1 ml/min under isocratic elution. An injection volume of 50 μl (of either M-salt or PG-M) was used in a mobile phase composed of 10% acetonitrile, 90% 10 mM sodium phosphate buffer, 0.15 M NaCl, pH 7.0, and detection at 285 nm. Free unmodified M (dimeric morphine sulfate) starts eluting between 20 and 22 min (top), while PG-M begins eluting at 14 min and does not yield free M (bottom). The second peak following the major PG-M signal derives from lower molecular weight conjugates of PG-M (bottom). DOI: http://dx.doi.org/10.7554/eLife.27081.006
Figure 6.
Figure 6.. Analgesic effects after intraplantar (i.pl.) injection of morphine or PG-M in rats with unilateral hindpaw inflammation.
Effects on mechanical pain thresholds (PPT) in inflamed (a, b) and noninflamed (c, d) hindpaws following unilateral i.pl. injections of morphine (MOR; a, c, e) or PG-M (b, d, f) into the inflamed paw. Dosages of MOR and PG-M represent the absolute amounts of morphine-free base (see Table 1). Unilateral i.pl. injection of NLXM (50 μg/paw) completely reversed peak PPT elevations occurring at 5 min after i.pl. morphine (100 μg; e) or i.pl. PG-M (equivalent to 100 μg morphine; f). BL: baseline PPT before injections. (a, b, c) *p<0.05, two-way RM-ANOVA and Bonferroni test (compared to controls). (e, f) *p<0.05, paired t-test (BL vs. agonist); #p<0.05, unpaired t-test (agonist vs. agonist + NLXM). N = 8 rats per group; means ± SEM. PPT increases in a and b (0–100 μg) were dose-dependent (p<0.05, linear regression ANOVA). DOI: http://dx.doi.org/10.7554/eLife.27081.008
Figure 7.
Figure 7.. Analgesic effects after intravenous (i.v.) morphine or PG-M in rats with unilateral hindpaw inflammation.
Effects on mechanical pain thresholds (PPT) in inflamed (a, b) and noninflamed (c, d) hindpaws following i.v. injections of morphine (MOR; a, c, e) or PG-M (b, d, f). Dosages of MOR and PG-M represent the absolute amounts of morphine free base (see Table 1). Bilateral intraplantar (i.pl.) injection of NLXM (50 μg/paw) partially reduced peak PPT elevations occurring at 15 min after MOR (6 mg/kg; e) and completely abolished effects after PG-M (equivalent to 6 mg/kg morphine; f). (a, b, c) *p<0.05, two-way RM-ANOVA and Bonferroni test (compared to controls). (e, f) *p<0.05, paired t-test (BL vs. agonist without/with NLXM); #p<0.05, unpaired t-test (agonist vs. agonist with NLXM). N = 8 rats per group; means ± SEM. PPT increases in a, c (0–12 mg/kg) and b (0–6 mg/kg) were dose-dependent (p<0.05, linear regression ANOVA). DOI: http://dx.doi.org/10.7554/eLife.27081.010
Figure 8.
Figure 8.. Effects of intravenous (i.v.) morphine or PG-M on locomotor activity and defecation in rats with unilateral hindpaw inflammation.
(a) Locomotor activity after i.v. injections of morphine (MOR), PG-M or 0.9% NaCl. *p<0.05, two-way RM-ANOVA and Bonferroni test (compared to MOR); N = 8 rats per group; means ± SEM. (b) Number (left) and total weight (right) of fecal boli produced after i.v. injections of MOR, PG-M or 0.9% NaCl. Dosages of MOR and PG-M represent the same absolute amounts of morphine-free base (12 mg/kg; see Table 1). ND: none detected; *p<0.05, one-way ANOVA and Bonferroni test (compared to MOR); N = 8 rats per group; means ± SEM. DOI: http://dx.doi.org/10.7554/eLife.27081.014
Figure 9.
Figure 9.. Concentrations of free morphine in paw microdialysates, blood, and brain.
Concentrations in paw microdialysates after intraplantar (i.pl.; 100 μg morphine free base equivalent; N = 7) or intravenous (i.v.; 6 mg/kg morphine free base equivalent; N = 7) administration (at time 0) of morphine (MOR) (a) or PG-M (b). Blood and brain concentrations after i.v. injection of morphine (c, N = 8; d, N = 7) or PG-M (e; N = 6 for blood; N = 7 for brain) (6 mg/kg morphine-free base equivalent in both cases). Each sample was divided for duplicate measurements by ELISA. (a, b, c) *p<0.05, one-way RM-ANOVA and Bonferroni tests (compared to corresponding values before injections, that is, at 0 min). (d) *p<0.05, Kruskal-Wallis one-way ANOVA on ranks and Dunn test (compared to values before injection); means ± SEM. DOI: http://dx.doi.org/10.7554/eLife.27081.016
Figure 10.
Figure 10.. Binding of PG-M and morphine to mu-opioid receptors.
Different concentrations of morphine (MOR; circles) or PG-M (squares) were applied to compete with 4 nM [3 hr]-DAMGO binding to mu-opioid receptors stably expressed in HEK 293 cells. The affinity of PG-M was negligible compared to morphine (IC50: 18.7 ± 1.82 µM vs. 0.002 ± 1.37 µM; p<0.001, unpaired t-test); means ± SEM of six independent experiments, each performed in duplicates. DOI: http://dx.doi.org/10.7554/eLife.27081.018
Figure 11.
Figure 11.. Cytotoxicity.
Viability of NIH 3T3 cells determined by MTT assay (a). Differences between morphine and PG-M were not significant (p>0.05,Mann-Whitney U Test). RTCA cytotoxicity profiles of NIH 3T3 cells treated with morphine (b) and PG-M (c). Dosages were calculated to contain the same concentrations of morphine-free base (see captions) in both cases. Neither morphine nor PG-M decreased CI values. DOI: http://dx.doi.org/10.7554/eLife.27081.020
Figure 12.
Figure 12.. Time-dependent in vitro release of morphine from PG-M.
The y-axis indicates percentage of free morphine relative to amount of morphine conjugated in PG-M, examined at 37°C in acidic solution (pH 5.5; triangles) or in the presence of human leukocyte esterase (pH 7.4; squares). DOI: http://dx.doi.org/10.7554/eLife.27081.021

Similar articles

Cited by

References

    1. Antunes bras J, Becker C, Bourgoin S, Lombard M, Cesselin F, Hamon M, Pohl M. Met-enkephalin is preferentially transported into the peripheral processes of primary afferent fibres in both control and HSV1-driven proenkephalin A overexpressing rats. Neuroscience. 2001;103:1073–1083. doi: 10.1016/S0306-4522(01)00034-3. - DOI - PubMed
    1. Arfè A, Scotti L, Varas-Lorenzo C, Nicotra F, Zambon A, Kollhorst B, Schink T, Garbe E, Herings R, Straatman H, Schade R, Villa M, Lucchi S, Valkhoff V, Romio S, Thiessard F, Schuemie M, Pariente A, Sturkenboom M, Corrao G, Safety of Non-steroidal Anti-inflammatory Drugs (SOS) Project Consortium Non-steroidal anti-inflammatory drugs and risk of heart failure in four European countries: nested case-control study. BMJ. 2016;354:i4857. doi: 10.1136/bmj.i4857. - DOI - PubMed
    1. Azzopardi EA, Ferguson EL, Thomas DW. The enhanced permeability retention effect: a new paradigm for drug targeting in infection. The Journal of Antimicrobial Chemotherapy. 2013;68:257–274. doi: 10.1093/jac/dks379. - DOI - PubMed
    1. Bajic D, Soiza-Reilly M, Spalding AL, Berde CB, Commons KG. Endogenous cholinergic neurotransmission contributes to behavioral sensitization to morphine. PLoS One. 2015;10:e0117601. doi: 10.1371/journal.pone.0117601. - DOI - PMC - PubMed
    1. Baker M, Carr F. Pre-clinical considerations in the assessment of immunogenicity for protein therapeutics. Current Drug Safety. 2010;5:308–313. doi: 10.2174/157488610792246000. - DOI - PubMed

Publication types

LinkOut - more resources