. 2017 Jul 6;67(1):148-161.e5.
doi: 10.1016/j.molcel.2017.06.003. Epub 2017 Jun 29.

Single-Cell Alternative Splicing Analysis with Expedition Reveals Splicing Dynamics during Neuron Differentiation

Affiliations

Single-Cell Alternative Splicing Analysis with Expedition Reveals Splicing Dynamics during Neuron Differentiation

Yan Song et al. Mol Cell. .

Abstract

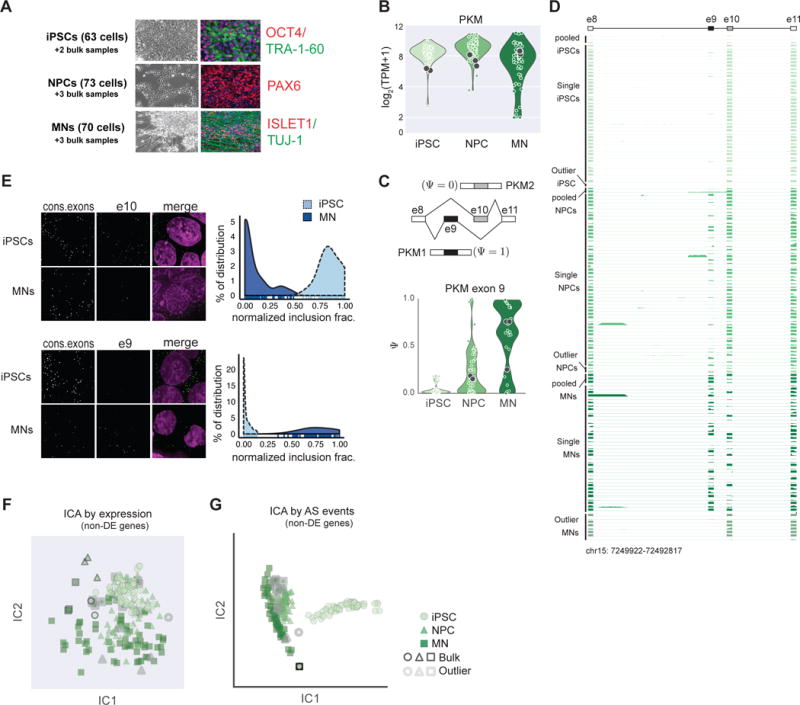
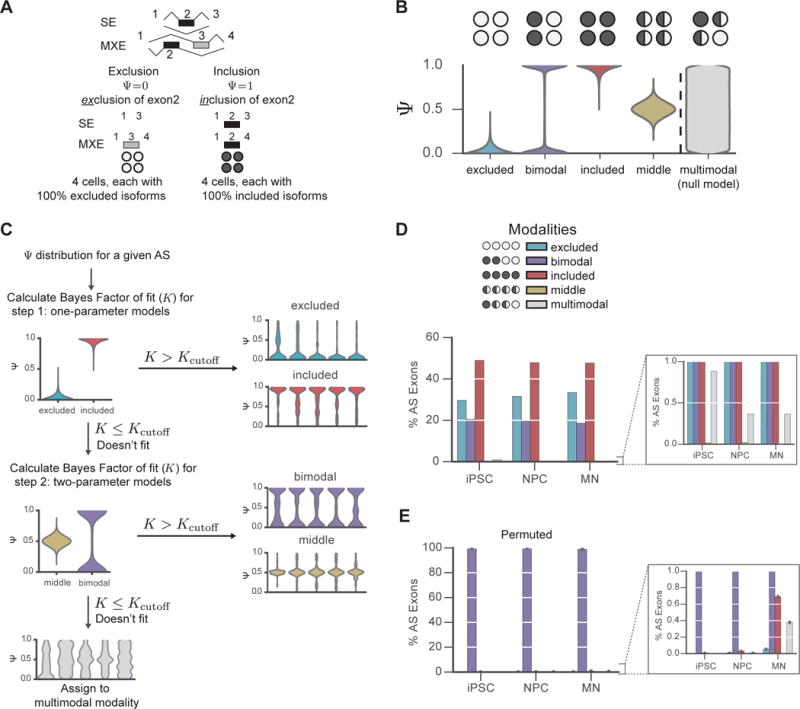
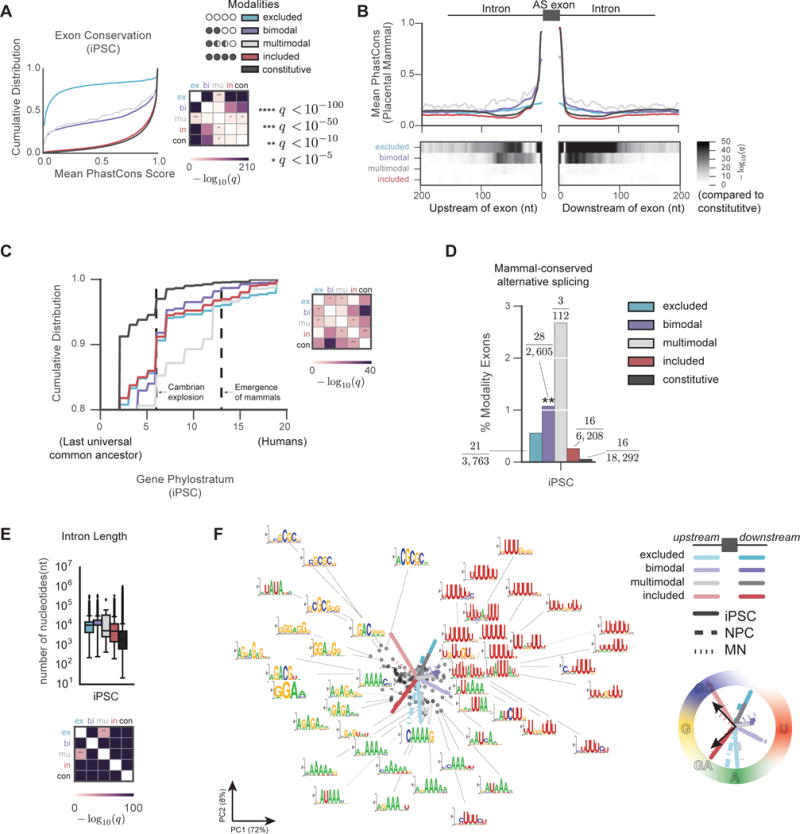
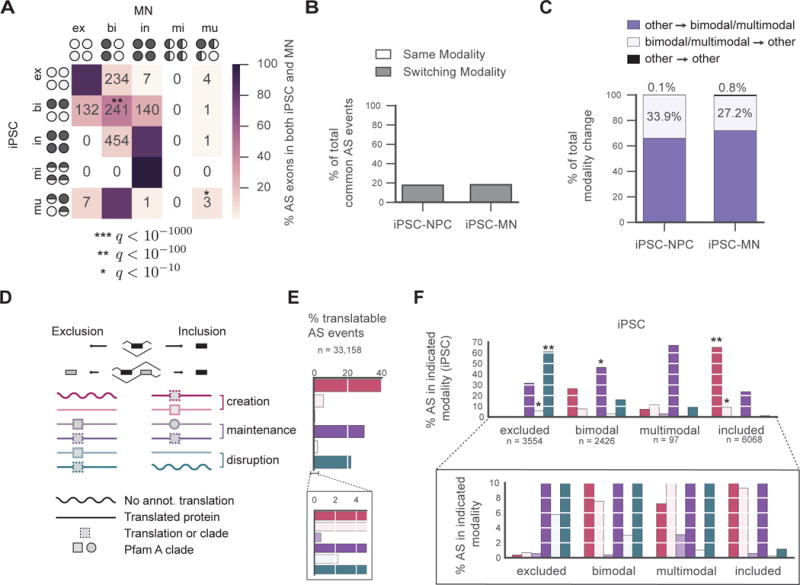
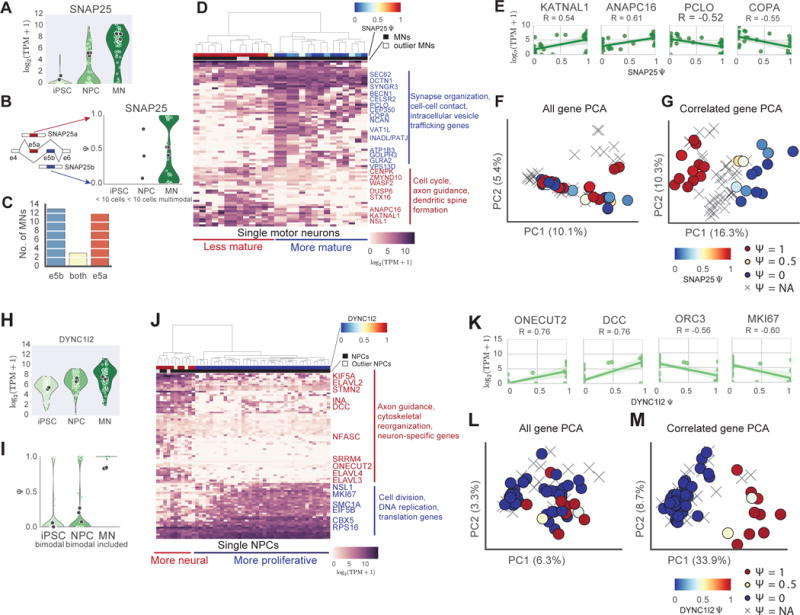
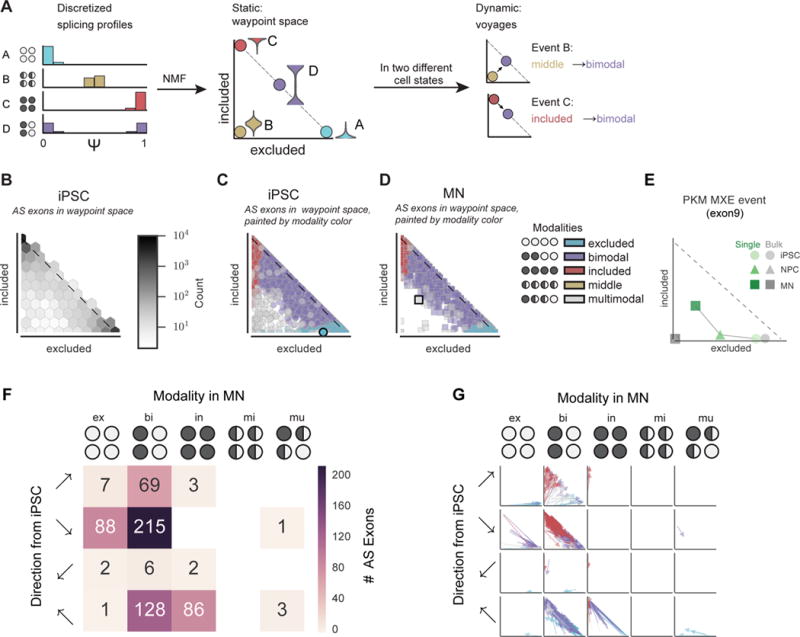
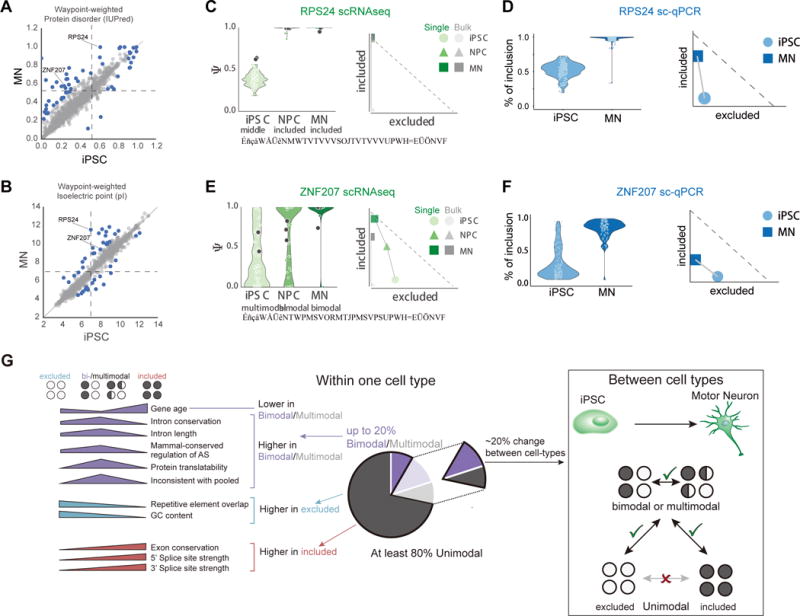
Alternative splicing (AS) generates isoform diversity for cellular identity and homeostasis in multicellular life. Although AS variation has been observed among single cells, little is known about the biological or evolutionary significance of such variation. We developed Expedition, a computational framework consisting of outrigger, a de novo splice graph transversal algorithm to detect AS; anchor, a Bayesian approach to assign modalities; and bonvoyage, a visualization tool using non-negative matrix factorization to display modality changes. Applying Expedition to single pluripotent stem cells undergoing neuronal differentiation, we discover that up to 20% of AS exons exhibit bimodality. Bimodal exons are flanked by more conserved intronic sequences harboring distinct cis-regulatory motifs, constitute much of cell-type-specific splicing, are highly dynamic during cellular transitions, preserve reading frame, and reveal intricacy of cell states invisible to conventional gene expression analysis. Systematic AS characterization in single cells redefines our understanding of AS complexity in cell biology.

Keywords: RNA processing; alternative splicing; bimodality; differentiation; modality; neuron; post-transcription; single cell; stem cells.


Conflict of interest statement

Competing Financial Interests

The authors declare no competing financial interests.

Figures

Figure 1
Figure 1. Cell-type specific alternative splicing is an independent feature of cell identity
(A) Human iPSCs were directly differentiated into neuron progenitor cells (NPC) or motor neurons (MN) in vitro. Cell identity was verified by immunofluorescence staining. 63 iPSCs, 73 NPCs and 70 MNs passed QC and were retained for splicing analysis. Bulk samples are independent samples of ~1000 cells. (B) Pyruvate kinase M (PKM) is consistently expressed in iPSCs, NPCs and MNs. (C) Differential inclusion of a mutually exclusive exon (MXE) alternative splicing (AS) event in PKM is observed in the three cell-types from scRNA-seq. Top, Schematic of the MXE composed by exon 10 (e10) and exon 9 (e9). Bottom, distribution of Ψ for exon 9 in single cells. Ψ score is estimated by outrigger (see STAR Methods). Each green dot in the violin plots represents one cell. Black dots represent measurements in bulk samples. (D) Coverage track of MXE exons in pyruvate kinase M (PKM) gene. Each row represents a single cell/sample. (E) Preferential inclusion of e10 and e9 in iPSCs and MNs, respectively, were demonstrated in single cells by smRNA-FISH. Probe sets against constitutive exons (green in merge images) and either exon 10 or exon 9 (red in merge images) were designed in PKM gene. Representative smRNA-FISH images are shown for exon 10 (upper) and exon 9 (lower) (left panel). Distribution of normalized exon inclusion is depicted in iPSCs (light blue with dashed outline) and MNs (dark blue with solid outline; right panel). 74 iPSCs and 101 MNs were counted for e10 inclusion; 125 iPSCs and 67 MNs were counted for e9 inclusion. F–G AS profile is an independent feature of cell-types. 12,685 Non-differentially expressed (non-DE) genes were identified by non-parametric Kruskal-Wallis test with Bonferroni-corrected q-values > 1. (F) ICA on gene expression values of non-DE genes fails to distinguish the three cell-types. (G) ICA on Ψ scores of the AS events residing in non-DE genes groups iPSCs, NPCs and MNs independent of gene expression. See also Figure S1.
Figure 2
Figure 2. Assignment of single cell alternative splicing distributions to modalities using anchor algorithm
(A) Schematic of SE and MXE alternative splicing events. “Exclusion isoform” refers to exclusion of alternative exon (exon 2 in SE and exclusion of exon 2 (black) but inclusion of exon 3 (grey) in MXE), and “Inclusion isoform” refers to inclusion of alternative exon (exon 2 in SE and MXE) of alternative exon. Circles illustrate a single cell containing RNA molecules of a given AS event. Light grey represents inclusion isoform and dark grey represents exclusion isoform. (B) A schematic of the proposed five modalities tested by anchor. Distribution of Ψ for each AS event can be modeled as a Beta probability distribution parameterized by a and p. Modality of excluded (Ψ density concentrated around 0), bimodal (Ψ density concentrated towards 0 and 1), included (Ψ density around 1), middle (Ψ density around 0.5) or multimodal (Ψ density spread out uniformly across 0 to 1). The first four modalities are tested by anchor, and the final multimodal modality is the null model. (C) Two-step modality assignment process is utilized by anchor. For the Ψ distribution of a given AS event, the Bayes Factor (K) of fit is first calculated for one-parameter models (only one of α or β is parameterized), including included and excluded modalities. If K > Kcutoff, modality is assigned to the modality with highest K. When Kcutoff is not satisfied, an event will be tested in the 2nd step, in which the Bayes Factor (K) of fit is calculated for two-parameter models (where both α and β are parameterized), indicating bimodal and middle modalities. If an event cannot fit at either step, it will be assigned to multimodal modality. Kcutoff = 25 = 32 for both steps. Five events from each modality assigned by anchor were randomly selected as examples. (D) Composition of AS modalities is similar in iPSCs, NPCs, and MNs. right, zoomed-in panel shows middle and multimodal modality are less than 1% in the three populations. (E) Composition of modalities of permuted splicing data. Ψ scores from all identified AS events in all cells were randomly permuted 1,000 times, then anchor was applied to estimate modalities. Almost 100% of permuted events are assigned as bimodal. Error bars represents 95% confidence interval from 1,000 bootstrapped intervals. right, zoomed-in panel shows low percentage of unimodal events in permuted data. See also Figure S2.
Figure 3
Figure 3. Bimodal AS events exhibit distinct sequence and evolutionary features
All results are shown for iPSCs with highest number of AS events (12,690). All q-values of significance were derived from multiple hypothesis corrected (Bonferroni) non-parametric Mann-Whitney U test, unless otherwise indicated. (A) Left, Cumulative distributions of the mean Placental Mammal PhastCons score in each modality, together with constitutive exons as comparison. AS exons from included modality (red) are as conserved as constitutive exons (black), while excluded exons (blue) are least conserved, followed by bimodal (purple) and multimodal (grey) exons. Right, heatmap of pairwise significance scores between each modality or constitutive exons. (B) Mean Placental Mammal PhastCons scores of flanking introns of AS exons in excluded (blue), bimodal (purple), multimodal (grey), included (red) modalities, and constitutive (black) exons in all cell-types. Bottom, nucleotide-level significance of PhastCons scores is presented 0 < −log10(q) ≤ 50 for clarity. (C) Phylostratum scores are summarized for genes harboring AS events in each modality together with genes containing constitutive exons. Right, pairwise significance scores. (D) Mammal-conserved AS exons and their percentage in each modality. Hypergeometric test (multiple hypothesis corrected with Bonferroni) indicated q < 10−5 statistical significance. Fraction indicates number of conserved AS exons divided by the total AS exons in modality. (E) Intron lengths in excluded, bimodal, multimodal and included modalities, with constitutive exons as comparison. Bottom, pairwise significance scores. (F) Conserved intronic sequences in each modality are enriched with distinct nucleotides. Motifs enriched for each modality are presented by PCA, with each circle as a motif and the vectors as component loadings of intronic groups. Left, motifs are annotated with motif sequences. Right, A simplified illustration of nucleotide enrichment in each modality. See also Figure S3.
Figure 4
Figure 4. Dynamic AS events are highly variant bimodal and multimodal events
(A) AS events change modalities during the transition from iPSCs to MNs, presented as events in iPSCs (y-axis) against their corresponding modalities in MNs (x-axis). Heat map represents the % of overlapping events in the iPSCs and MNs, annotated with the exact number of events. Notably, 88% of excluded events in iPSCs remained in the excluded modality, and 86% of included events in iPSCs remained as included in MNs. In contrast, 52% of bimodal events in iPSCs switch to either included or excluded modalities in MNs. Multiple hypothesis corrected (Bonferroni) hypergeometric tests were used to determine significance. (B) During the differentiation from iPSCs to MNs or from iPSCs to NPCs, we found that 1,586 (17.6%) or 1,029 (18.0%) AS events switched modality, respectively. (C) Within the switching events, 99% of AS events either switched from a bimodal/multimodal state or switched towards a bimodal/multimodal state. Less than 1% of switching events were among other types of modality changes. D–F AS events in bimodal modality exhibit flexibility in protein coding. (D) Schematic of predicted protein coding changes associated with AS exon inclusion. Pink highlights creation of translated proteins or protein domain clades when AS exon is included. Purple represents maintenance of protein clades with or without change of domain clades. Blue represents loss of domain clades or disruption of translation when AS exons are included. The square and circle illustrate different Pfam domain clades. The square with dashed outlines represents translated protein, which may contain a Pfam domain. (E) The coding outcomes are summarized in the six categories based on all AS events. The percentage of each translation configuration is used as the background distribution for significance calculations in (F). (F) AS events in bimodal modality are enriched for maintaining reading frame and presence of domain. The dominant isoforms in included and excluded modalities favor protein or domain creation and switching to the other isoform results in disruption of reading frame. Enrichment is calculated against population average as shown in (E) in each category using multiple hypothesis corrected hypergeometric tests. *: q< 10−10 **: q< 10−10 See also Figure S4.
Figure 5
Figure 5. Bimodal and multimodal AS events reveal subpopulations invisible by conventional gene expression analysis
A–G SNAP25 AS reveals a more mature subpopulation in motor neuron population. (A) SNAP25 is primarily expressed in MNs. (B) Inclusion of exon 5a in SNAP25 in the three populations. (C) Number of cells that contain primarily exon 5a or 5b (or both) in motor neurons. (D) Preferential usage of exon 5a or exon 5b of SNAP25 in MNs reveals intricate cell states. Genes correlated with the Ψ score of this MXE clustered MNs into two main subgroups, Ψ~1 (red in the legend bar) and Ψ~0 (blue in the legend bar). Rows represent the genes and columns represent single cells. Cells with Ψ around 0.5 are illustrated by yellow in the legend bar. Black and light grey indicate qualified and outlier MNs based on k-means clustering, respectively. Gradient of purple indicates gene expression in log2(TPM+1), with darker being highly expressed. A few representative genes from the two subgroups are highlighted in red or blue. (E) Examples of representative genes that correlate with Ψ of exon 5a of SNAP25. KATNAL1 and ANAPC16 are more enriched in the cells with Ψ ~1. DCTN1 and PCLO are more enriched in the cells with Ψ ~0. X-axis represents the Ψ score, and y-axis represent gene expression in log2(TPM+1). Each MN is depicted as a green circle. Solid green line represents linear regression between Ψ and the expression of indicated genes. Shaded green represents 95% confidence interval of the regression. F–G Genes that correlate with exon 5a of SNAP25 distinguish MNs into two subgroups. Each MN is depicted as a dot in PCA. Red: cells with Ψ ~1; blue: Ψ ~0; yellow: Ψ ~0.5; X: cells with a Ψ assigned as NA. (F) PCA of all expressed genes in MNs failed to separate the two subgroups. (G) Using only the genes correlated with Ψ of exon 5a in SNAP25, two subgroups are readily separated. Percent of variance explained are indicated at each PC. H–M A bimodal SE event in DYNC1I2 separates NPCs into a more proliferative subgroup and a subgroup on the trajectory of neuronal differentiation. (H) Gene expression of DYNC112. (I) Ψ distribution of a SE event in DYNC1I2. This event is bimodal in both iPSCs, NPCs and becomes included in MNs. (J) Genes that correlate with Ψ of the SE event in DYNC1I2 cluster the NPCs into two subgroups. Green: NPC. Blue: cells with Ψ around 0. Red: cells with Ψ around 1. Light blue to yellow: cells with Ψ around 0.5. Black and grey: cells designated as qualified cells versus outlier-cells based on k-means clustering. Representative genes enriched in the two subgroups are highlighted in blue or red. (K) Example genes enriched in the two subgroups of NPCs. Ψ scores of the SE in DYNC1I2 is on x-axis and expression of indicated genes is on y-axis. L–M Only genes that correlate with Ψ separate two subgroups in NPCs, with each NPC depicted as a dot in the PCA. Blue: cells with Ψ ~0; Red: cells with Ψ ~1; yellow: Ψ ~0.5; X: cells with a Ψ assigned as NA. (L) PCA of all genes expressed in NPCs failed to separate the two subgroups. (M) Genes that correlate with Ψ separate the two subgroups by PCA. See also Figure S5.
Figure 6
Figure 6. Bonvoyage visualizes dynamic AS changes
(A) A schematic to illustrate the transformation of splicing profiles into the two-dimensional waypoint space by bonvoyage. Splicing distribution of each event (A, B, C and D represent 4 different AS events) was discretized into bins (left), factorized by NMF and projected onto a 2-dimensional space (middle), such that each data point summarizes a distribution of AS. The origin represents a distribution that all cells contain 50% inclusion and 50% exclusion isoforms. When the distributions of the same event (either event B or C) are visualized in two different cell-types or states, the change in the event is illustrated by its voyage in the waypoint space (right panel). (B) AS events in iPSCs projected in the waypoint space. The shade of hexagon indicates the number of events. (C) AS events in iPSCs (same as in B), colored by the modality estimated by anchor. Each dot represents the distribution of one AS event. Note, each modality occupies a distinct region of the waypoint space. Black-outlined circle highlights PKM MXE event. (D) AS events in MNs are colored by their modalities and presented in waypoint space. Black-outlined square highlights PKM MXE event. (E) Dynamics of the MXE event in PKM is illustrated in the waypoint space. Shown is the inclusion of exon 9 of PKM, which is included in both iPSCs and NPCs and becomes bimodal in MNs. Greys represent Ψ measurements in bulk samples. F–G Global splicing dynamics between iPSCs and MNs are shown and categorized by voyage direction instead of modalities. Only the events with voyage distance ≥ 0.2 are shown for clarity (Figure S6G). (F) Number of AS events in iPSCs that transitioned to (as indicated by the directionality of the arrows) excluded, bimodal, included, middle, or multimodal modality in MNs. (G) Same data as in (F), visualized by vectors representing the iPSC (tail) and MN (tip) position of the alternative exon. Colors of arrows reflect the event modalities in iPSCs. See also Figure S6.
Figure 7
Figure 7. Single-cell qRT-PCR validation and summary of biological findings
A–B. Waypoint-weighted protein properties that change between iPSCs and MNs. Significant changes (in blue) are identified by a factor of three on Mahalanobis distance relative to all iPSC-MN comparisons. X- and y-axis labels refer to, weighted protein property in iPSC and in MN, respectively. (A) Protein disorder, where a score above 0.5 by IUPred (black dashed line) indicates disorder. (B) Isoelectric point (pl), where the black dashed line indicates pI=7. C–F. Distribution of AS inclusion is verified by single cell qRT-PCR (sc-qPCR). See also Figure S7. (C) Percent spliced-in (Ψ) distributions for RPS24 exon 5 measured by scRNA-seq. (D) Percent exon inclusion distributions for RPS24 exon 5 measured by sc-qPCR. (E) Percent spliced-in (Ψ) distributions for ZNF207 exon 9 measured by scRNA-seq. (F) Percent exon inclusion distributions for ZNF207 exon 9 measured by sc-qPCR. (G) Summary: At single cell resolution, three main categories of modalities can be identified: included, excluded and bimodal. Each modality has unique sequence, coding and evolutionary features. During cell differentiation, majority of unimodal events are static, whereas the highly variance events are dynamic, playing a key role in shaping transcriptome.

References

    1. Anders S, Reyes A, Huber W. Detecting differential usage of exons from RNA-seq data. Genome research. 2012;22:2008–2017. - PMC - PubMed
    1. Barash Y, Blencowe BJ, Frey BJ. Model-based detection of alternative splicing signals. Bioinformatics. 2010;26:i325–333. - PMC - PubMed
    1. Barbosa-Morais NL, Irimia M, Pan Q, Xiong HY, Gueroussov S, Lee LJ, Slobodeniuc V, Kutter C, Watt S, Colak R, et al. The evolutionary landscape of alternative splicing in vertebrate species. Science. 2012;338:1587–1593. - PubMed
    1. Bateman A, Coin L, Durbin R, Finn RD, Hollich V, Griffiths-Jones S, Khanna A, Marshall M, Moxon S, Sonnhammer EL, et al. The Pfam protein families database. Nucleic acids research. 2004;32:D138–141. - PMC - PubMed
    1. Buenrostro JD, Wu B, Litzenburger UM, Ruff D, Gonzales ML, Snyder MP, Chang HY, Greenleaf WJ. Single-cell chromatin accessibility reveals principles of regulatory variation. Nature. 2015;523:486–490. - PMC - PubMed

MeSH terms