. 2017 Jul 6;67(1):5-18.e19.
doi: 10.1016/j.molcel.2017.06.004. Epub 2017 Jun 29.

BET Bromodomain Proteins Function as Master Transcription Elongation Factors Independent of CDK9 Recruitment

Affiliations

BET Bromodomain Proteins Function as Master Transcription Elongation Factors Independent of CDK9 Recruitment

Georg E Winter et al. Mol Cell. .

Abstract

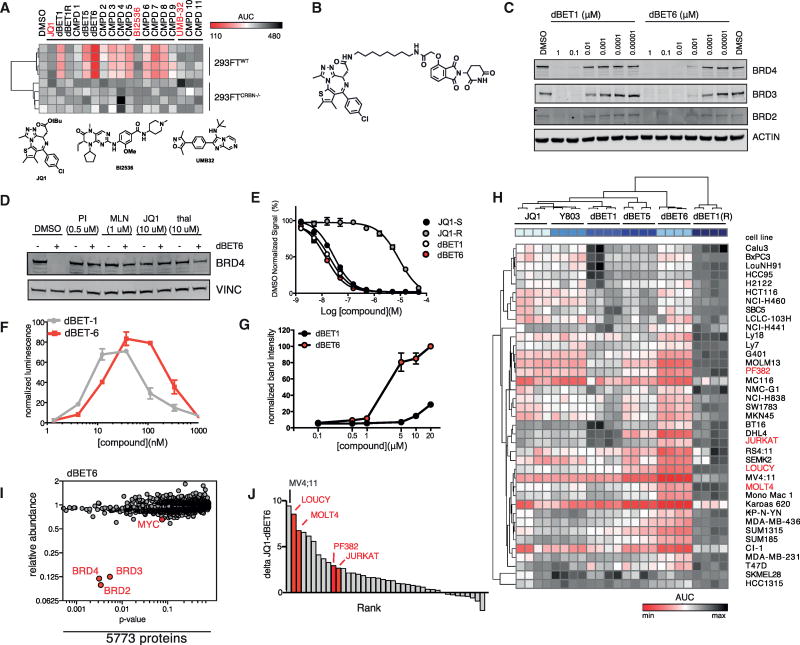
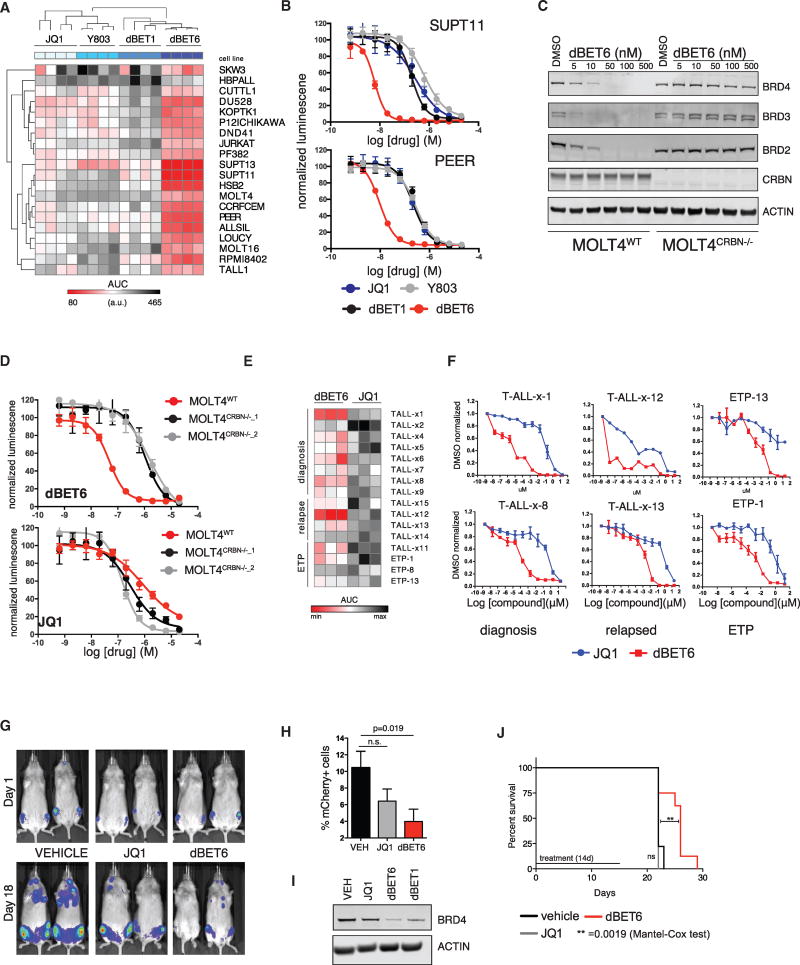
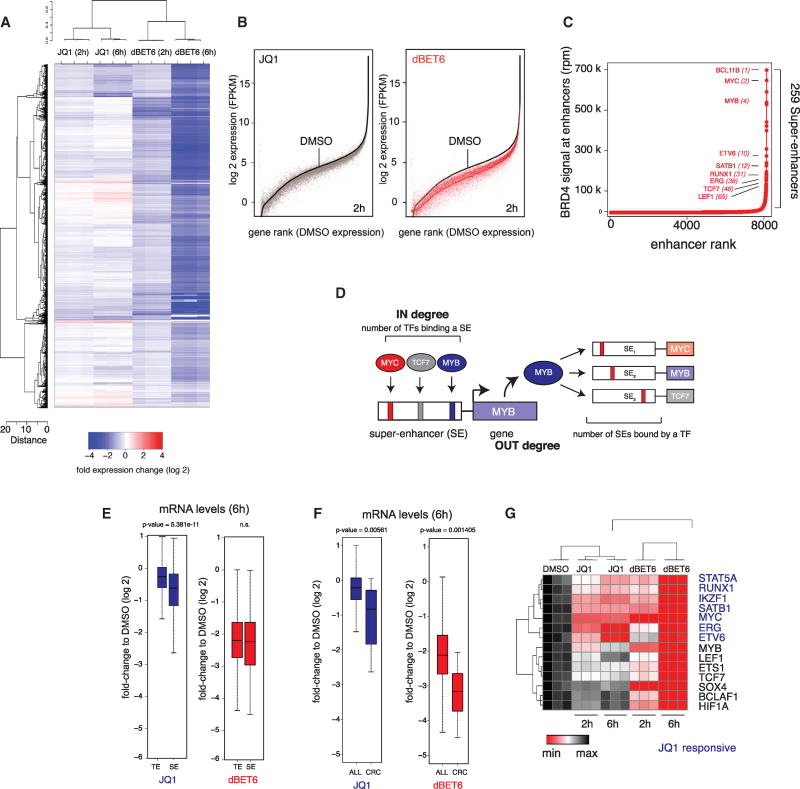
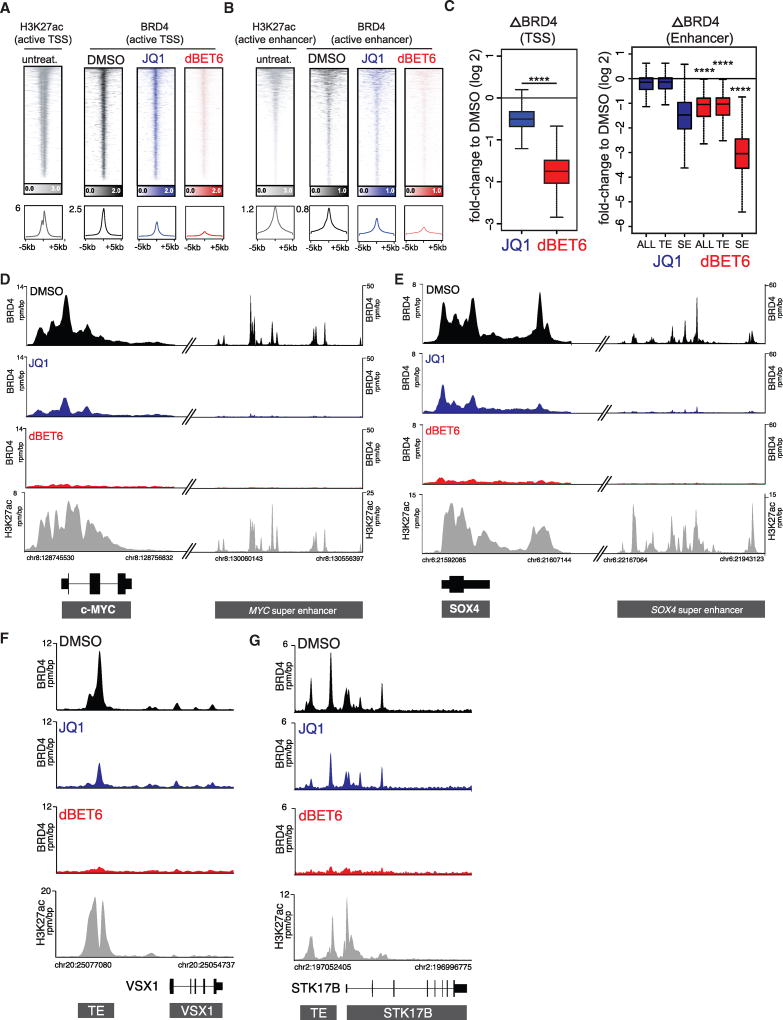
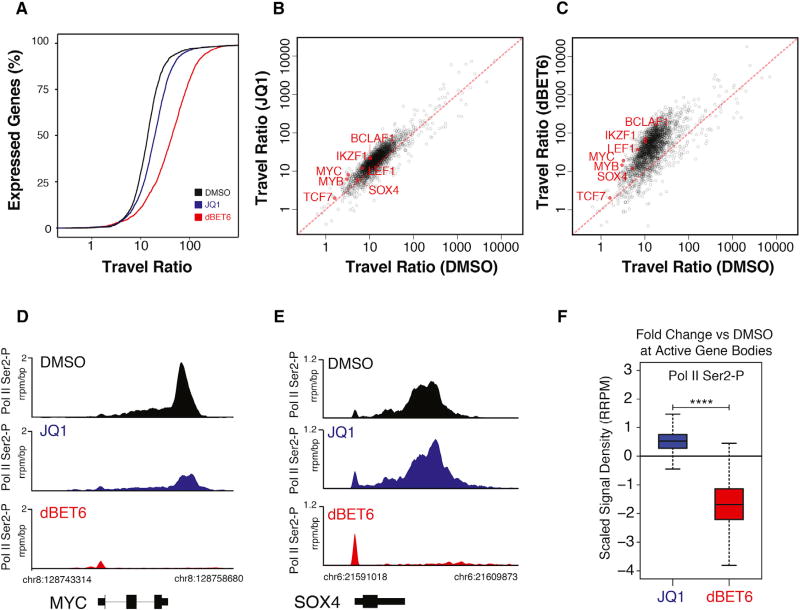
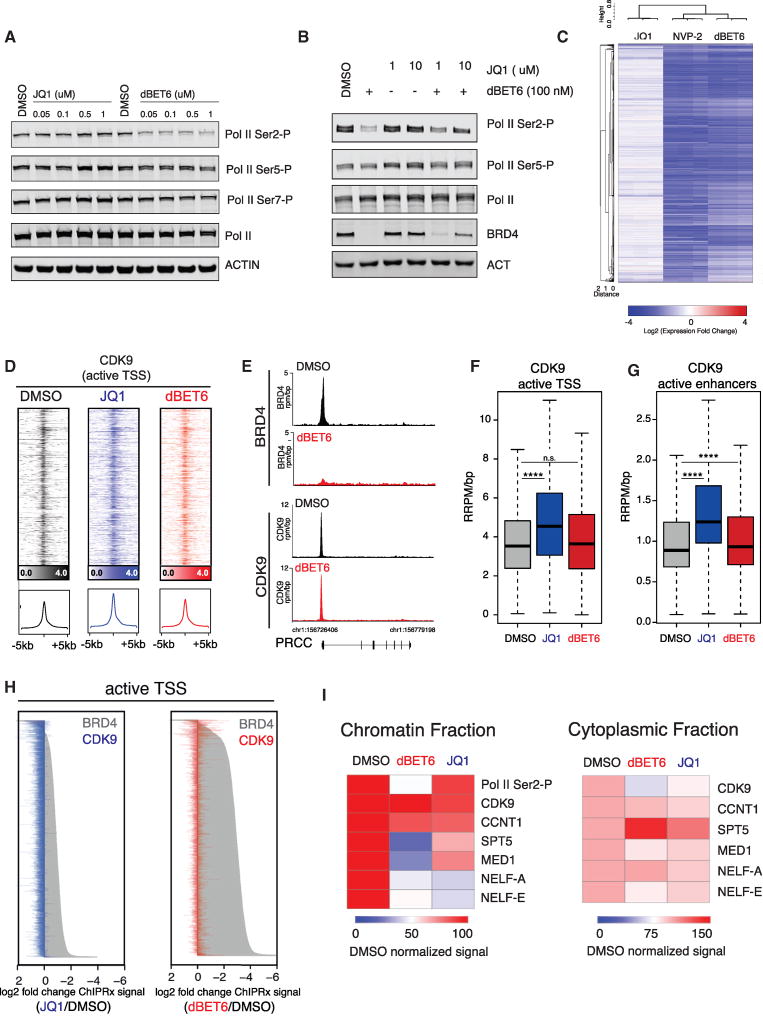
Processive elongation of RNA Polymerase II from a proximal promoter paused state is a rate-limiting event in human gene control. A small number of regulatory factors influence transcription elongation on a global scale. Prior research using small-molecule BET bromodomain inhibitors, such as JQ1, linked BRD4 to context-specific elongation at a limited number of genes associated with massive enhancer regions. Here, the mechanistic characterization of an optimized chemical degrader of BET bromodomain proteins, dBET6, led to the unexpected identification of BET proteins as master regulators of global transcription elongation. In contrast to the selective effect of bromodomain inhibition on transcription, BET degradation prompts a collapse of global elongation that phenocopies CDK9 inhibition. Notably, BRD4 loss does not directly affect CDK9 localization. These studies, performed in translational models of T cell leukemia, establish a mechanism-based rationale for the development of BET bromodomain degradation as cancer therapy.

Keywords: BRD4; CRBN; P-TEFb; RNA polymerase II; T-ALL; core regulatory circuitry; targeted degradation; transcription elongation.


Figures

Figure 1
Figure 1. Identification and Characterization of dBET6 as a Second-Generation BET Degrader
(A) Heatmap of BRD4-nluc fusion protein levels normalized to fluc control levels in either 293FTWT or 293FTCRBN−/− cells. Results of 10-point dose-response experiment (n = 4) after 4 hr of drug incubation are summarized as AUC (area under the curve). (B) Chemical structure of dBET6. (C) Immunoblot for BRD2, BRD3, BRD4, and Actin following 3 hr drug incubation. (D) Chemical competition experiments. Immunoblot for BRD4 and Actin after 3 hr incubation of MV4;11 cells with 50 nM of dBET6 and co-incubation with carfilzomib (500 nM), MLN4924 (1 µM), JQ1 (10 µM), or thalidomide (10 µM). (E) Vehicle-normalized BRD4 (BD1) displacement by AlphaScreen (means ± SD, triplicate analysis). (F) dBET1-induced ternary complex formation of recombinant BRD4(1) and CRBN-DDB1 by AlphaScreen (means ± SD, triplicate analysis, normalized to DMSO). (G) Isothermal dose-response fingerprint (CETSA) in intact MOLT4CRBN−/− cells for BRD4 at 47.5°C. Experiment was performed after 3 hr drug incubation (means ± SE, duplicate analysis). (H) Heatmap of drug consequence on cellular viability as approximated by ATP luminescence measurement using CellTiter-Glo assay. Results of 10-point dose-response experiment (n = 4) after 72 hr drug incubation are summarized as AUC. (I) Quantification of 5,774 proteins after treatment of MOLT4 cells with 100 nM dBET6 for 2 hr compared to vehicle (DMSO) treatment. Volcano plot displays fold-change in abundance versus observed p value (t test; n = 3). (J) Rank-ordered predictors distinguishing drug impact of JQ1 and dBET6 as measured in (H). See also Figure S1 and Tables S1, S2, and S3.
Figure 2
Figure 2. dBET6 Efficacy and CRBN Dependence in T-ALL
(A) Heatmap as in Figure 1H for a panel of T-ALL cell lines. (B) Representative dose response curves from (A). (C) Immunoblot for BRD2, BRD3, BRD4, CRBN, and ACTIN after 3 hr drug treatment of either MOLT4WT or MOLT4CRBN−/− cells. (D) Dose-proportional effect of JQ1 and dBET6 (72 hr) on MOLT4 cellular viability (WT or CRBN−/−) as approximated by ATP-dependent luminescence (means ± SD, n = 4). (E) Heatmap of drug consequence on cellular viability in a comprehensive panel of primary T-ALL patient samples as approximated by ATP luminescence measurement using CellTiter-Glo assay. Results of 10-point dose-response experiment after 72 hr of drug incubation are summarized as AUC (n = 3). (F) Representative dose response curves from (E). (G) Bioluminescent imaging of mice transplanted with 2 × 10⁶ SUPT11 leukemia cells prior to treatment (day 1) or after 18 days of treatment with vehicle control, JQ1 (7.5 mg/kg BID), or dBET6 (7.5 mg/kg BID). (H) Percentage of mCherry+ leukemic cells (means ± SEM) in flushed bone marrow from disseminated SUPT11 xenografts as measured by flow cytometry. (I) Immunoblot analysis of BRD4 and Actin of flushed bone marrow after single treatment with JQ1, dBET6, or dBET1 at concentrations of 7.5 mg/kg. (J) Kaplan-Meier plot of disseminated MOLT4 xenograft experiment treated for 14 days with either vehicle control (n = 9), JQ1 (20 mg/kg QD, n = 9), or dBET6 (7.5 mg/kg BID, n = 8). See also Figure S2 and Tables S4 and S5.
Figure 3
Figure 3. Differential Transcriptional Consequence after BET Inhibition and Degradation
(A) Heatmap of log2 fold changes in gene expression caused by treatment with 1 µM JQ1 or 100 nM dBET6 versus DMSO for 2 and 6 hr. Expression values were normalized to ERCC spike-ins. (B) Expression levels of all genes ranked by their DMSO expression and their matched counterparts after 2 hr treatment with 1 µM JQ1 or 100 nM dBET6. (C) Ranked plots of enhancers defined in MOLT4 T-ALL cells ranked by increasing BRD4 signal (units: rpm). Enhancers are defined as regions of BRD4 ChIP-seq binding not contained in promoters. Selected genes are indicated. (D) Schematic depiction of methodology to infer core transcriptional circuitry from super enhancers. (E) Boxplot quantification of log2 fold changes on (control) genes proximal to typical enhancers (TE) compared to genes proximal to super enhancers (SE) after 6 hr treatment with 1 µM JQ1 or 100 nM dBET6. (F) Boxplot quantification of log2 fold changes on all (control) genes or on core regulatory circuitry genes after treatment as in (E). p values in (E) and (F) result from Welch’s two-tailed t test. (G) Bidirectionally clustered (Pearson) heatmap displaying DMSO-normalized FPKM values of core regulatory circuitry members after treatment as in (A). See also Figure S3.
Figure 4
Figure 4. Quantitative Measurement of Drug Impact on Genome-wide BRD4 Load
(A) Rank ordered heatmap of H3K27ac (gray) and BRD4 levels at transcriptional start sites (TSS) after treatment with 1 µM JQ1 (blue), 100 nM dBET6 (red), or DMSOas vehicle control (black). Each row shows ± 5 kb centered on BRD4 peak. Rows are ordered by max BRD4 in each region (ranking based on DMSO). ChIP-Rx signal (rrpm) is depicted by color-scaled intensities. The ChIP-Rx signal was normalized by spike-in controls. (B) Same as in (A), but for enhancers. (C) Boxplot quantification of differential drug effects on BRD4 binding at transcriptional start sites (TSS), all enhancers (ALL), typical enhancers (TE), and super enhancers (SE). p values result from Welch’s two-tailed t test (p < 2 × 10⁻¹⁶ for all indicated comparisons). (D and E) Gene tracks of ChIP-seq signal for BRD4 after indicated compound treatment and H3K27ac at steady-state conditions at loci (MYC and SOX4 genes) driven by super enhancers. The y axis shows ChIP-seq signal (rpm/bp). The x axis depicts genomic position. (F and G) Same as in (D) and (E), respectively, but exemplifying genes controlled by typical enhancers.
Figure 5
Figure 5. Disruption of Global Transcriptional Elongation by BET Degradation
(A) Distributions of the percent of non-overlapping expressed genes passing selection filters in DMSO condition (n = 2,496; see STAR Methods) with a given traveling ratio. The distributions reflect the average of two biological NET-seq replicate measurements after 2 hr treatment with DMSO, JQ1 (1 µM), or dBET6 (100 nM). (B) Comparison of RNA Pol II traveling ratios between DMSO and JQ1 treatment for genes as in (A). NET-seq reads of biological replicate measurements were combined. (C) Comparison of RNA Pol II traveling ratios between DMSO and dBET6 treatment for genes as in (A). NET-seq reads of biological replicate measurements were combined. (D and E) Individual gene tracks of ChIP-seq signal for RNA Pol II Ser2-P at loci of core regulatory circuitry members MYC (D) and SOX4 (E) after 2 hr treatment with JQ1 (1 µM) and dBET6 (100 nM). The y axis shows ChIP-RX seq signal (rrpm/bp). The x axis depicts genomic position. (F) Boxplot quantification of drug impact on Ser-2 phosphorylated RNA Pol II signal in gene body of all active genes. p value from Welch’s two-tailed t test (p < 2 × 10⁻¹⁶). See also Figure S4.
Figure 6
Figure 6. BET Degradation Attenuates P-TEFb Activity Independent of Recruitment
(A) Immunoblot for Pol II and different CTD phosphorylations (S2, S5, S7) and Actin after treatment of MOLT4 cells for 3 hr with indicated drug concentrations. (B) Immunoblot for RNA Pol II, CTD phosphorylations (Ser2, Ser5), BRD4, and Actin after treatment with dBET6 and/or JQ1 at the indicated concentrations for 4 hr. (C) Heatmap of log2 fold changes in gene expression caused by treatment with 1 µM JQ1, 100 nM dBET6, or 250 nM NVP-2 versus DMSO for 6 hr. Expression values were normalized to ERCC spike-ins. (D) Heatmap of CDK9 levels at TSS after treatment with 1 µM JQ1 (blue), 100 nM dBET6 (red), or DMSO as vehicle control (black). Each row shows ± 5 kb centered on TSS. ChIP-Rx signal (rrpm) is depicted by color-scaled intensities. The ChIP-Rx signal was normalized by spike-in controls. (E) Gene tracks of ChIP-seq signal for CDK9 after indicated compound treatment at the PRCC gene. The y axis shows ChIP-seq signal (rpm/bp). The x axis depicts genomic position. (F) Boxplot quantification of differential drug effects on CDK9 binding at active TSS. p values from Welch’s two-tailed t test (p < 2 × 10⁻¹⁶ for JQ1, p = 0.081 for dBET6). (G) Same as in (F), but for active enhancers. p values from Welch’s two-tailed t test (p < 2 × 10⁻¹⁶ for JQ1, p = 1.3 × 10⁻⁸ for dBET6). (H) Waterfall plot rank-ordered by drug-induced fold changes in BRD4 ChIP-Rx signal at active TSS, overlaid with respective change in CDK9 ChIP-Rx signal of the same locus (2 hr treatment). (I) Heatmap representation of immunoblot signals of elongating Pol II (CTD Ser2-P) and various factors for chromatin and cytoplasmic fraction generated from dBET6 (100 nM) or JQ1 (1 µM) treated MOLT4 cells (2 hr) as well as for the DMSO control. Quantification by ImageJ 1.47v; original immunoblots are shown in Figures S5J and S5K. See also Figure S5 and Table S6.

References

    1. Adelman K, Lis JT. Promoter-proximal pausing of RNA polymerase II: emerging roles in metazoans. Nat. Rev. Genet. 2012;13:720–731. - PMC - PubMed
    1. Anand P, Brown JD, Lin CY, Qi J, Zhang R, Artero PC, Alaiti MA, Bullard J, Alazem K, Margulies KB, et al. BET bromodomains mediate transcriptional pause release in heart failure. Cell. 2013;154:569–582. - PMC - PubMed
    1. Anders L, Guenther MG, Qi J, Fan ZP, Marineau JJ, Rahl PB, Lovén J, Sigova AA, Smith WB, Lee TI, et al. Genome-wide localization of small molecules. Nat. Biotechnol. 2014;32:92–96. - PMC - PubMed
    1. Anders S, Pyl PT, Huber W. HTSeq–a Python framework to work with high-throughput sequencing data. Bioinformatics. 2015;31:166–169. - PMC - PubMed
    1. Baker SC, Bauer SR, Beyer RP, Brenton JD, Bromley B, Burrill J, Causton H, Conley MP, Elespuru R, Fero M, et al. External RNA Controls Consortium. The External RNA Controls Consortium: a progress report. Nat. Methods. 2005;2:731–734. - PubMed

MeSH terms