. 2017 Sep:110:316-331.
doi: 10.1016/j.freeradbiomed.2017.06.022. Epub 2017 Jul 1.

ROS-dependent activation of RhoA/Rho-kinase in pulmonary artery: Role of Src-family kinases and ARHGEF1

Affiliations

ROS-dependent activation of RhoA/Rho-kinase in pulmonary artery: Role of Src-family kinases and ARHGEF1

Charles E MacKay et al. Free Radic Biol Med. 2017 Sep.

Abstract

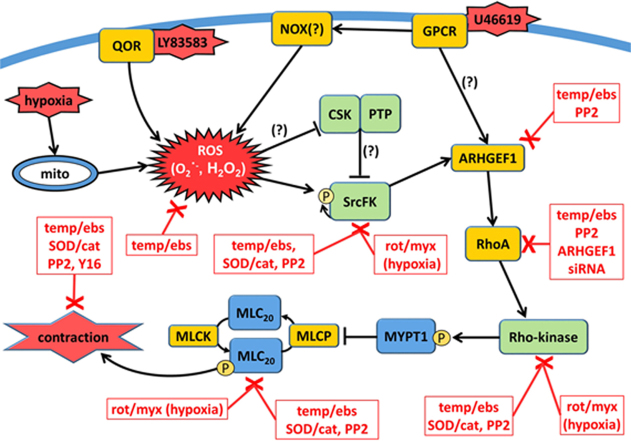
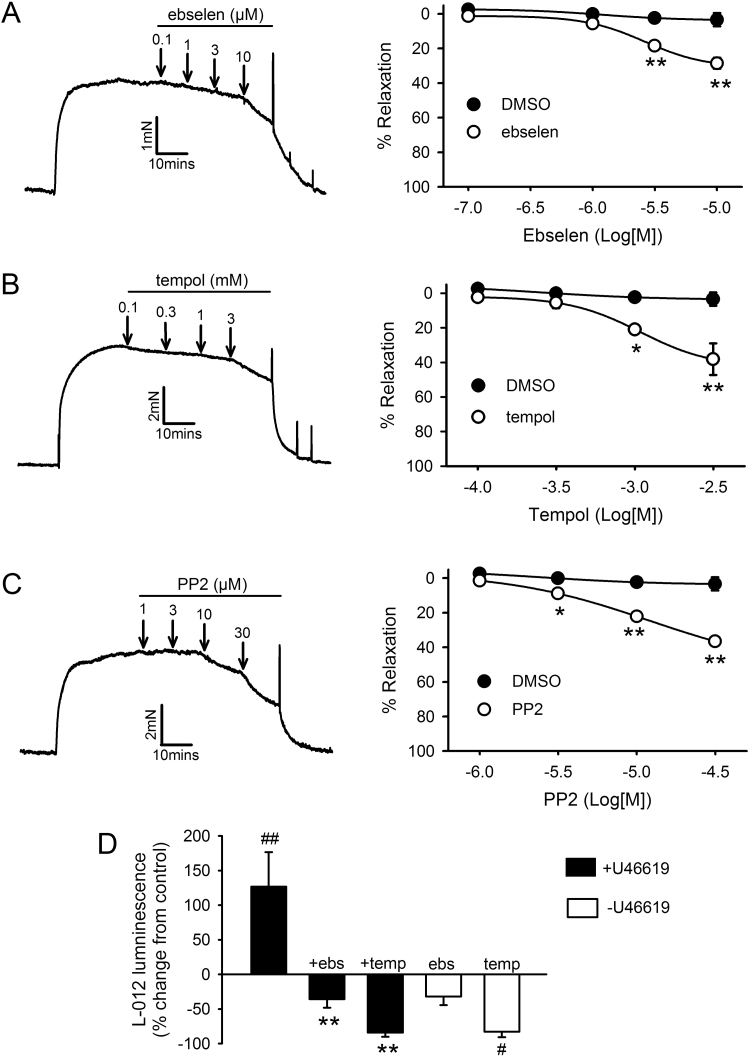
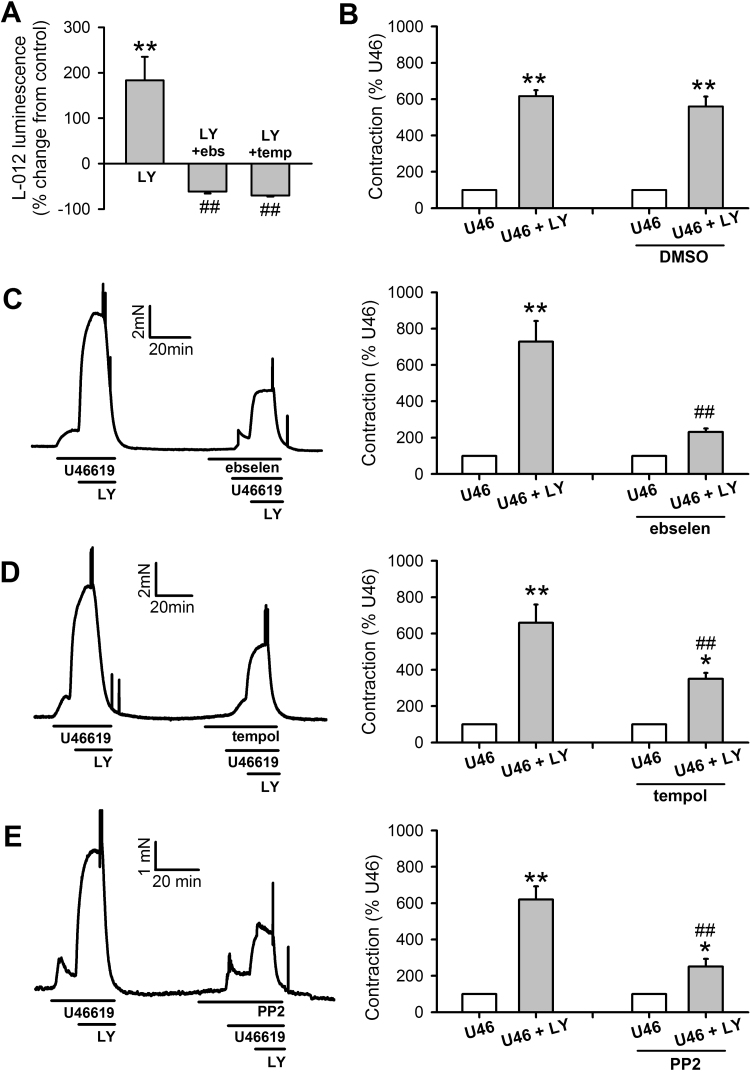
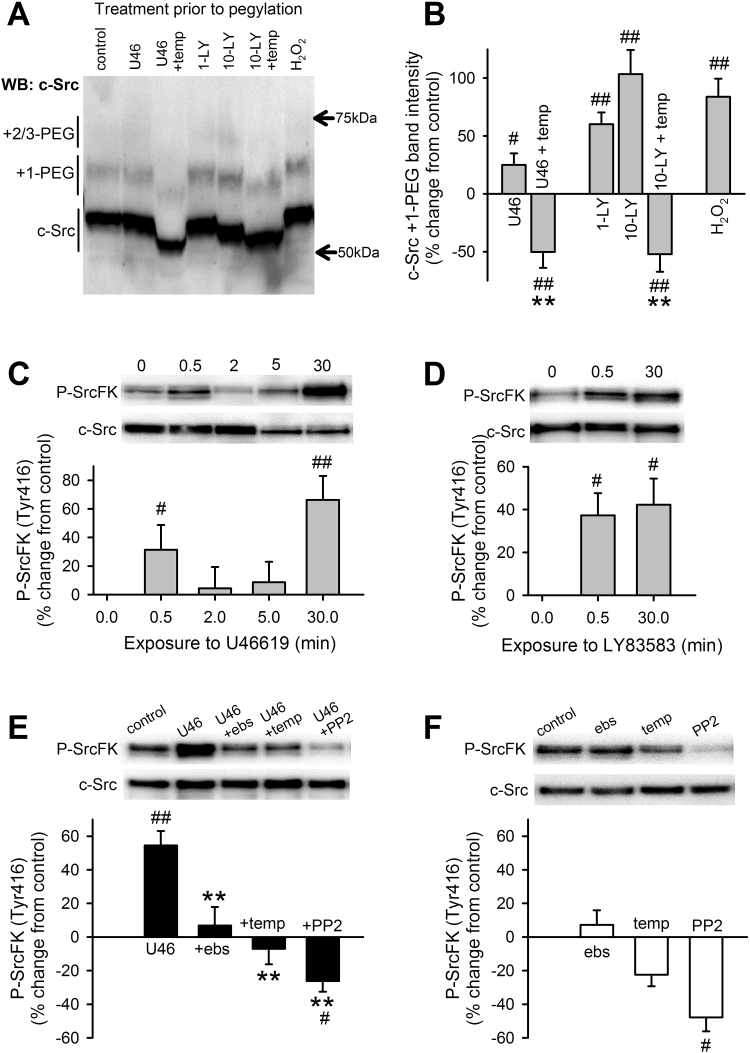
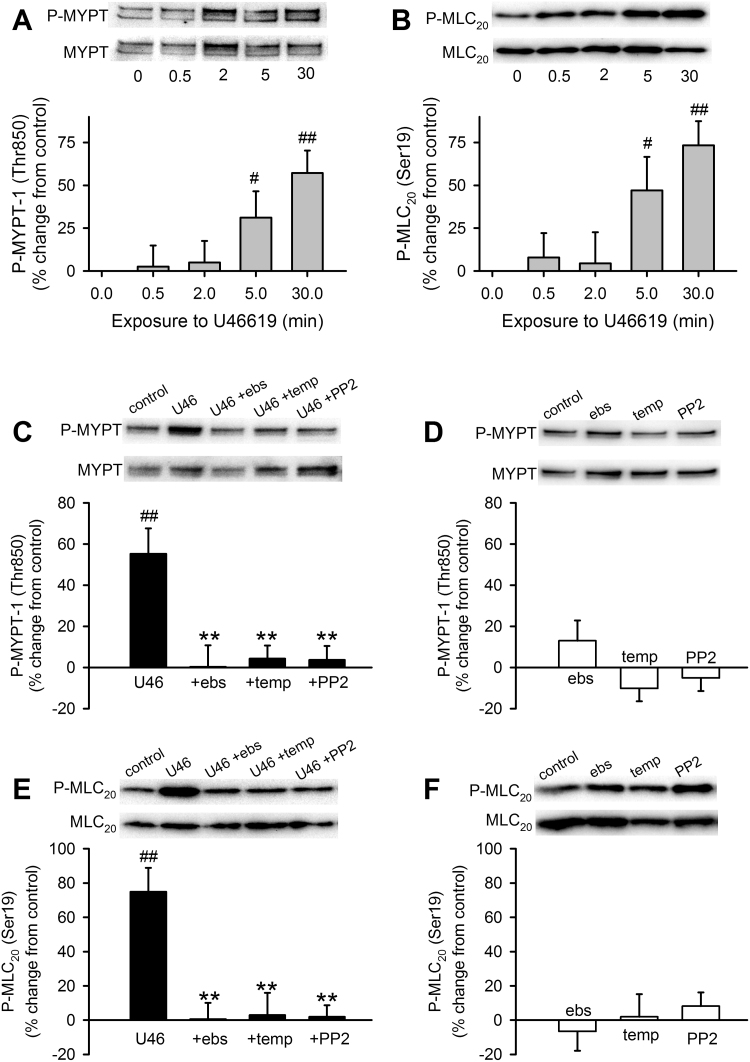
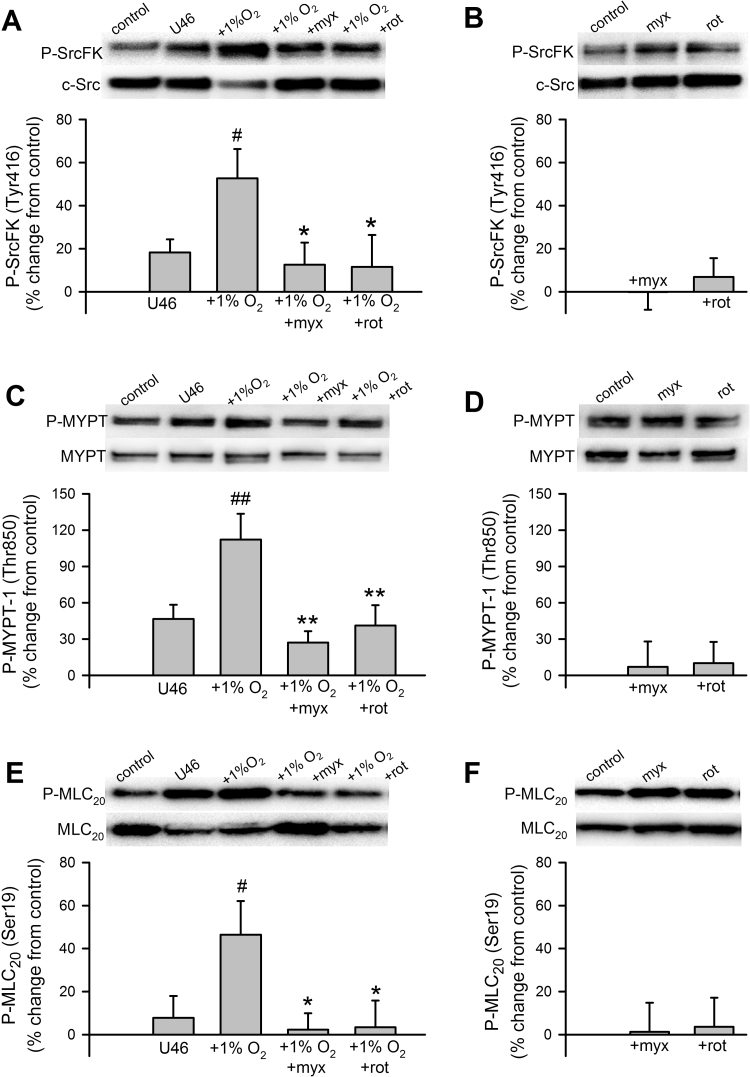
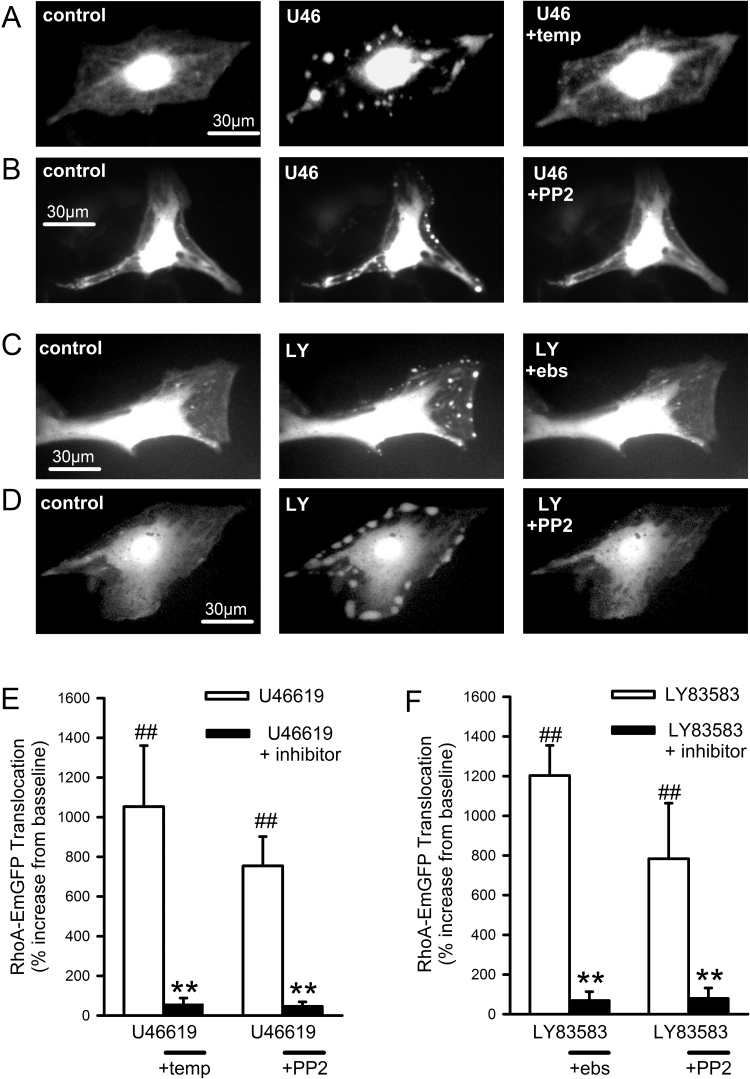
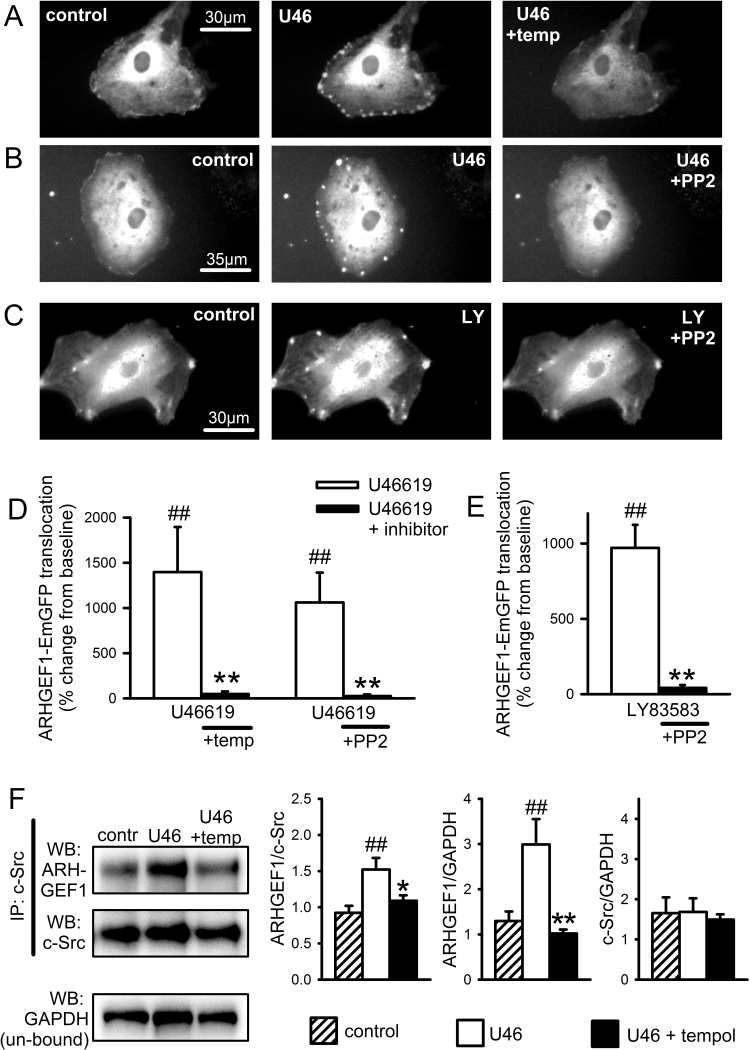
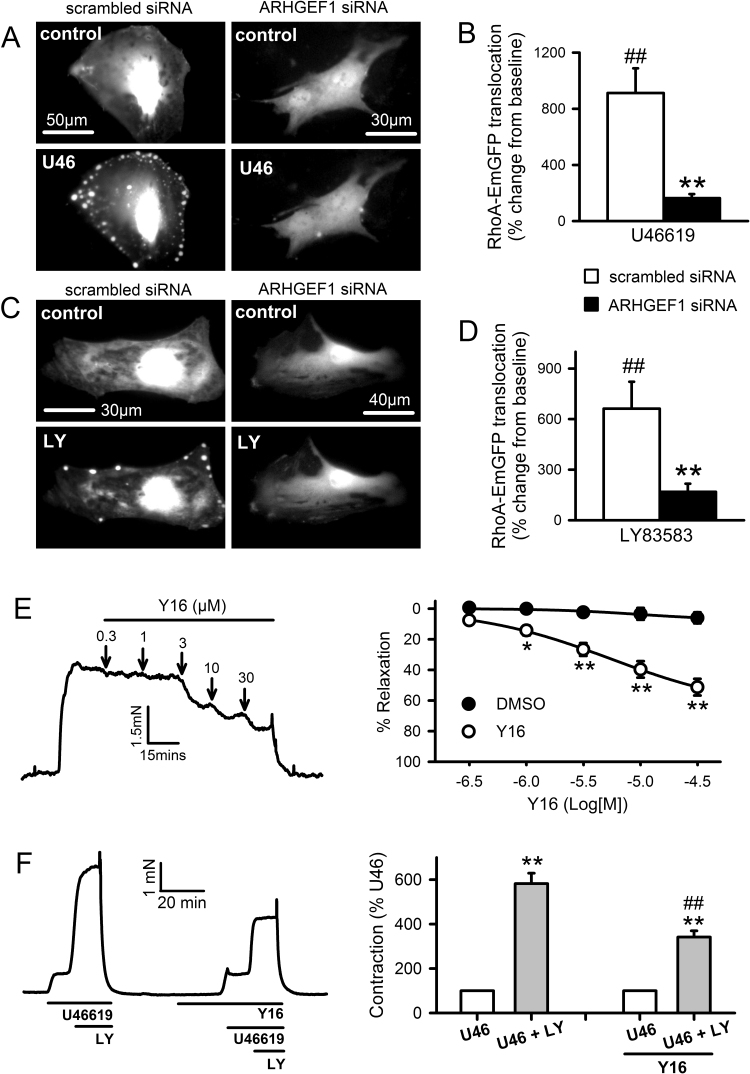
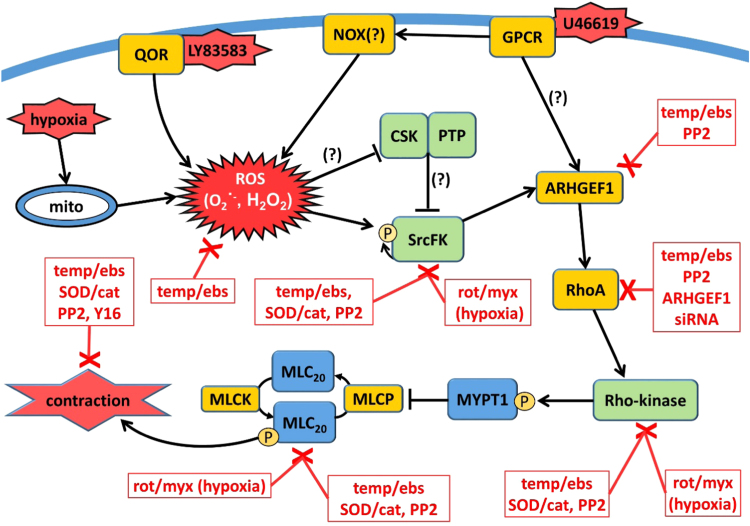
The role of reactive oxygen species (ROS) in smooth muscle contraction is poorly understood. We hypothesised that G-protein coupled receptor (GPCR) activation and hypoxia induce Rho-kinase activity and contraction in rat intra-pulmonary artery (IPA) via stimulation of ROS production and subsequent Src-family kinase (SrcFK) activation. The T-type prostanoid receptor agonist U46619 induced ROS production in pulmonary artery smooth muscle cells (PASMC). U46619 also induced c-Src cysteine oxidation, SrcFK auto-phosphorylation, MYPT-1 and MLC20 phosphorylation and contraction in IPA, and all these responses were inhibited by antioxidants (ebselen, Tempol). Contraction and SrcFK/MYPT-1/MLC20 phosphorylations were also inhibited by combined superoxide dismutase and catalase, or by the SrcFK antagonist PP2, while contraction and MYPT-1/MLC20 phosphorylations were inhibited by the Rho guanine nucleotide exchange factor (RhoGEF) inhibitor Y16. H2O2 and the superoxide-generating quinoledione LY83583 both induced c-Src oxidation, SrcFK auto-phosphorylation and contraction in IPA. LY83583 and H2O2-induced contractions were inhibited by PP2, while LY83583-induced contraction was also inhibited by antioxidants and Y16. SrcFK auto-phosphorylation and MYPT-1/MLC20 phosphorylation was also induced by hypoxia in IPA and this was blocked by mitochondrial inhibitors rotenone and myxothiazol. In live PASMC, sub-cellular translocation of RhoA and the RhoGEF ARHGEF1 was triggered by both U46619 and LY83583 and this translocation was blocked by antioxidants and PP2. RhoA translocation was also inhibited by an ARHGEF1 siRNA. U46619 enhanced ROS-dependent co-immunoprecipitation of ARHGEF1 with c-Src. Our results demonstrate a link between GPCR-induced cytosolic ROS or hypoxia-induced mitochondrial ROS and SrcFK activity, Rho-kinase activity and contraction. ROS and SrcFK activate RhoA via ARHGEF1.

Keywords: Guanine nucleotide exchange factors; Hypoxia; Pulmonary artery; Reactive oxygen species; Rho-kinase; Src-family kinases; Tyrosine kinases; Vascular smooth muscle.


Figures

fx1
Graphical abstract
Fig. 1
Fig. 1
Effects of U46619, antioxidants and SrcFK inhibition on contraction and ROS production. A-C: Concentration-dependent relaxation responses to ebselen (A, n=8), Tempol (B, n=7) and PP2 (C, n=6) in IPA pre-constricted with 100 nM U46619. Left panels: representative traces with arrows indicating where each dose was added. Right panels: mean effects of inhibitors plotted against DMSO vehicle control (n=5). *P<0.05, **P<0.01 vs. DMSO control (2-way ANOVA). D: Effect of ebselen (10 µM) or Tempol (3 mM) on U46619-induced ROS production (15 min, 100 nM, solid bars) or on basal ROS production (open bars) in PASMC, measured by L-012 chemi-luminescence. #P<0.01 vs. control; ##P<0.001 vs. control; **P<0.001 vs. U46619 alone (2-way ANOVA, n=10).
Fig. 2
Fig. 2
Effects of exogenous superoxide on U46619-induced contraction in IPA. A: LY83583 (LY, 1 µM, 15 min, n=12) generates superoxide in PASMC, as measured by L-012 chemi-luminescence), and this is inhibited by ebselen (ebs, 10 µM, n=10) or Tempol (temp, 3 mM, n=10). **P<0.001 vs. control, ##P<0.001 vs. LY alone. B-E: Effects of LY83583 and inhibitors on U46619-induced contraction in IPA. U46619 concentration was adjusted in each case to produce contractions equivalent to ~10% of KPSS (U46). 1 µM LY83583 was then added for 10 min (U46+LY). This response was then repeated in the presence of either DMSO vehicle (B, n=6), ebselen (C, 10 µM, n=7), Tempol (D, 3 mM, n=11) or PP2 (E, 30 µM, n=8). Left panels: representative traces. Right panels: mean ± SEM measurements of peak LY83583-induced contraction, expressed as a percentage of the U46619 pre-constriction. *P<0.05 vs. U46; **P<0.01 vs. U46, ##P<0.001 vs. control U46+LY (2-way ANOVA).
Fig. 3
Fig. 3
Effects of U46619, antioxidants and exogenous ROS on c-Src cysteine oxidation, and SrcFK auto-phosphorylation in IPA. A, B: c-Src cysteine oxidation in IPA is significantly enhanced by U46619 (U46, 100 nM, 30 min, n=9), LY83583 (LY, 1 or 10 µM, 30 min, n=7–8) and H2O2 (30 µM, 30 min, n=5). This enhancement and part of the underlying basal oxidation, is prevented by Tempol (temp, 3 mM, n=6–8). #P<0.05, ##P<0.01 vs. control, **P<0.01 vs. U46 only or vs. 10-LY only (1-way ANOVA). C: U46619 (100 nM) time-dependently enhances SrcK auto-phosphorylation (Tyr416) in IPA (n=9, #P<0.05 vs. control, ##P<0.01 vs. control, 1-way ANOVA). D: In the absence of U46, SrcFK auto-phosphorylation is significantly enhanced by LY83583 (1 µM) at 0.5 min (n=16) and 30 min (n=7), #P<0.05 vs. control (1-way ANOVA). E: At 30 min, U46619-induced SrcFK auto-phosphorylation is inhibited by ebselen (ebs, 10 µM, n=14), Tempol (n=11) or PP2 (30 µM, n=10) #P<0.05 vs. control. F: In the absence of U46, SrcFK auto-phosphorylation is unaffected by ebselen (n=10) or Tempol (n=10) but significantly inhibited by PP2 (n=8), ##P<0.001 vs. control, **P<0.001 vs. U46 alone (n=19, 2-way ANOVA).
Fig. 4
Fig. 4
Contribution of ROS and SrcFK to U46619-induced Rho-kinase activity and MLC20 phosphorylation in IPA. U46619 (U46, 100 nM) time-dependently enhances phosphorylation of MYPT-1 on Thr850 (A), and of MLC20 on Ser19 (B), in IPA (n=8–10, #P<0.05 vs. control, ##P<0.001 vs. control, 1-way ANOVA). C: At 30 min, U46619-induced MYPT-1 phosphorylation is inhibited by ebselen (ebs, 10 µM, n=8), Tempol (temp, 3 mM, n=12) and PP2 (30 µM, n=18) ##P<0.001 vs. control (n=27), **P<0.001 vs. U46 alone, while in the absence of U46 (D), MYPT-1 phosphorylation was unaffected by ebselen (n=11), Tempol (n=12) or PP2 (n=18) (2-way ANOVA). E: Similarly, at 30 min, U46619-induced MLC20 phosphorylation is also inhibited by ebs (n=14), temp (n=12) and PP2 (n=17) ##P<0.001 vs. control (n=27), **P<0.001 vs. U46 alone, while in the absence of U46 (F), MLC20 phosphorylation is unaffected by ebselen (n=13), Tempol (n=12) or PP2 (n=18) (2-way ANOVA).
Fig. 5
Fig. 5
Effects of hypoxia and mitochondrial ETC inhibitors on SrcFK, MYPT-1 and MLC20 phosphorylation in IPA. A: Hypoxia (1% O2, 1 min) enhances SrcFK auto-phosphorylation following priming with U46619 (U46, 1 nM, 15 min), and this enhancement is prevented by myxothiazol (myx, 100 nM) or rotenone (rot, 100 nM). #P<0.05 vs. U46 alone, *P<0.05 vs. U46/1% O2 (2-way ANOVA, n=9–10). B: Myxothiazol alone or rotenone alone has no significant effect on SrcFK auto-phosphorylation (1-way ANOVA, n=8–9). C: Hypoxia (1% O2, 5 min) enhances MYPT-1 phosphorylation following priming with U46619 (U46, 1 nM, 15 min), and this enhancement is prevented by myxothiazol (myx, 100 nM) or rotenone (rot, 100 nM). ##P<0.01 vs. U46 alone, **P<0.01 vs. U46/1% O2 (2-way ANOVA, n=9–10). D: Myxothiazol or rotenone alone (in the absence of contractile stimuli) have no significant effect on MYPT-1 phosphorylation (1-way ANOVA, n=9–11). E: Hypoxia (1% O2, 5 min) enhances MLC20 phosphorylation following priming with U46619 (U46, 1 nM, 15 min), and this enhancement is prevented by myxothiazol (myx, 100 nM) or rotenone (rot, 100 nM) #P<0.05 vs. U46 alone, *P<0.05 vs. U46/1% O2 (2-way ANOVA, n=9–10). F: Myxothiazol or rotenone alone (in the absence of contractile stimuli) have no significant effect on MLC20 phosphorylation (1-way ANOVA, n=9–10).
Fig. 6
Fig. 6
Effects of U46619, LY83583, antioxidants and SrcFK inhibition on RhoA-EmGFP translocation in PASMC. A-D: Fluorescent imaging of representative RhoA-EmGFP transfected PASMC at rest (left panels), in the presence of stimulus (middle panels A-B: U46619, U46, 100 nM or C-D: LY83583, LY, 1 µM) or after washout followed by repeated exposure to stimulus in the presence of either Tempol, PP2 or ebselen (right panels). E-F: Quantification of spot/patch fluorescence intensity expressed as % change above control levels during stimulus ± inhibition (E: U46619, F: LY83583). ##P<0.001 vs. baseline, **P<0.001 vs. U46619, 2-way ANOVA, n=8–11 cells from a total of seven different cell lines. Each measurement is combined from at least 3 spots/patches from each cell. See supplementary Fig. S6 for control responses.
Fig. 7
Fig. 7
ARGHEF1-EmGFP translocates in response to U46619 and LY83583 in PASMC and co-localises with c-Src in IPA. A-C: Fluorescent imaging of representative ARHGEF1-EmGFP transfected PASMC at rest (left panels), in the presence of stimulus (middle panels A-B: U46619, U46, 100 nM or C: LY83583, LY, 1 µM) or after washout followed by repeated exposure to stimulus in the presence of either Tempol or PP2 (right panels). D-E: Quantification of spot/patch fluorescence intensity expressed as % change above control levels during stimulus ± inhibition (D: U46619, E: LY83583). ##P<0.001 vs. baseline, **P<0.001 vs. U46619, 2-way ANOVA, n=8–9 cells from a total of seven different cell lines. Each measurement is combined from at least 3 spots/patches from each cell. See supplementary Fig. S8 for control responses. F: Co-localisation of ARHGEF1 with c-Src in IPA. Representative blots show the effect of U46619 (100 nM, 30 min) on ARHGEF1 content (WB: GEF1) and c-Src content (WB: c-Src) after c-Src immuno-precipitation (IP: c-Src), with GAPDH content in the un-bound fraction as a loading control (WB: GAPDH). Bar charts show that U46619 treatment increases ARHGEF1 co-immuno-precipitation with c-Src and that this is prevented by pre-incubation with Tempol (3 mM). ARHGEF1 content expressed relative to both c-Src IP content and GAPDH loading control. c-Src IP content is unaffected by treatment. ##P<0.0.1 vs. control, *P<0.05, **P<0.01 vs. U46, 1-way ANOVA, n=6.
Fig. 8
Fig. 8
Effects of RhoGEF inhibition on U46619 and ROS-induced RhoA translocation and contraction. A-D: Fluorescence imaging of RhoA-EmGFP translocation in PASMC, co-transfected with ARHGEF1 siRNA or scrambled siRNA, stimulated with U46619 (A: U46, 100 nM) or LY83583 (C: LY, 1 µM). Quantification of spot/patch fluorescence intensity expressed as % change above control levels during stimulus ± inhibition (B: U46619, D: LY83583). ##P<0.001 vs. baseline, **P<0.001 vs. treatment, 2-way ANOVA, n=12–16 cells from a total of three different cell lines. Each measurement is combined from at least 3 spots/patches from each cell. E: Concentration-dependent relaxation responses Y16 (10 µM) in IPA pre-constricted with 100 nM U46619. Left panels: representative traces with arrows indicating where each dose was added. Right panels: mean effects of inhibitor plotted against DMSO vehicle control (n=12). *P<0.05, **P<0.01 vs. DMSO control (2-way ANOVA). F: Effects of LY83583 and Y16 on U46619-induced contraction in IPA. U46619 concentration was adjusted in each case to produce contractions equivalent to ~10% of KPSS. 1 µM LY83583 was then added for 10 min (U46+LY). This response was then repeated in the presence of Y16 (10 µM, n=13). Left panels: representative traces. Right panels: mean ± SEM measurements of peak LY83583-induced contraction, expressed as a percentage of the U46619 pre-constriction. **P<0.01 vs. U46, ##P<0.001 vs. control U46+LY (2-way ANOVA).
Fig. 9
Fig. 9
Graphical Summary. ROS-induced contractile signalling pathway in rat pulmonary artery. Reactive oxygen species (ROS: superoxide and H2O2) generated in response to GPCR (presumably via NADPH-oxidase, NOX), LY83583 (via quinone oxidoreductase, QOR), or hypoxia (from mitochondria, mito), activate Src-family kinases (SrcFK) either via direct oxidation or via oxidative inhibition of c-Src kinase (CSK) or inhibitory tyrosine phosphatases (PTP). This is followed by sequential activation of ARHGEF1, RhoA and Rho-kinase, resulting in enhanced MYPT-1 and MLC20 phosphorylation and contraction. Boxed red text indicates treatments/antagonists that inhibit responses or activity of each component in the pathway. Temp/ebs = antioxidants Tempol & ebselen; SOD/cat = superoxide dismutase and catalase; PP2 = SrcFK inhibitor; rot/myx = mitochondrial electron transfer chain inhibitors rotenone & myxothiazol; Y16 = inhibitor of RGS domain containing RhoAGEFs. Question mark indicates steps shown previously but not examined in this study.

Similar articles

Cited by

References

    1. Shaifta Y., Snetkov V.A., Prieto-Lloret J., Knock G.A., Smirnov S.V., Aaronson P.I. Sphingosylphosphorylcholine potentiates vasoreactivity and voltage-gated Ca2+ entry via NOX1 and reactive oxygen species. Cardiovasc. Res. 2015;106:121–130. - PMC - PubMed
    1. Waypa G.B., Marks J.D., Guzy R.D., Mungai P.T., Schriewer J.M., Dokic D. Superoxide generated at mitochondrial complex III triggers acute responses to hypoxia in the pulmonary circulation. Am. J. Respir. Crit. Care Med. 2013;187:424–432. - PMC - PubMed
    1. Fomenko D.E., Xing W., Adair B.M., Thomas D.J., Gladyshev V.N. High-throughput identification of catalytic redox-active cysteine residues. Science. 2007;315:387–389. - PubMed
    1. Knock G.A., Ward J.P. Redox regulation of protein kinases as a modulator of vascular function. Antioxid. Redox Signal. 2011;15:1531–1547. - PubMed
    1. Miki H., Funato Y. Regulation of intracellular signalling through cysteine oxidation by reactive oxygen species. J. Biochem. 2012;151:255–261. - PubMed

Publication types

MeSH terms

LinkOut - more resources