

Studying protein-DNA interactions using atomic force microscopy
- PMID: 28673677
- PMCID: PMC5762137
- DOI: 10.1016/j.semcdb.2017.06.028
Studying protein-DNA interactions using atomic force microscopy
Abstract
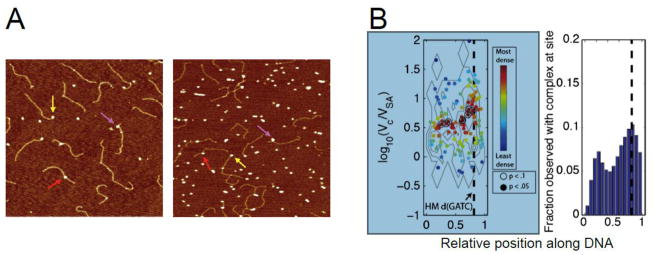
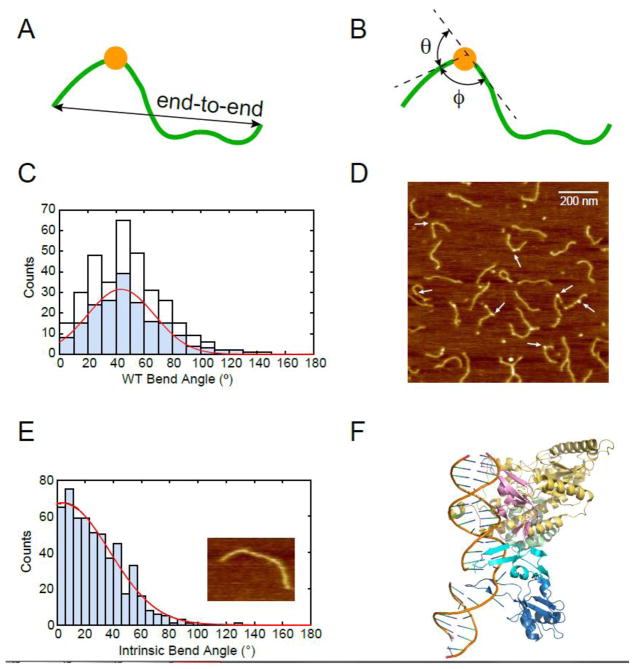
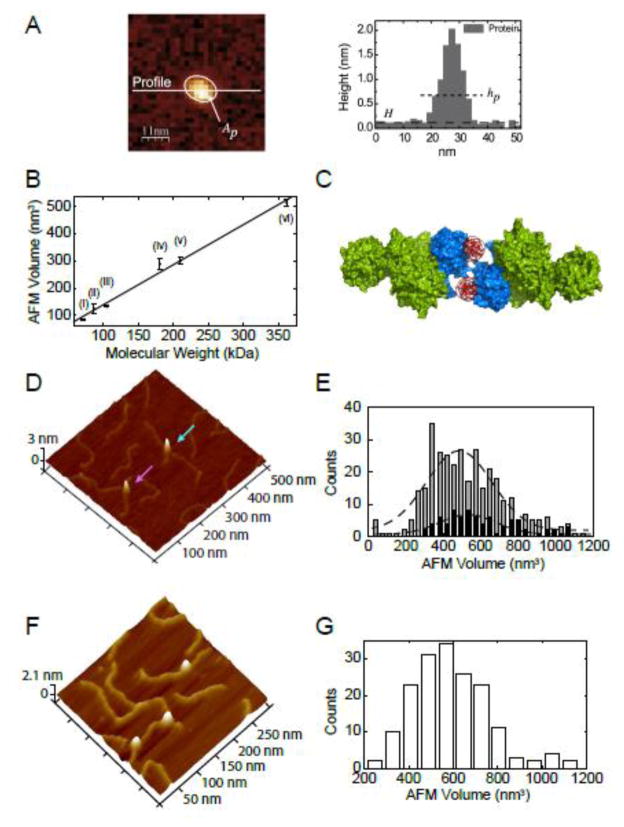
Atomic force microscopy (AFM) has made significant contributions to the study of protein-DNA interactions by making it possible to topographically image biological samples. A single protein-DNA binding reaction imaged by AFM can reveal protein binding specificity and affinity, protein-induced DNA bending, and protein binding stoichiometry. Changes in DNA structure, complex conformation, and cooperativity, can also be analyzed. In this review we highlight some important examples in the literature and discuss the advantages and limitations of these measurements. We also discuss important advances in technology that will facilitate the progress of AFM in the future.
Keywords: Atomic force microscopy; Binding specificity; DNA bending; Protein-DNA interaction; Stoichiometry.
Copyright © 2017 Elsevier Ltd. All rights reserved.
Figures
Similar articles
-
[Progress in the studies of DNA-protein interactions by atomic force microscopy].Sheng Wu Yi Xue Gong Cheng Xue Za Zhi. 2007 Oct;24(5):1172-6. Sheng Wu Yi Xue Gong Cheng Xue Za Zhi. 2007. PMID: 18027720 Review. Chinese.
-
DNA-protein interactions explored by atomic force microscopy.Semin Cell Dev Biol. 2018 Jan;73:231-239. doi: 10.1016/j.semcdb.2017.07.015. Epub 2017 Jul 14. Semin Cell Dev Biol. 2018. PMID: 28716606 Review.
-
Single molecule mechanical manipulation for studying biological properties of proteins, DNA, and sugars.Wiley Interdiscip Rev Nanomed Nanobiotechnol. 2014 May-Jun;6(3):211-29. doi: 10.1002/wnan.1253. Epub 2013 Dec 17. Wiley Interdiscip Rev Nanomed Nanobiotechnol. 2014. PMID: 24347439 Review.
-
Imaging proteins with atomic force microscopy: an overview.Curr Protein Pept Sci. 2005 Aug;6(4):387-95. doi: 10.2174/1389203054546389. Curr Protein Pept Sci. 2005. PMID: 16101436 Review.
-
Observing single biomolecules at work with the atomic force microscope.Nat Struct Biol. 2000 Sep;7(9):715-8. doi: 10.1038/78929. Nat Struct Biol. 2000. PMID: 10966636 Review.
Cited by
-
Structural insights into the DNA topoisomerase II of the African swine fever virus.Nat Commun. 2024 May 30;15(1):4607. doi: 10.1038/s41467-024-49047-w. Nat Commun. 2024. PMID: 38816407 Free PMC article.
-
Accurate nanoscale flexibility measurement of DNA and DNA-protein complexes by atomic force microscopy in liquid.Nanoscale. 2017 Aug 10;9(31):11327-11337. doi: 10.1039/c7nr04231k. Nanoscale. 2017. PMID: 28762410 Free PMC article.
-
HybridDBRpred: improved sequence-based prediction of DNA-binding amino acids using annotations from structured complexes and disordered proteins.Nucleic Acids Res. 2024 Jan 25;52(2):e10. doi: 10.1093/nar/gkad1131. Nucleic Acids Res. 2024. PMID: 38048333 Free PMC article.
-
AFM and FluidFM Technologies: Recent Applications in Molecular and Cellular Biology.Scanning. 2018 Jul 4;2018:7801274. doi: 10.1155/2018/7801274. eCollection 2018. Scanning. 2018. PMID: 30069282 Free PMC article. Review.
-
High-Speed Atomic Force Microscopy Visualization of Protein-DNA Interactions Using DNA Origami Frames.Methods Mol Biol. 2022;2516:157-167. doi: 10.1007/978-1-0716-2413-5_10. Methods Mol Biol. 2022. PMID: 35922627
References
-
- Binnig G, Quate CF, Gerber C. Atomic Force Microscope. Physical Review Letters. 1986;56(9):930–933. - PubMed
-
- Sauer RT. Methods in Enzymology. Academic Press; San Diego, California: 1991. Protein-DNA Interactions.
-
- Jen-Jacobson L, Engler LE, Jacobson LA. Structural and thermodynamic strategies for site-specific DNA binding proteins. Structure. 2000;8(10):1015–23. - PubMed
-
- Bustamante C, Vesenka J, Tang CL, Rees W, Guthold M, Keller R. Circular DNA molecules imaged in air by scanning force microscopy. Biochemistry. 1992;31(1):22–6. - PubMed
-
- Yang J, Takeyasu K, Shao Z. Atomic force microscopy of DNA molecules. FEBS Lett. 1992;301(2):173–6. - PubMed
Publication types
MeSH terms
Substances
Grants and funding
LinkOut - more resources
Full Text Sources
Other Literature Sources
Miscellaneous
