. 2017 Sep 1;429(1):147-157.
doi: 10.1016/j.ydbio.2017.06.035. Epub 2017 Jul 1.

PKA-mediated Gli2 and Gli3 phosphorylation is inhibited by Hedgehog signaling in cilia and reduced in Talpid3 mutant

Affiliations

PKA-mediated Gli2 and Gli3 phosphorylation is inhibited by Hedgehog signaling in cilia and reduced in Talpid3 mutant

Jia Li et al. Dev Biol. .

Abstract

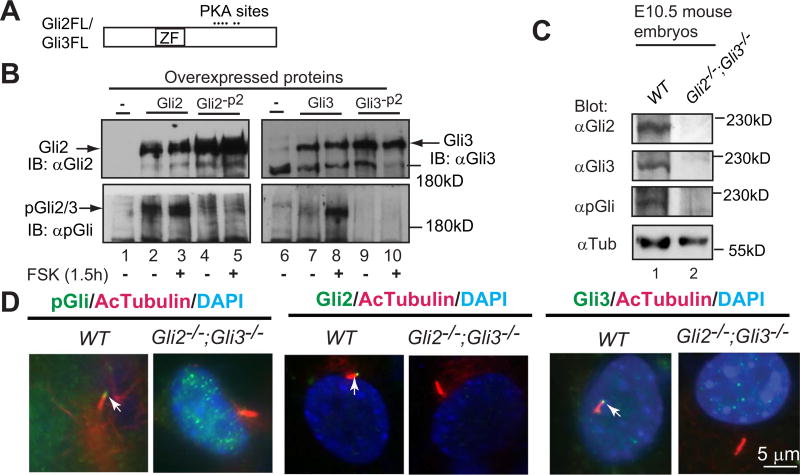
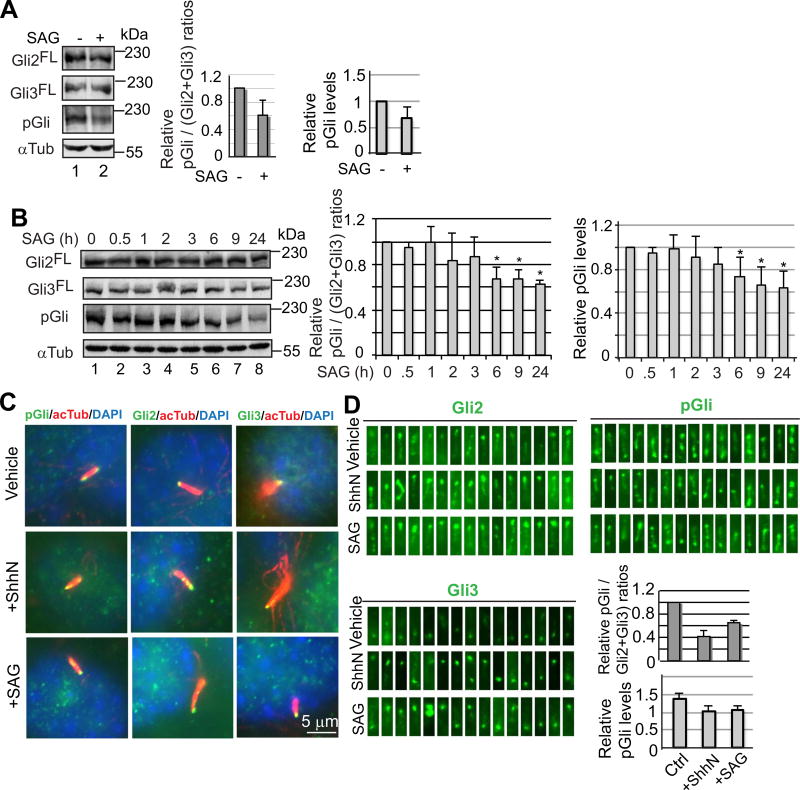
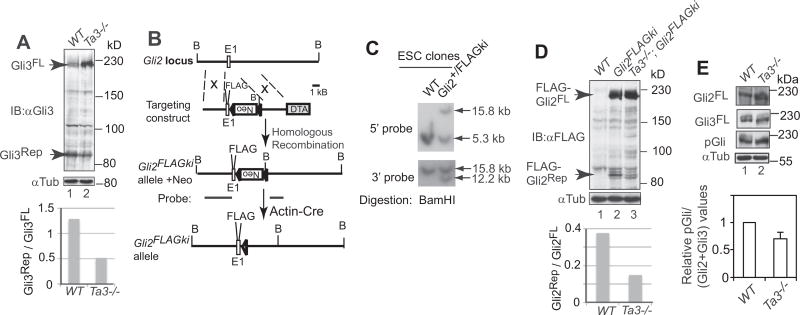
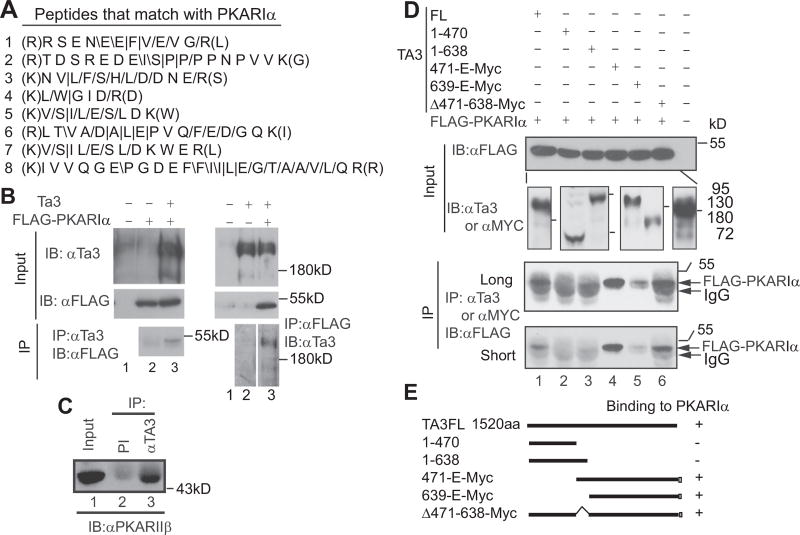
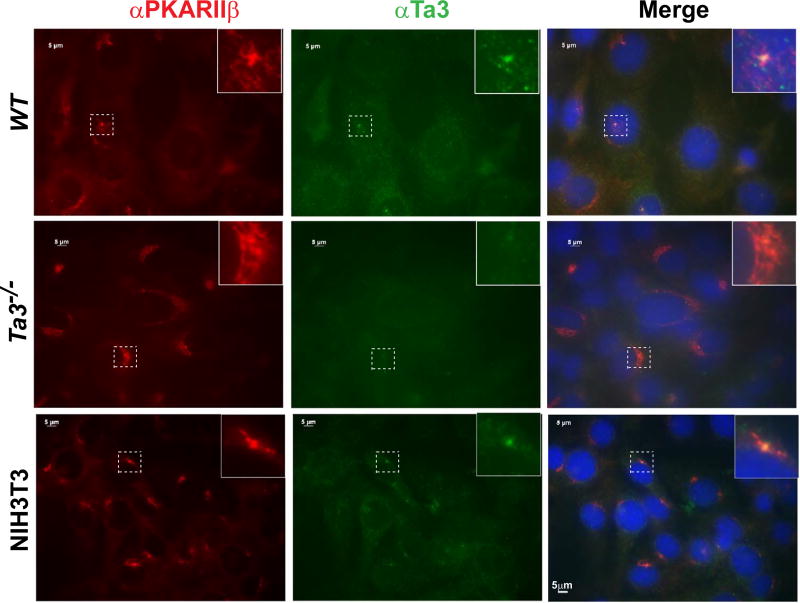
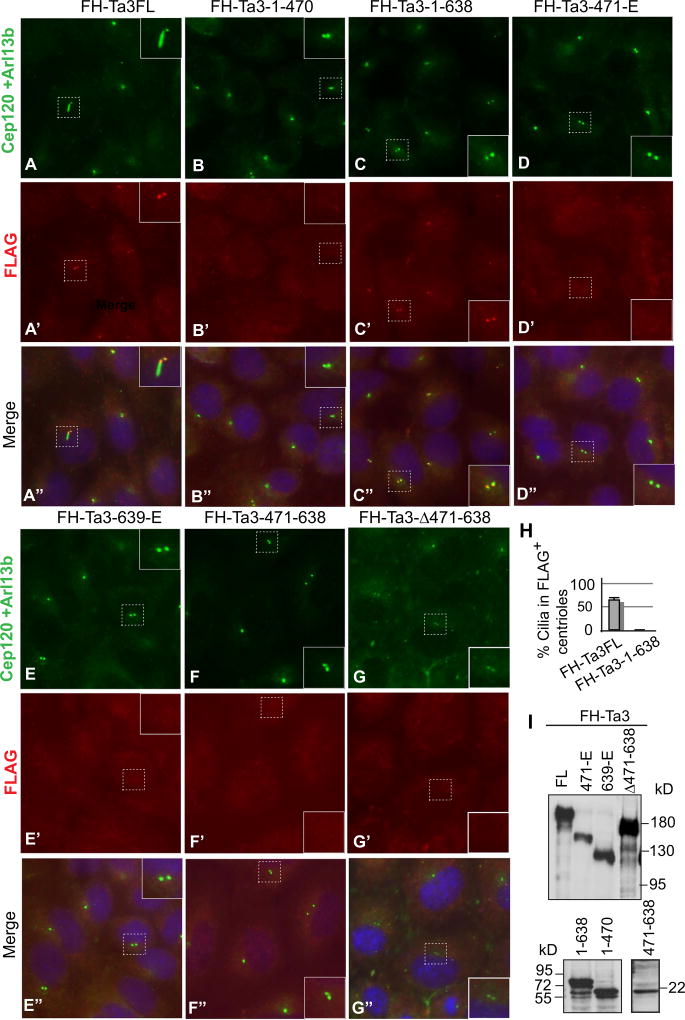
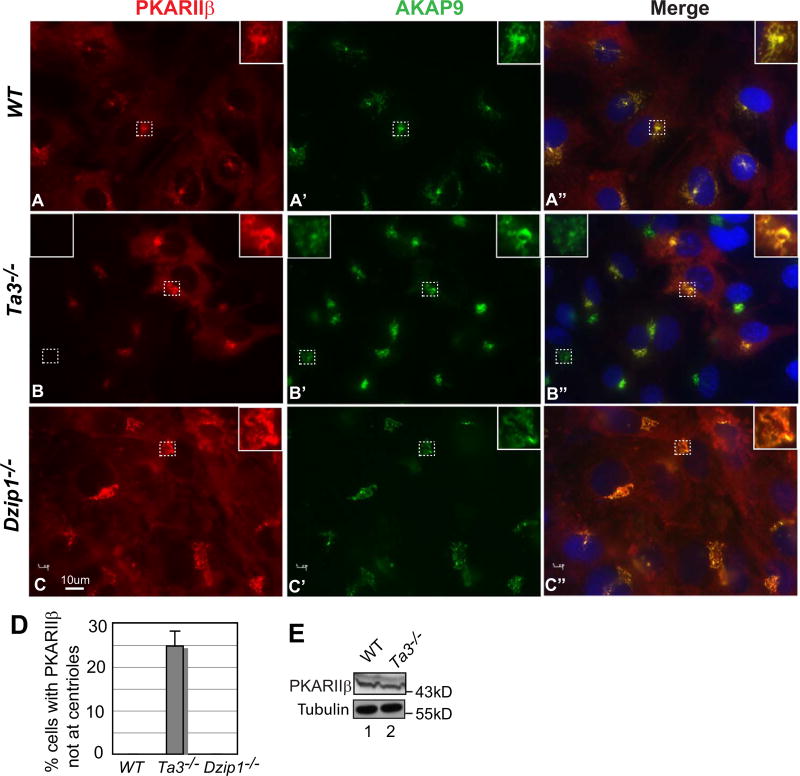
Hedgehog (Hh) signaling is thought to occur in primary cilia, but the molecular basis of Gli2 and Gli3 activation by Hh signaling in cilia is unknown. Similarly, how ciliary gene mutations result in reduced Gli3 processing that generates a repressor is also not clear. Here we show that Hh signaling inhibits Gli2 and Gli3 phosphorylation by protein kinase A (PKA) in cilia. The cilia related gene Talpid3 (Ta3) mutation results in the reduced processing and phosphorylation of Gli2 and Gli3. Interestingly, Ta3 interacts and colocalizes with PKA regulatory subunit PKARIIβ at centrioles in the cell. The centriolar localization and PKA binding regions are located in the N- and C-terminal regions of Ta3, respectively. PKARIIβ fails to localize at centrioles in some Ta3 mutant cells. Therefore, our study provides the direct evidence that Gli2 and Gli3 are dephosphorylated and activated in cilia and that impaired Gli2 and Gli3 processing in Ta3 mutant is at least in part due to a decrease in Gli2 and Gli3 phosphorylation.

Keywords: Cilia; Gli2; Gli3; Hedgehog; PKA; Talpid3.


Figures

Fig. 1
Fig. 1
A phosphopeptide antibody (pGli) specifically recognizes the phosphorylated Gli2 and Gli3 proteins at the second PKA site. (A) A diagram showing Gli2 and Gli3 proteins with the zinc-finger domain (ZF) and six PKA sites. (B) Immunoblots of overexpressed Gli2, Gli3, and their mutants at the second PKA site (Gli2-P2, Gli3-P2) with Gli2, Gli3, or pGli antibodies. Forskolin (FSK) induces Gli2/Gli3 phosphorylation. (C) Immunoblots of endogenous Gli2, Gli3, and phosphorylated Gli2/Gli3 using protein lysates prepared from wild type (WT) and Gli2;Gli3 double mutant (control) mouse embryos. (D) Gli2, Gli3, and PKA-phosphorylated Gli2 and Gli3 localize to primary cilia. Immunostaining of WT and Gli2;Gli3 double mutant MEFs for the indicated proteins. Note that pGli, Gli2, and Gli3 antibodies are specific, as no signals were detected in the protein lysates and cilia of the mutant cells. AcTubulin, acetylated tubulin, a cilia marker; DAPI, staining for nuclei. These experiments were performed at least two times.
Fig. 2
Fig. 2
Hedgehog signaling inhibits PKA-mediated Gli2 and Gli3 phosphorylation in cilia. (A) Immunoblots showing the levels of Gli2FL, Gli3FL, and phosphorylated Gli2 and Gli3 (pGli) in C3H10T1/2 cells. Graphs show the relative pGli levels either with or without being normalized to those of Gli2FL and Gli3FL. Two-tailed Student t-test p-value = 0.034 < 0.5. (B) Immunoblots showing the time course of the levels of Gli2FL, Gli3FL, and pGli in response to SAG. Graphs to the right show the relative pGli/(Gli2+Gli3) or pGli values. P-values ≤ 0.0067 for bar graphs marked with *. (C) Representative images showing Gli2, Gli3, and pGli staining in cilia before and after treatment with ShhN or SAG. (D) Fifteen randomly chosen cilia that show positive staining for Gli2, Gli3, and pGli. The graphs show the arbitrary intensity of pGli staining per cilia by either with (upper graph) or without (lower graph) being normalized against Gli2FL and Gli3FL levels. Two-tailed Student t-test p-value ≤ 0.00057 (upper graph) or 0.036 (lower graph), respectively.
Fig. 3
Fig. 3
The processing and PKA-mediated phosphorylation of Gli2 and Gli3 were diminished in Ta3 mutant cells. (A, D, E) Immunoblots for Gli3, FLAG-Gli2, Gli2, and pGli in wt and Ta3 mutant embryos. Tubulin immunoblots are loading controls. Graphs show the ratios of Gli3Rep to Gli3FL and FLAG-Gli2Rep to FLAG-Gli2FL and relative pGli to (Gli2+ Gli3) values. Two-tailed Student t-test p-value = 0.0136 for E. from three independent experiments. (B) The gene targeting strategy to create Gli2FLAGki allele. E1, exon 1; FLAG, 3×FLAG tag; Neo, pGkneo cassette in a reverse orientation; triangle, loxP site; DTA, diphtheria toxin A; B, BamHI site. (C) Southern blot showing wt and a representative Gli2FLAGki ES cell clone with probes shown in B.
Fig. 4
Fig. 4
The Ta3 C-terminus interacts with PKA regulatory subunits. (A) The peptides obtained from mass spectrometry match with PKARIα. /, /, and | are referred to as y-ions, b-ions, and both, respectively. They were detected in the tandem mass spectrometry analysis of the peptides. (B) Coimmunoprecipitation showing that Ta3 interacts with FLAG-PKARIα in transfected HEK293 cells. (C) Coimmunoprecipitation showing that endogenous Ta3 interacts with PKARIIβ. (D) Coimmunoprecipitation showing that the C-terminal region of Ta3 interacts with PKARIα. Subpanels in the second panel from the top are from different immunoblots. The molecular weight markers correspond to the lines in each subpanel in the order. Two lower panels are the same with different exposure time. (E) Diagrams showing constructs and summary in D. IP, immunoprecipitation; IB, immunoblot; PI, preimmune serum.
Fig. 5
Fig. 5
Ta3 and PKARIIβ colocalize at centrioles in the cell. Wild type (WT) and Ta3 mutant MEFs and NIH3T3 cells were stained for PKARIIβ, Ta3, and nuclei (DAPI, blue). Ta3 staining is specific, as no signals were detected in Ta3 mutant cells. Insets are the enlargement of the framed areas with dash lines.
Fig. 6
Fig. 6
Expression of Ta3FL, but not Ta3 mutants, rescues ciliogenesis in Ta3 mutant cells. (A–G”) Ta3 mutant MEFs were transduced with the retrovirus carrying the constructs indicated above the panels. Following serum starvation, the cells were stained with FLAG, Cep120, and Arl13b antibodies and counterstained with DAPI for nuclei. FLAG labels Ta3 and mutants. Cep120 marks centrioles, and Arl13b is a cilia marker. Insets are enlargement of the framed areas with dash lines. Note that although both FH-Ta3FL and FH-Ta3-1–638 localize at centrioles, only FH-Ta3FL expression rescues cilia formation. (H) A graph showing that the percent cells that are FLAG-staining positive at centrioles form cilia. Two-tailed Student t-test p-value = 0.0001 (n=72). (I) Immunoblots showing the expression of Ta3 and mutant proteins.
Fig. 7
Fig. 7
PKARIIβ is not colocalized with AKAP9 at centrosome in some Ta3 mutant cells. (AC) WT, Ta3, and Dzip1 mutant MEFs were stained for PKARIIβ, AKAP9, and nuclei (DAPI, blue). Insets are the enlargement of the framed areas with dash lines. Insets in the right show colocalization, whereas an inset in the left shows a lack of colocalization. (D) The percentage of Ta3 mutant cells that lack PKARIIβ staining at centrioles. The graph was derived from three independent experiments. Note that PKARIIβ mislocalization is only detected in Ta3 but not Dzip1 mutant cells. P-value = 0.0002 (n ≥ 60). (E) Immunoblot showing the similar PKARIIβ levels in wt and Ta3 mutant cells.

Similar articles

Cited by

References

    1. Bai CB, Stephen D, Joyner AL. All mouse ventral spinal cord patterning by hedgehog is Gli dependent and involves an activator function of Gli3. Dev. Cell. 2004;6:103–115. - PubMed
    1. Bangs F, Antonio N, Thongnuek P, Welten M, Davey MG, Briscoe J, Tickle C. Generation of mice with functional inactivation of talpid3, a gene first identified in chicken. Development. 2011;138:3261–3272. - PMC - PubMed
    1. Briscoe J, Pierani A, Jessell TM, Ericson J. A homeodomain protein code specifies progenitor cell identity and neuronal fate in the ventral neural tube. Cell. 2000;101:435–445. - PubMed
    1. Caspary T, Larkins CE, Anderson KV. The graded response to Sonic Hedgehog depends on cilia architecture. Dev. Cell. 2007;12:767–778. - PubMed
    1. Chen JK, Taipale J, Young KE, Maiti T, Beachy PA. Small molecule modulation of Smoothened activity. Proc. Natl. Acad. Sci. Usa. 2002;99:14071–14076. - PMC - PubMed

MeSH terms

LinkOut - more resources