

Boldness traits, not dominance, predict exploratory flight range and homing behaviour in homing pigeons
- PMID: 28673912
- PMCID: PMC5498296
- DOI: 10.1098/rstb.2016.0234
Boldness traits, not dominance, predict exploratory flight range and homing behaviour in homing pigeons
Abstract
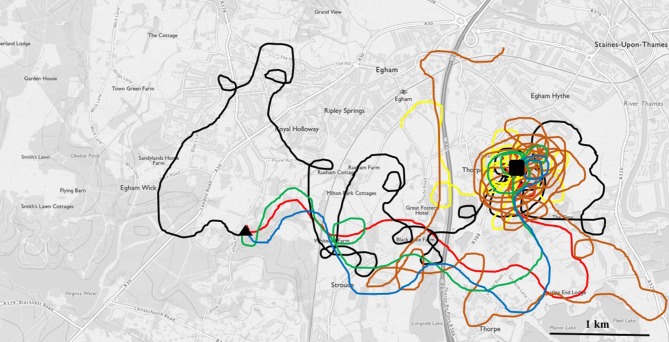
Group living has been proposed to yield benefits that enhance fitness above the level that would be achieved through living as solitary individuals. Dominance hierarchies occur commonly in these social assemblages, and result, by definition, in resources not being evenly distributed between group members. Determinants of rank within a dominance hierarchy can be associated with morphological characteristics, previous experience of the individual, or personality traits such as exploration tendencies. The purpose of this study was to investigate whether greater exploration and positive responses to novel objects in homing pigeons (Columba livia) measured under laboratory conditions were associated with (i) greater initial exploration of the local area around the home loft during spontaneous exploration flights (SEF), (ii) faster and more efficient homing flights when released from further afield, and (iii) whether the traits of greater exploration and more positive responses to novel objects were more likely to be exhibited by the more dominant individuals within the group. There was no relationship between laboratory-based novel object exploration and position within the dominance hierarchy. Pigeons that were neophobic under laboratory conditions did not explore the local area during SEF opportunities. When released from sites further from home, neophobic pigeons took longer routes to home compared to those birds that had not exhibited neophobic traits under laboratory conditions, and had spontaneously explored to a greater extent. The lack of exploration in the neophobic birds is likely to have resulted in the increased costs of homing following release: unfamiliarity with the landscape likely led to the greater distances travelled and less efficient routes taken. Birds that demonstrated a lack of neophobia were not the dominant individuals inside the loft, and thus would have less access to resources such as food and potentially mates. However, a lack of neophobia makes the subordinate position possible, because subordinate birds that incur high travel costs would become calorie restricted and lose condition. Our results address emerging questions linking individual variation in behaviour with energetics and fitness consequences.This article is part of the themed issue 'Physiological determinants of social behaviour in animals'.
Keywords: Columba livia; GPS; dominance hierarchy; navigation; neophobia; personality.
© 2017 The Author(s).
Conflict of interest statement
No competing interests to declare.
Figures
Similar articles
-
Personality and the collective: bold homing pigeons occupy higher leadership ranks in flocks.Philos Trans R Soc Lond B Biol Sci. 2018 May 19;373(1746):20170038. doi: 10.1098/rstb.2017.0038. Philos Trans R Soc Lond B Biol Sci. 2018. PMID: 29581403 Free PMC article.
-
Testing cognitive navigation in unknown territories: homing pigeons choose different targets.J Exp Biol. 2013 Aug 15;216(Pt 16):3123-31. doi: 10.1242/jeb.083246. J Exp Biol. 2013. PMID: 23885090
-
Homing pigeons (Columba livia) modulate wingbeat characteristics as a function of route familiarity.J Exp Biol. 2017 Aug 15;220(Pt 16):2908-2915. doi: 10.1242/jeb.154039. J Exp Biol. 2017. PMID: 28814611
-
Requiem for a heavyweight - can anything more be learned from homing pigeons about the sensory and spatial-representational basis of avian navigation?J Exp Biol. 2018 Oct 22;221(Pt 20):jeb163089. doi: 10.1242/jeb.163089. J Exp Biol. 2018. PMID: 30348670 Review.
-
Route following and the pigeon's familiar area map.J Exp Biol. 2014 Jan 15;217(Pt 2):169-79. doi: 10.1242/jeb.092908. J Exp Biol. 2014. PMID: 24431141 Review.
Cited by
-
Artificial mass loading disrupts stable social order in pigeon dominance hierarchies.Biol Lett. 2020 Aug;16(8):20200468. doi: 10.1098/rsbl.2020.0468. Epub 2020 Aug 5. Biol Lett. 2020. PMID: 32750272 Free PMC article.
-
Changing Flight and Flocking Dynamics of Homing Pigeons (Columba livia d.) Over Heterogeneous Landscapes.Ecol Evol. 2025 Aug 6;15(8):e71902. doi: 10.1002/ece3.71902. eCollection 2025 Aug. Ecol Evol. 2025. PMID: 40771545 Free PMC article.
-
Personality and the collective: bold homing pigeons occupy higher leadership ranks in flocks.Philos Trans R Soc Lond B Biol Sci. 2018 May 19;373(1746):20170038. doi: 10.1098/rstb.2017.0038. Philos Trans R Soc Lond B Biol Sci. 2018. PMID: 29581403 Free PMC article.
-
Physiological mechanisms underlying animal social behaviour.Philos Trans R Soc Lond B Biol Sci. 2017 Aug 19;372(1727):20160231. doi: 10.1098/rstb.2016.0231. Philos Trans R Soc Lond B Biol Sci. 2017. PMID: 28673909 Free PMC article.
-
High-resolution behavioral time series of Japanese quail within their social environment.Sci Data. 2019 Dec 3;6(1):300. doi: 10.1038/s41597-019-0299-8. Sci Data. 2019. PMID: 31796742 Free PMC article.
References
-
- Alexander RD. 1974. The evolution of social behaviour. Annu. Rev. Ecol. Syst. 5, 325–383. (10.1146/annurev.es.05.110174.001545) - DOI
-
- Stacey PB. 1986. Group size and foraging efficiency in yellow baboons. Behav. Ecol. Sociobiol. 18, 175–187. (10.1007/BF00290821) - DOI
-
- Pays O, Beauchamp G, Carter AJ, Goldizen AW. 2013. Foraging in groups allows collective predator detection in a mammal species without alarm calls. Behav. Ecol. 24, 1229–1236. (10.1093/beheco/art057) - DOI
MeSH terms
LinkOut - more resources
Full Text Sources
Other Literature Sources
