Comparative Study
. 2017 Aug 18;292(33):13599-13614.
doi: 10.1074/jbc.M117.782276. Epub 2017 Jul 3.

Accumulation of autophagosomes confers cytotoxicity

Affiliations
Comparative Study

Accumulation of autophagosomes confers cytotoxicity

Robert W Button et al. J Biol Chem. .

Abstract

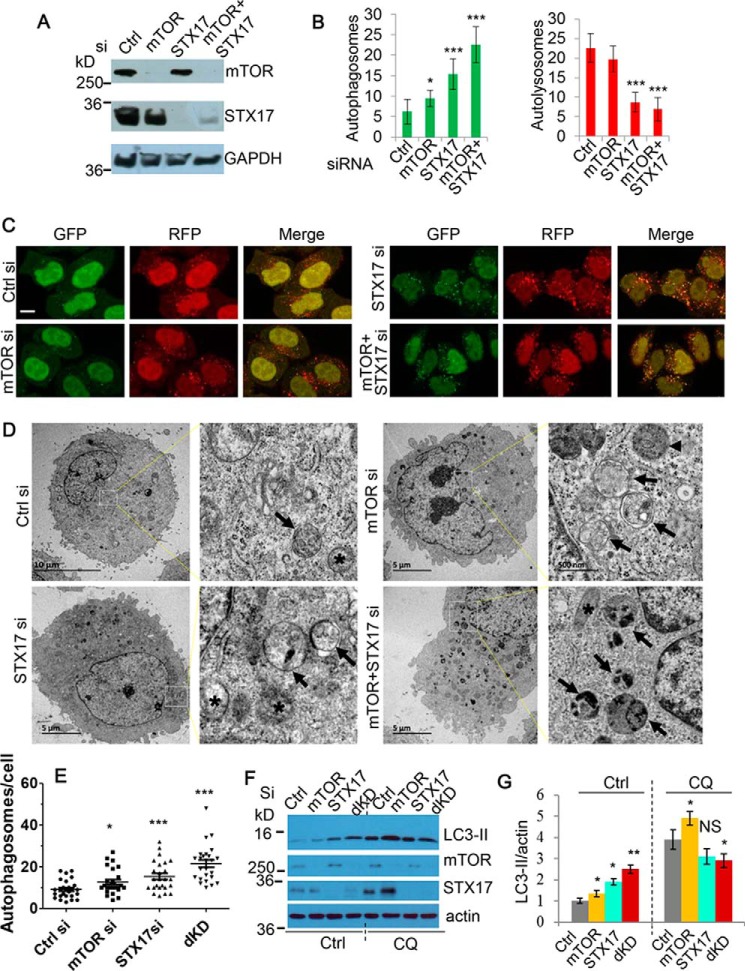
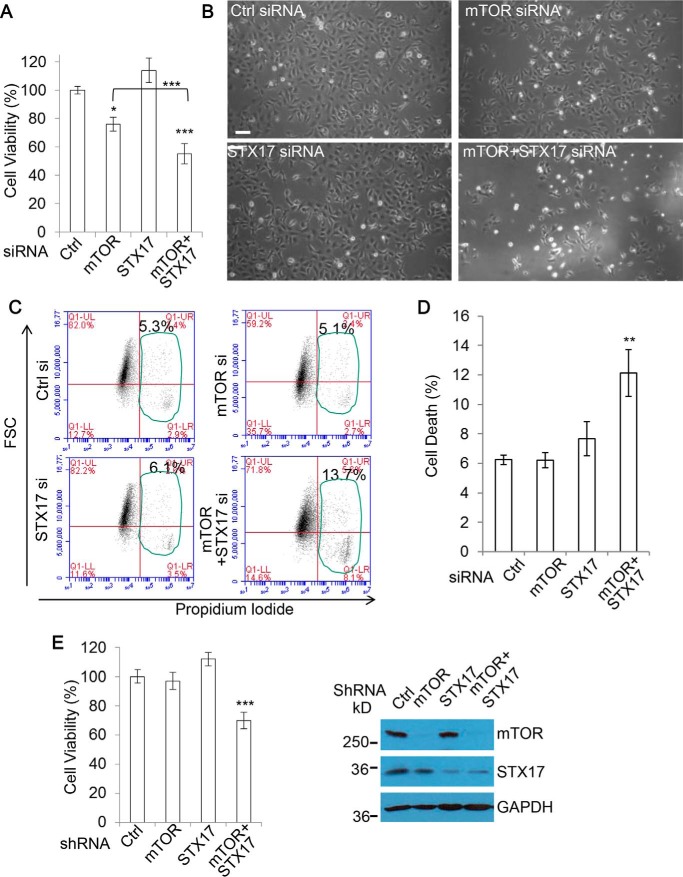
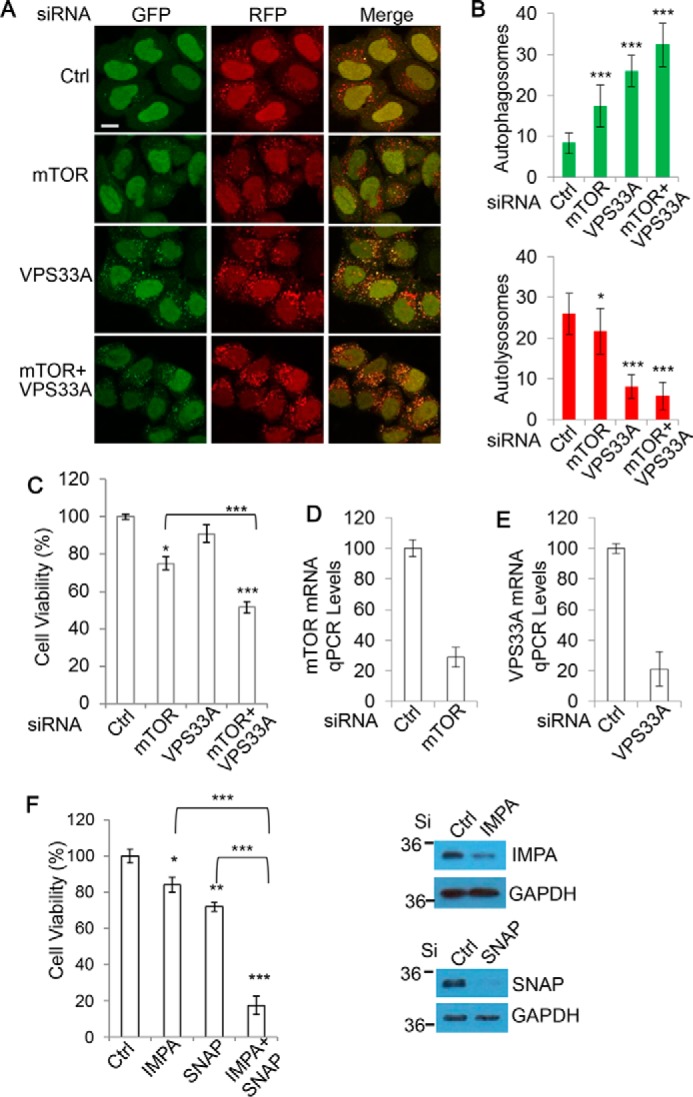
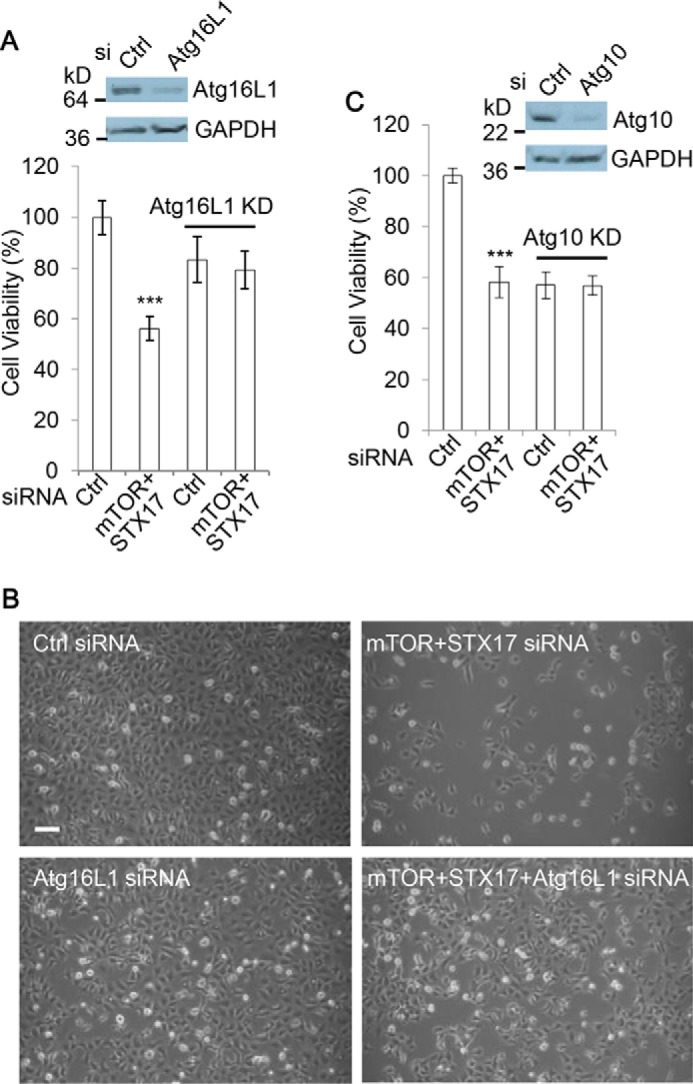
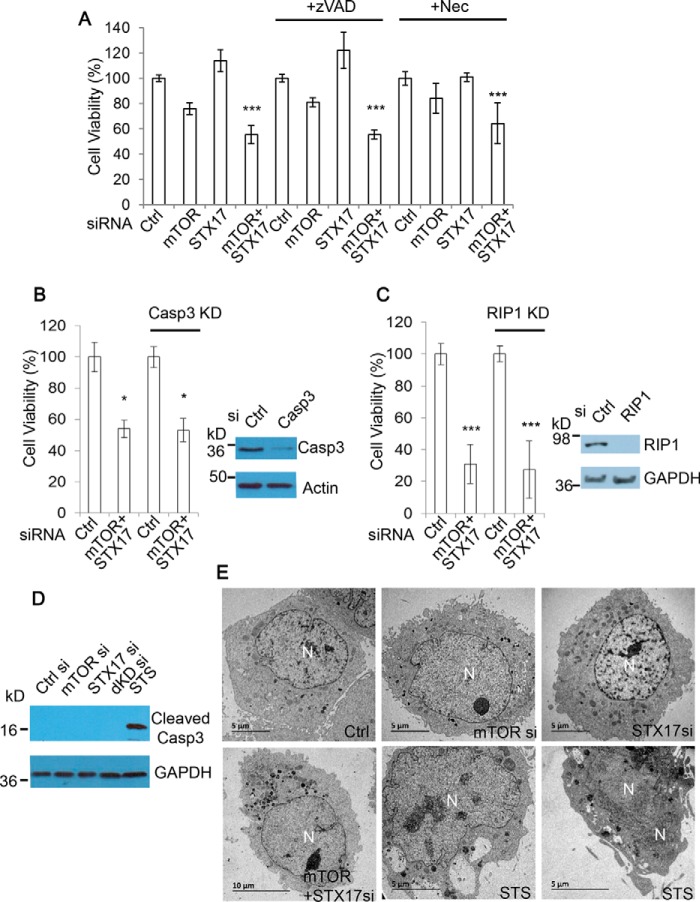
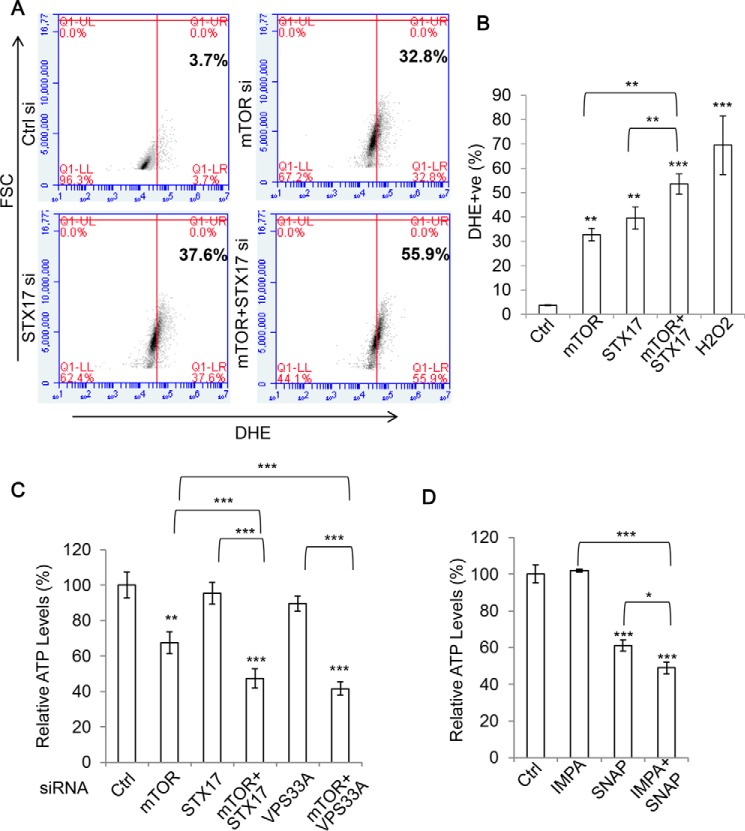
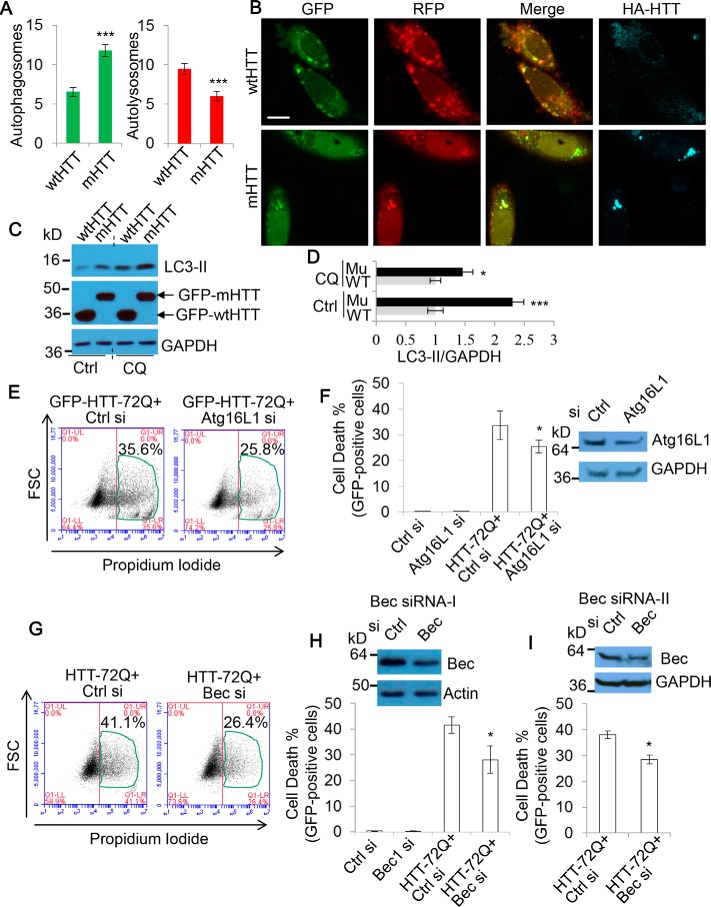
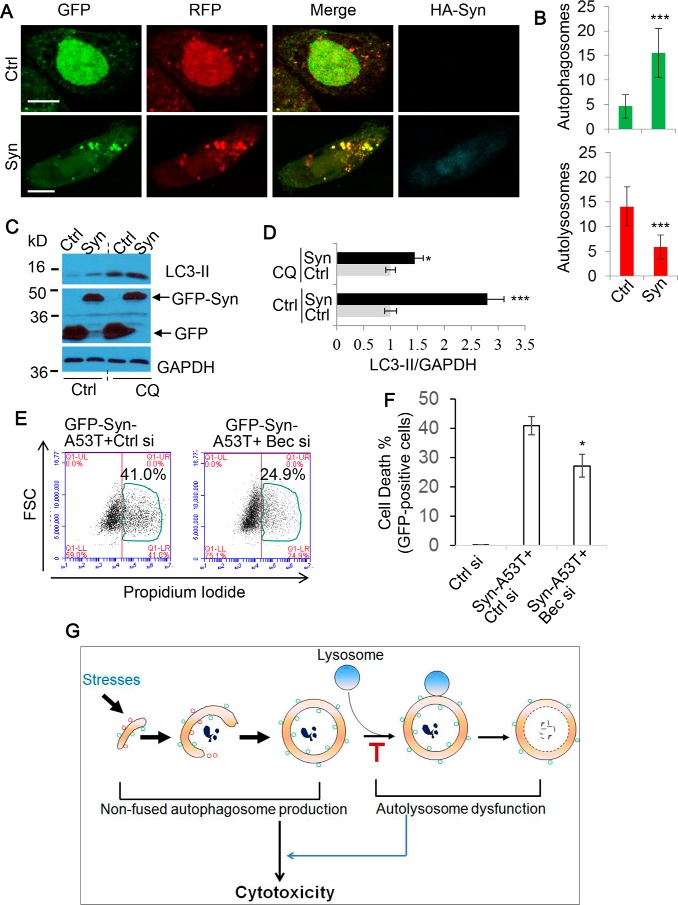
Autophagy comprises the processes of autophagosome synthesis and lysosomal degradation. In certain stress conditions, increased autophagosome synthesis may be associated with decreased lysosomal activity, which may result in reduced processing of the excessive autophagosomes by the rate-limiting lysosomal activity. Thus, the excessive autophagosomes in such situations may be largely unfused to lysosomes, and their formation/accumulation under these conditions is assumed to be futile for autophagy. The role of cytotoxicity in accumulating autophagosomes (representing synthesis of autophagosomes subsequently unfused to lysosomes) has not been investigated previously. Here, we found that accumulation of autophagosomes compromised cell viability, and this effect was alleviated by depletion of autophagosome machinery proteins. We tested whether reduction in autophagosome synthesis could affect cell viability in cell models expressing mutant huntingtin and α-synuclein, given that both of these proteins cause increased autophagosome biogenesis and compromised lysosomal activity. Importantly, partial depletion of autophagosome machinery proteins Atg16L1 and Beclin 1 significantly ameliorated cell death in these conditions. Our data suggest that production/accumulation of autophagosomes subsequently unfused to lysosomes (or accumulation of autophagosomes) directly induces cellular toxicity, and this process may be implicated in the pathogenesis of neurodegenerative diseases. Therefore, lowering the accumulation of autophagosomes may represent a therapeutic strategy for tackling such diseases.

Keywords: autophagy; cell death; lysosome; mTOR complex (mTORC); neurodegenerative disease.


Conflict of interest statement

The authors declare that they have no conflicts of interest with the contents of this article

Figures

Figure 1.
Figure 1.
Establishment of a model for production/accumulation of non-fused autophagosomes by simultaneous ablation of mTOR and STX-17. A, immunoblot was used to confirm the knockdown efficiency of mTOR and STX-17 siRNA transfection in HeLa cells over 72 h. B, mRFP-GFP-LC3 stably expressing HeLa cells were transfected with control, mTOR, STX-17, or mTOR + STX-17 siRNA for 72 h. The number of autophagosomes (green vesicles) and autolysosomes (red vesicles minus green vesicles) was assessed (n = 20 cells/condition). Data are shown as mean ± S.D. (error bars). *, p < 0.05; ***, p < 0.001. C, representative confocal images for the cells in B were collected. Scale bar, 20 μm. D, HeLa cells were transfected with siRNAs as indicated for 48 h. Images were acquired by TEM microscopy. Black arrows, indicate autophagosomes; arrowheads, autolysosomes; asterisks, mitochondria. E, quantification of autophagosomes in 25–26 cells for each condition. dKD, dual knockdown (mTOR/STX-17 siRNA). *, p < 0.05; ***, p < 0.001. F, HeLa cells were transfected as in B, with vehicle or CQ (25 μm) treatment for the last 24 h. Cell lysates were subjected to immunoblotting and probed with the indicated antibodies. G, LC3-II levels in F were quantified versus loading control (actin). Data are shown as mean -fold change ± S.D. (n = 3). *, p < 0.05; ***, p < 0.001; NS, not significant.
Figure 2.
Figure 2.
Dual mTOR/STX-17 knockdown causes cell viability loss. A, HEK293 cells were transfected with control, mTOR, STX-17, or mTOR + STX-17 siRNA for 72 h, and cell viability was measured with an MTT assay (n = 6 cells/condition). Data are shown as mean ± S.D. (error bars). *, p < 0.05; ***, p < 0.001. B, matching phase-contrast images were acquired. Scale bar, 100 μm. C, HEK293 cells were transfected as in A, and cell death was measured using propidium iodide staining in flow cytometry (n = 6/treatment). D, results from C are shown as mean ± S.D. **, p < 0.01. E, HEK293 cells were transfected with control, mTOR, STX-17, or mTOR + STX-17 shRNA for 72 h, and cell viability was measured (n = 6 cells/condition). Data are shown as mean ± S.D. ***, p < 0.001. Knockdown efficiency was confirmed by immunoblotting.
Figure 3.
Figure 3.
Increased synthesis/accumulation of non-fused autophagosomes through diverse targets widely induces cytotoxicity. A, HeLa cells stably expressing mRFP-GFP-LC3 were transfected with control, mTOR, Vps33A, or mTOR + Vps33A siRNA for 72 h. Cells were fixed, and confocal images were collected. Scale bar, 20 μm. B, the number of autophagosomes (green vesicles) and autolysosomes (red vesicles minus green vesicles) from A was assessed (n = 20 cells/condition). Data are shown as mean ± S.D. (error bars). *, p < 0.05; ***, p < 0.001. C, HEK293 cells were transfected as in A, and viability was measured with an MTT assay (n = 6 cells/condition). Data are shown as mean ± S.D. *, p < 0.05; ***, p < 0.001. D, knockdown efficiency for the mTOR siRNA was confirmed with qPCR. E, knockdown efficiency for the VPS33A siRNA was confirmed with qPCR. F, HEK293 cells were transfected with control, IMPA, SNAP29 (SNAP), or IMPA + SNAP siRNA for 72 h. Cell viability was measured with an MTT assay (n = 5 cells/condition). Data are shown as mean ± S.D. *, p < 0.05; **, p < 0.01; ***, p < 0.001. Knockdown efficiency was confirmed with immunoblotting.
Figure 4.
Figure 4.
Autophagosome synthesis is necessary for the viability loss by dual mTOR/STX-17 knockdown. A, HEK293 cells were transfected with control or mTOR + STX-17 siRNA in the absence or presence of Atg16L1 siRNA, as indicated, for 72 h. Cell viability was measured with an MTT assay (n = 6 cells/condition). Data are shown as mean ± S.D. (error bars). ***, p < 0.001. Knockdown efficiency was confirmed by immunoblotting. B, matching phase-contrast images were acquired. Scale bar, 100 μm. C, HEK293 cells were transfected with control or mTOR + STX-17 siRNA in the absence or presence of Atg10 siRNA, as indicated, for 72 h. Cell viability was measured with MTT assay (n = 6 cells/condition). Data are shown as mean ± S.D. ***, p < 0.001. Knockdown efficiency was confirmed by immunoblotting.
Figure 5.
Figure 5.
Accumulation of autophagosomes causes cell viability loss independent of apoptosis and necroptosis. A, HEK293 cells were transfected with control, mTOR, STX-17, or mTOR + STX-17 siRNA for 48 h and then treated with pan-caspase inhibitor Z-VAD-fmk (zVAD) (20 μm) or necroptosis inhibitor Nec (20 μm), as indicated, for a further 24 h. Cell viability was then measured with MTT assay (n = 6 cells/condition). Data are shown as mean ± S.D. (error bars). ***, p < 0.001. B, HEK293 cells were transfected with control or mTOR + STX-17 siRNA in the absence or presence of caspase-3 siRNA, as indicated, for 72 h. Cell viability was measured with an MTT assay (n = 6 cells/condition). Data are shown as mean ± S.D. *, p < 0.05. Knockdown efficiency was confirmed by immunoblotting. C, HEK293 cells were transfected with control or mTOR + STX-17 siRNA in the absence or presence of RIP1 siRNA, as indicated, for 96 h. Cell viability was measured with MTT assay (n = 6 cells/condition). Data are shown as mean ± S.D. ***, p < 0.001. Knockdown efficiency was confirmed by immunoblotting. D, HeLa cells were transfected with control, mTOR, STX-17, or mTOR + STX-17 (dKD) siRNA for 72 h and with the apoptosis inducer STS (1 μm) for 24 h as a positive control. Cell lysates were analyzed by immunoblot and probed with the indicated antibodies. E, HeLa cells were treated with siRNAs as indicated for 48 h or STS (1 μm) for 24 h. Images were acquired with TEM.
Figure 6.
Figure 6.
Accumulation of autophagosomes causes an increase in ROS while depleting ATP levels. A, HEK293 cells were transfected with control, mTOR, STX-17, or mTOR + STX-17 siRNA for 72 h, and ROS levels were measured in flow cytometry via dihydroethidium (DHE) staining (n = 3 cells/condition). B, data from A are shown as mean ± S.D. (error bars). Treatment with 1 mm H2O2 for 30 min was used as a positive control. **, p < 0.01; ***, p < 0.001. C, HEK293 cells were treated with control, mTOR, STX-17, mTOR + STX-17, VPS33A, or mTOR + VPS33A siRNA as indicated for 72 h, and ATP levels were measured via an ATP assay kit (Promega) (n = 6 cells/condition). Data are shown as mean ± S.D. **, p < 0.01; ***, p < 0.001. D, HEK293 cells were treated with control, IMPA, SNAP29 (SNAP), or IMPA + SNAP siRNA for 72 h, and ATP levels were measured as in C (n = 6/condition). Data are shown as mean ± S.D. *, p < 0.05; ***, p < 0.001.
Figure 7.
Figure 7.
Lowering accumulation of autophagosomes by partial depletion of autophagosome synthesis alleviates the toxicity of mutant huntingtin aggregation. A, SK-N-SH cells were transfected with mRFP-GFP-LC3 and either HA-tagged WT wtHTT or mHTT for 48 h. Cells were then fixed, stained for HA, and imaged with confocal microscopy. Scale bar, 20 μm. The numbers of autophagosomes (green vesicles) and autolysosomes (red vesicles minus green vesicles) were calculated (n = 30 cells/experiment). Counts are shown as mean ± S.E. (error bars). ***, p < 0.001. B, shown are representative confocal images in A. Note that autophagosomes co-localize with mHTT aggregates. C, HeLa cells were transfected with GFP-tagged wtHTT or mHTT. After 72 h, cells were harvested (one set of cells were treated with 25 μm CQ for 8 h, as indicated, before harvesting). The cell lysates were subjected to SDS-PAGE and probed with the indicated antibodies. D, LC3-II levels were quantified over GAPDH. Data are shown as -fold change ± S.D. (error bars). (n = 3). WT, GFP-wtHTT; Mu, GFP-mHTT. *, p < 0.05; ***, p < 0.001. E, SK-N-SH cells were transfected with GFP-HTT exon 1 with 72Q (HTT-72Q) and either control or Atg16L1 siRNA (10 nm) for 48 h (to partially knock down Atg16L1). GFP-positive cells were gated, and cell death was measured by flow cytometry via propidium iodide staining (n = 6 cells/condition). Shown is the percentage of propidium iodide and GFP–double-positive cells/GFP-positive cells. F, data from E are shown as mean ± S.D. (error bars). *, p < 0.05. Partial knockdown was confirmed by immunoblotting. G, SK-N-SH cells were transfected with GFP-HTT-72Q and either control or Beclin 1 siRNA (20 nm) (Bec siRNA-I) for 48 h (to partially knock down Beclin 1). GFP-positive cells were gated, and cell death was measured as in E (n = 6 cells/experiment). Shown is the percentage of propidium iodide and GFP–double-positive cells/GFP-positive cells. H, data are shown as mean ± S.D. (error bars). *, p < 0.05. Partial knockdown was confirmed with immunoblotting. I, SK-N-SH cells were transfected as in G using an alternative Beclin 1 siRNA (Bec siRNA-II). Cell death was measured as before (n = 3 cells/experiment). Data are shown as mean ± S.D. (error bars). *, p < 0.05. Partial knockdown was confirmed with immunoblotting.
Figure 8.
Figure 8.
Lowering accumulation of autophagosomes by partial depletion of autophagosome synthesis alleviates α-synuclein toxicity. A, SK-N-SH cells were transfected with mRFP-GFP-LC3 and either control (Ctrl) or synuclein (Syn) for 48 h. Cells were fixed, stained for HA, and imaged with confocal microscopy. Scale bars, 20 μm. B, the numbers of autophagosomes (green vesicles) and autolysosomes (red vesicles minus green vesicles) were calculated (n = 20 cells/experiment). Counts are shown as mean ± S.D. (error bars). ***, p < 0.001. C, HeLa cells were transfected with GFP or GFP–α-synuclein. After 72 h, cells were harvested (one set of cells were treated with 25 μm CQ for 8 h before harvesting). The cell lysates were subjected to SDS-PAGE and probed with the indicated antibodies. D, the ratios of LC3-II/GAPDH were quantified. Data are shown as -fold change ± S.D. (n = 3). *, p < 0.05; ***, p < 0.001. E, SK-N-SH cells were transfected with GFP-Syn-A53T and either control or Beclin 1 siRNA (20 nm) for 48 h. GFP-positive cells were gated, and cell death was measured by flow cytometry via propidium iodide staining (n = 6 cells/condition). Shown is the percentage of propidium iodide and GFP–double-positive cells/GFP-positive cells. F, data from E are shown as mean ± S.D. *, p < 0.05. G, proposed model of autophagosome accumulation-based toxicity. During periods of stress, autophagosome synthesis will be promoted. However, if autophagosome–lysosome fusion is rendered dysfunctional, further non-fused autophagosome synthesis is futile to the cell because autophagy cannot be completed. Therefore, the synthesis of non-fused autophagosomes is detrimental to cell survival by causing more strain on energy levels as well as a failure to clear potentially harmful toxins.

References

    1. Klionsky D. J. (2005) The molecular machinery of autophagy: unanswered questions. J. Cell Sci. 118, 7–18 - PMC - PubMed
    1. Rubinsztein D. C., Codogno P., and Levine B. (2012) Autophagy modulation as a potential therapeutic target for diverse diseases. Nat. Rev. Drug Discov. 11, 709–730 - PMC - PubMed
    1. Hosokawa N., Hara T., Kaizuka T., Kishi C., Takamura A., Miura Y., Iemura S., Natsume T., Takehana K., Yamada N., Guan J. L., Oshiro N., and Mizushima N. (2009) Nutrient-dependent mTORC1 association with the ULK1-Atg13-FIP200 complex required for autophagy. Mol. Biol. Cell 20, 1981–1991 - PMC - PubMed
    1. Hara T., Takamura A., Kishi C., Iemura S., Natsume T., Guan J. L., and Mizushima N. (2008) FIP200, a ULK-interacting protein, is required for autophagosome formation in mammalian cells. J. Cell Biol. 181, 497–510 - PMC - PubMed
    1. Itakura E., Kishi C., Inoue K., and Mizushima N. (2008) Beclin 1 forms two distinct phosphatidylinositol 3-kinase complexes with mammalian Atg14 and UVRAG. Mol. Biol. Cell 19, 5360–5372 - PMC - PubMed

Publication types

MeSH terms

LinkOut - more resources