. 2017 Jul 18;114(29):E5805-E5814.
doi: 10.1073/pnas.1704012114. Epub 2017 Jul 3.

Hepatic ZIP14-mediated zinc transport is required for adaptation to endoplasmic reticulum stress

Affiliations

Hepatic ZIP14-mediated zinc transport is required for adaptation to endoplasmic reticulum stress

Min-Hyun Kim et al. Proc Natl Acad Sci U S A. .

Abstract

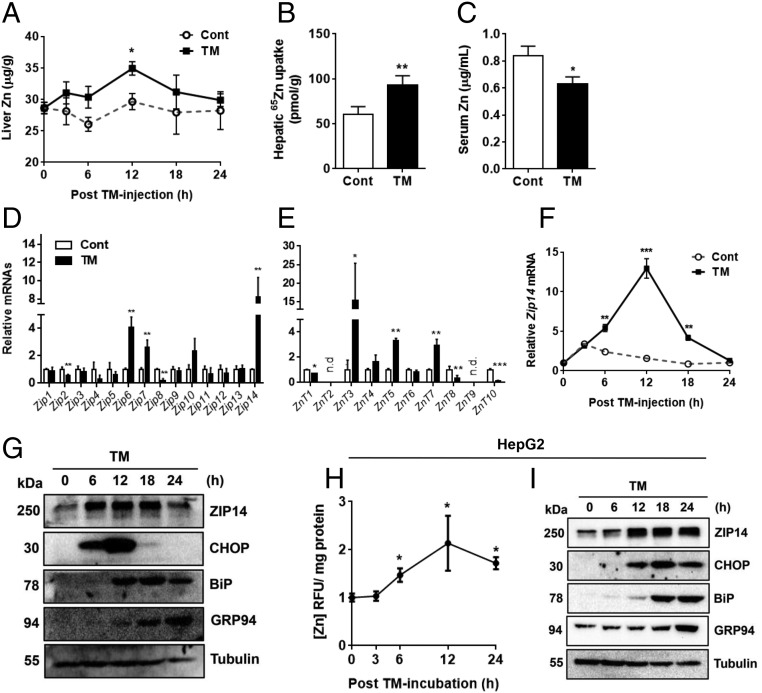
Extensive endoplasmic reticulum (ER) stress damages the liver, causing apoptosis and steatosis despite the activation of the unfolded protein response (UPR). Restriction of zinc from cells can induce ER stress, indicating that zinc is essential to maintain normal ER function. However, a role for zinc during hepatic ER stress is largely unknown despite important roles in metabolic disorders, including obesity and nonalcoholic liver disease. We have explored a role for the metal transporter ZIP14 during pharmacologically and high-fat diet-induced ER stress using Zip14-/- (KO) mice, which exhibit impaired hepatic zinc uptake. Here, we report that ZIP14-mediated hepatic zinc uptake is critical for adaptation to ER stress, preventing sustained apoptosis and steatosis. Impaired hepatic zinc uptake in Zip14 KO mice during ER stress coincides with greater expression of proapoptotic proteins. ER stress-induced Zip14 KO mice show greater levels of hepatic steatosis due to higher expression of genes involved in de novo fatty acid synthesis, which are suppressed in ER stress-induced WT mice. During ER stress, the UPR-activated transcription factors ATF4 and ATF6α transcriptionally up-regulate Zip14 expression. We propose ZIP14 mediates zinc transport into hepatocytes to inhibit protein-tyrosine phosphatase 1B (PTP1B) activity, which acts to suppress apoptosis and steatosis associated with hepatic ER stress. Zip14 KO mice showed greater hepatic PTP1B activity during ER stress. These results show the importance of zinc trafficking and functional ZIP14 transporter activity for adaptation to ER stress associated with chronic metabolic disorders.

Keywords: apoptosis; p-eIF2α/ATF4/CHOP pathway; steatosis; unfolded protein response; zinc metabolism.


Conflict of interest statement

The authors declare no conflict of interest.

Figures

Fig. 1.
Fig. 1.
TM-mediated ER stress increases hepatic zinc uptake and ZIP14. Hepatic Zn concentration (A) and 65Zn uptake (B) in mice (n = 3–4) are shown after administration of TM (2 mg/kg) or vehicle. (C) Serum Zn concentration in mice (n = 3–4) 18 h after administration of TM (2 mg/kg) or vehicle. Relative expression of members of the ZIP family (D) and ZnT family transporter (E) genes in the liver of mice (n = 3–4) are shown after administration of TM (2 mg/kg) or vehicle for 12 h. Time-dependent expression of Zip14 mRNA (n = 3–4) (F) and immunoblot analysis of ZIP14 and markers of ER stress (G) in liver lysates (n = 3–4, pooled samples) are shown after administration of TM or vehicle for the indicated times. (H) Total cellular Zn concentrations in HepG2 cells were determined by measurement of fluorescence after incubation with FluoZin3-AM (5 μM) following treatment with TM (1 μg/mL) or vehicle (n = 5). RFU, relative fluorescent unit. (I) Immunoblot analysis of ZIP14 and markers of ER stress in lysates of HepG2 cells after TM (1 μg/mL) or vehicle treatment. All data are represented as mean ± SD. *P < 0.05, **P < 0.01, ***P < 0.001. Cont, control.
Fig. S1.
Fig. S1.
Measurement of 65Zn uptake in plasma (A), pancreas (B), kidney (C), and white adipose tissue (WAT) (D) of WT and Zip14 KO mice (n = 3–4) is shown 12 h after administration of TM (2 mg/kg) or vehicle. Concentration of nonheme iron (E) and manganese (F) in livers of WT and Zip14 KO mice (n = 3–4) is shown 12 h after administration of TM (2 mg/kg) or vehicle. All data are represented as mean ± SD. Labeled means without a common letter differ significantly (P < 0.05). Cont, control.
Fig. S2.
Fig. S2.
(A) Hepatic Zn concentration in mice (n = 3) 6 h after administration of thapsigargin (TG; 1 mg/kg) or vehicle. (B) Immunoblot analysis of ZIP14 and BiP in liver lysates (n = 3) 6 h after administration of TG (1 mg/kg) or vehicle. All data are represented as mean ± SD. *P < 0.05.
Fig. 2.
Fig. 2.
ZIP14 KO mice show greater ER stress-induced apoptosis. (A) Immunoblot analysis of ZIP14 from liver lysates of WT and Zip14−/− (KO) mice 12 h after administration of TM (2 mg/kg) or vehicle. Hepatic Zn concentration (B) and 65Zn uptake (C) in WT and Zip14 KO mice (n = 3–4) are shown after administration of TM (2 mg/kg) or vehicle. (D) Immunoblot analysis of ER stress markers from liver lysates of WT and Zip14 KO mice (n = 3–4, pooled samples) after administration of TM (2 mg/kg). Individual blots (24 h after TM, n = 4) were quantified using digital densitometry to determine relative protein abundance. (E) Representative images of TUNEL assays of liver sections of WT and Zip14 KO mice 24 h after administration of TM (2 mg/kg) or vehicle. TUNEL-positive cells in fields were quantified. (Magnification: 40×.) (Scale bars: 25 μm.) (F) Serum alanine aminotransferase (ALT) activity of WT and Zip14 KO mice 24 h after administration of TM (2 mg/kg) or vehicle (n = 3–4). n.d., not detected. All data are represented as mean ± SD. *P < 0.05. Labeled means without a common letter differ significantly (P < 0.05).
Fig. S3.
Fig. S3.
(A) Relative expression of BiP and Chop in livers of WT and Zip14 KO mice (n = 3). (B) Immunoblot analysis of ZIP14 and ER stress markers in liver lysates of WT and Zip14 KO mice (n = 3). All data are represented as mean ± SD.
Fig. 3.
Fig. 3.
Supplementation with zinc rescues ER stress-induced apoptosis in Zip14 KD hepatocytes. (A) Total cellular Zn concentrations were determined by measurement of fluorescence after incubation with FluoZin3-AM (5 μM). HepG2 cells were treated with the indicated dose of zinc acetate and/or pyrithione (50 μM) for 30 min, which was followed by TM (1 μg/mL) or vehicle treatment for 12 h. (B) Immunoblot analysis of ZIP14 and ER stress markers from cell lysates. Zip14 siRNA-transfected or control siRNA-transfected HepG2 cells were incubated for 30 min with zinc acetate (5 μM) and pyrithione (50 μM), which was followed by a 24-h incubation with TM (1 μg/mL) or vehicle. Individual blots (lanes 3–6, n = 3) were quantified using digital densitometry to determine relative protein abundance. (C and D) Cell viability was measured using the 3-(4,5-dimethylthiazol-2-yl)-2,5-diphenyltetrazolium bromide assay. (C) Zip14 siRNA-transfected or control siRNA-transfected HepG2 cells were treated with TM (1 μg/mL) for 1 d or 2 d. (D) Cells were pretreated with zinc acetate (5 μM) and pyrithione (50 μM) for 30 min before TM (1 μg/mL) treatment for 18 h. All data are represented as mean ± SD. *P < 0.05. Labeled means without a common letter differ significantly (P < 0.05). Csi, control siRNA.
Fig. S4.
Fig. S4.
Relative expression of Zip14 (A), Atf4 (B), and Atf6α (C) mRNAs in HepG2 hepatocytes transfected with the indicated siRNAs. Csi, control siRNA.
Fig. 4.
Fig. 4.
Zip14 KO mice exhibit a greater level of hepatic TG accumulation after TM-induced ER stress. (A) Representative images of H&E-stained liver sections of WT and Zip14 KO mice 24 h after administration of TM (2 mg/kg) or vehicle. The lipid droplet area in the field was measured. (Magnification: 10×.) (Scale bars: 100 μm.) (B) Liver TG levels of WT and Zip14 KO mice were measured 24 h after administration of TM (2 mg/kg) or vehicle (n = 3–4). Relative expression of genes that regulate FA synthesis (C) and FA β-oxidation, FA uptake, and lipoprotein secretion (D) were measured in livers of WT and Zip14 KO mice 12 h after administration of TM (2 mg/kg) or vehicle (n = 3–4). All data are represented as mean ± SD. Labeled means without a common letter differ significantly (P < 0.05).
Fig. 5.
Fig. 5.
HFD-fed Zip14 KO mice show greater hepatic ER stress-induced apoptosis and TG accumulation. Mice were fed the HFD or a chow diet for 16 wk. (A) Relative gene expression of members of the ZIP family transporter in WT mice (n = 4). (B) Immunoblot analysis of ZIP14 from liver lysates of WT and KO mice. (C) Hepatic Zn concentration of WT and Zip14 KO mice (n = 4). (D) Immunoblot analysis of ER stress markers from liver lysates of WT and KO mice (n = 4, pooled samples used). Individual blots (HFD, n = 4) were quantified using digital densitometry to determine relative protein abundance. (E) Liver TG levels were quantified in WT and Zip14 KO mice (n = 4). (F) Relative expression of genes that regulate FA synthesis were measured in livers of WT and Zip14 KO mice (n = 4). All data are represented as mean ± SD. *P < 0.05. Labeled means without a common letter differ significantly (P < 0.05).
Fig. 6.
Fig. 6.
ZIP14 is required to suppress hepatic PTP1B activity after TM administration and the HFD. Immunoblot analysis of PTP1B and ER stress markers (A) and measurement of cell viability using the MTT assay (B) in HepG2 hepatocytes transfected with Ptp1b siRNA or control siRNA are shown. Cells were treated with TM (1 μg/mL) or vehicle for 24 h. In A, individual blots (TM, n = 3) were quantified using digital densitometry to determine relative protein abundance. Immunoblot analysis of PTP1B protein (C) and measurement of PTP1B activity (D) in livers of WT and Zip14 KO mice are shown 12 h after administration of TM (2 mg/kg) or vehicle (n = 3–4, pooled samples used for C). Analysis of PTP1B protein (E) and measurement of PTP1B activity (F) in livers of WT and Zip14 KO mice fed with HFD or chow for 16 wk (n = 4, pooled samples used for E) are shown. Immunoblot analysis of PTP1B protein (G) and measurement of PTP1B activity (H) in HepG2 hepatocytes transfected with Zip14 siRNA or control siRNA are shown. Cells were pretreated with zinc acetate (5 μM) and pyrithione (50 μM) for 30 min before TM (1 μg/mL) treatment for 12 h. (I) Proposed model for ZIP14-mediated zinc transport and inhibition of PTP1B activity. All data are represented as mean ± SD. Labeled means without a common letter differ significantly (P < 0.05).
Fig. 7.
Fig. 7.
Zip14 is transcriptionally regulated by ATF4 and ATF6α in a time-dependent manner during TM treatment. (A) Relative expression of Zip14 mRNA in HepG2 cells treated with TM (1 μg/mL) and/or actinomycin D (Act D; 2 μg/mL) for 12 h. (B) Relative expression of Zip14 mRNA and heterogeneous nuclear RNA (hnRNA) in HepG2 cells treated with TM (1 μg/mL) or vehicle. (C) Consensus motif of CRE and binding motifs of ATF4 and ATF6. (D) Sequence of mouse and human Zip14 promoter regions (from −120 to +1). Identical nucleotides are indicated by an asterisk. The TGACG sequence (from −94 to −89) is marked by a box. Relative expression of Zip14 mRNA in TM-treated HepG2 cells (1 μg/mL) after transfection with control siRNA, Atf4 siRNA (E), or Atf6α siRNA (G) is shown. Enrichment of DNA bound to ATF4 antibody (F) or ATF6α antibody (H) was measured by quantitative real-time PCR after ChIP assays in TM-treated HepG2 cells (1 μg/mL). Nonspecific rabbit IgG antibody was used as a negative control. (I) Immunoblot analysis of ATF4 and full-length and cleaved ATF6α in TM-treated HepG2 cells (1 μg/mL). All data are represented as mean ± SD. *P < 0.05, **P < 0.01.
Fig. 8.
Fig. 8.
Role of ZIP14-mediated zinc transport in ER stress adaptation. Based on the data in this report, we propose a cycle where ER stress sequentially increases expression of ATF4 and ATF6α. The transcription factors increase transcription of Zip14, leading to increased ZIP14 in hepatocytes. Enhanced transporter activity increases intracellular zinc concentration, leading to inhibition of PTP1B activity.

Similar articles

Cited by

References

    1. Ellgaard L, Helenius A. Quality control in the endoplasmic reticulum. Nat Rev Mol Cell Biol. 2003;4:181–191. - PubMed
    1. Nair S, et al. Toxicogenomics of endoplasmic reticulum stress inducer tunicamycin in the small intestine and liver of Nrf2 knockout and C57BL/6J mice. Toxicol Lett. 2007;168:21–39. - PMC - PubMed
    1. Zhang X, et al. Endoplasmic reticulum stress induced by tunicamycin and thapsigargin protects against transient ischemic brain injury: Involvement of PARK2-dependent mitophagy. Autophagy. 2014;10:1801–1813. - PMC - PubMed
    1. Ji C, Kaplowitz N. Betaine decreases hyperhomocysteinemia, endoplasmic reticulum stress, and liver injury in alcohol-fed mice. Gastroenterology. 2003;124:1488–1499. - PubMed
    1. Zhang K, Kaufman RJ. From endoplasmic-reticulum stress to the inflammatory response. Nature. 2008;454:455–462. - PMC - PubMed

Publication types

MeSH terms