. 2017 Jul 18;114(29):7719-7724.
doi: 10.1073/pnas.1618656114. Epub 2017 Jul 3.

LGI1 tunes intrinsic excitability by regulating the density of axonal Kv1 channels

Affiliations

LGI1 tunes intrinsic excitability by regulating the density of axonal Kv1 channels

Michael Seagar et al. Proc Natl Acad Sci U S A. .

Abstract

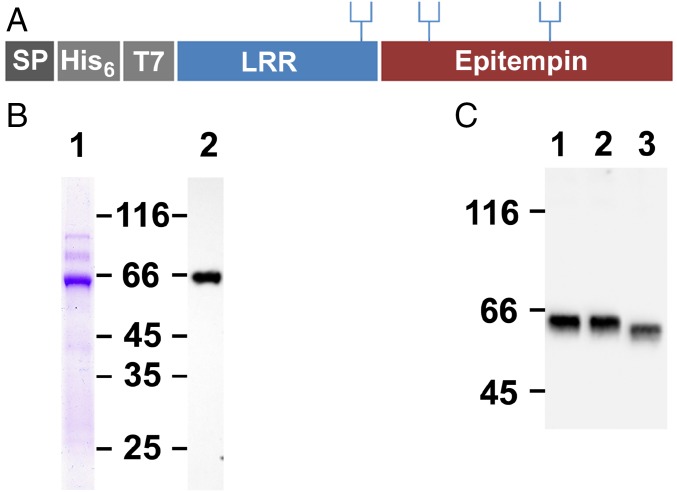
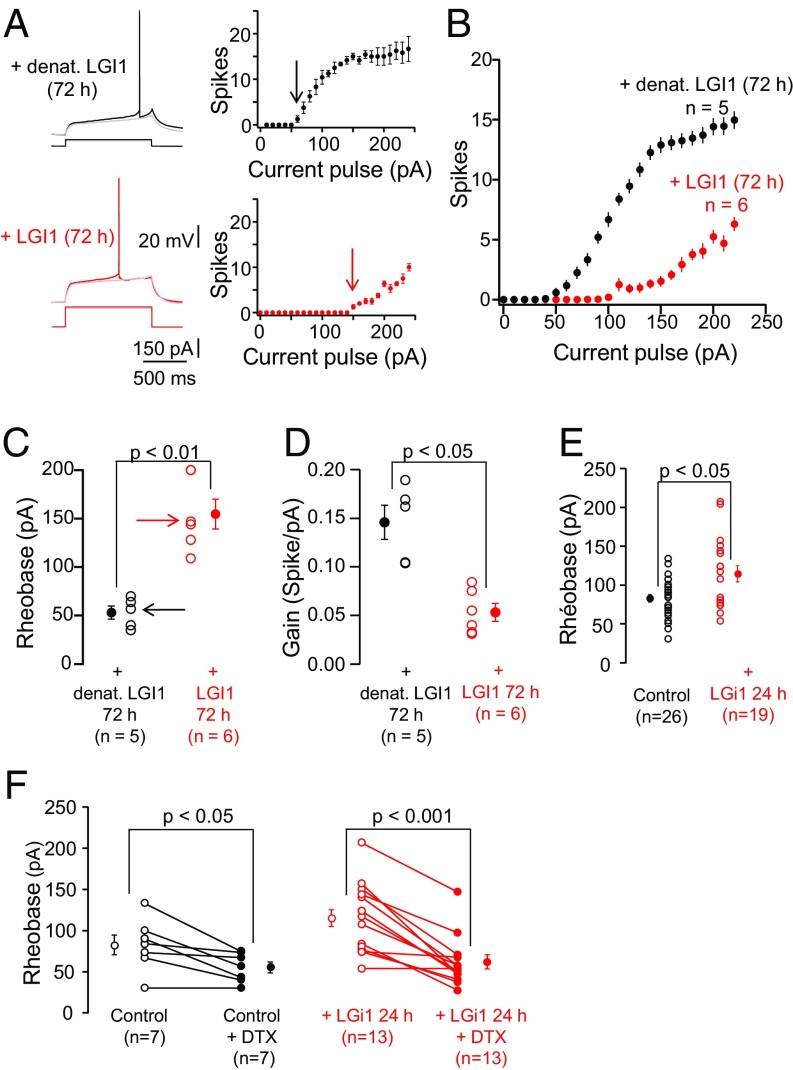
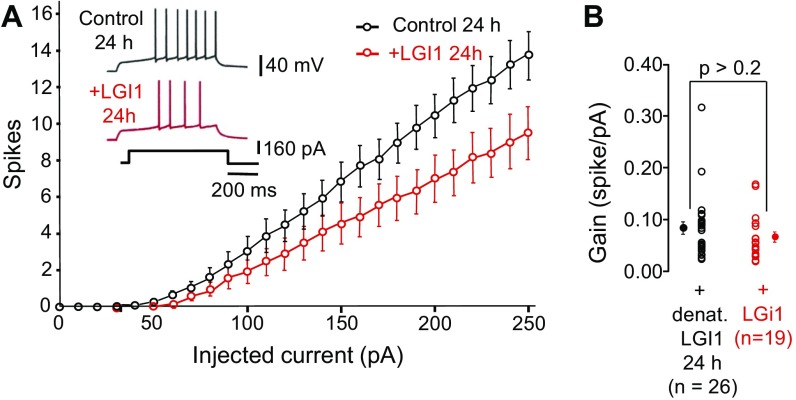
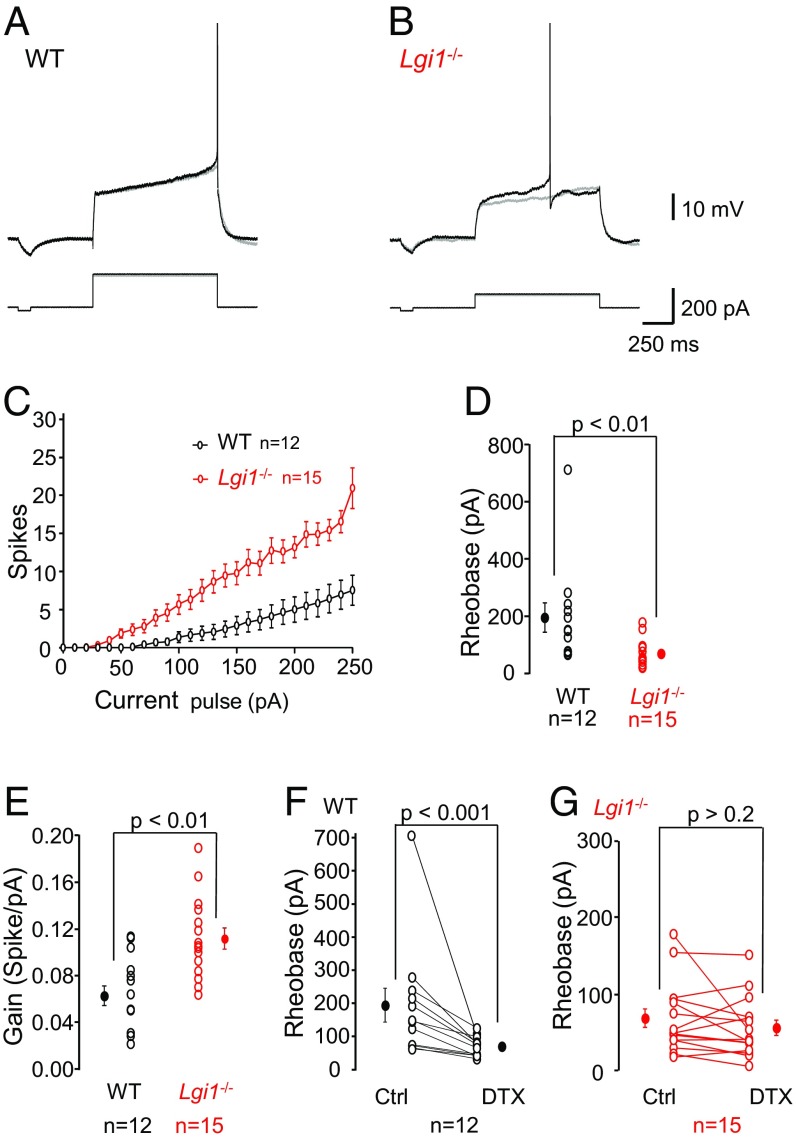
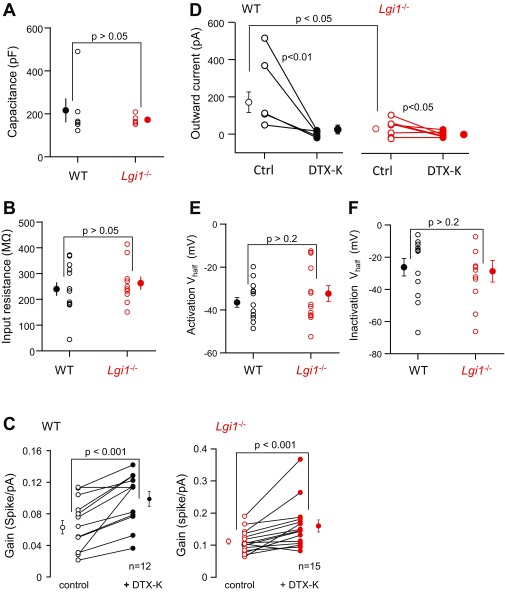
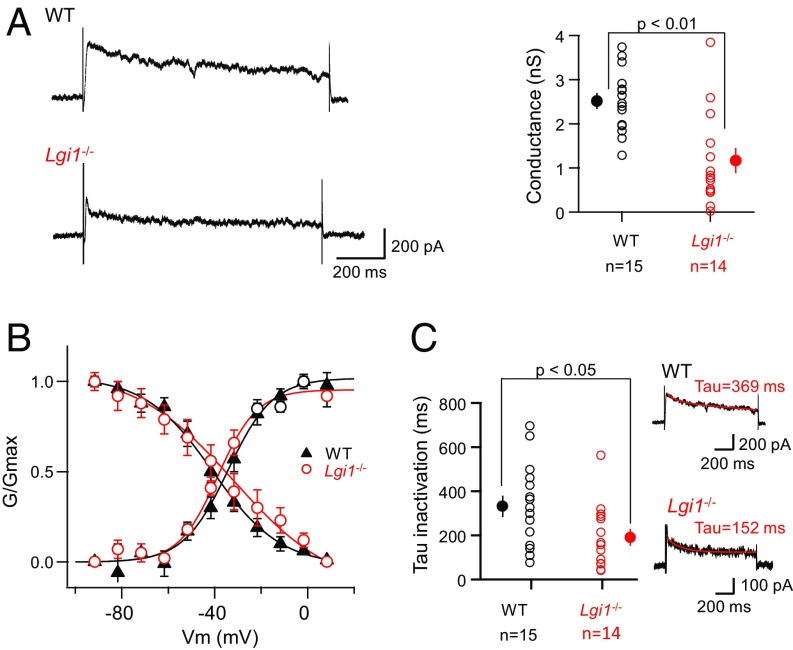
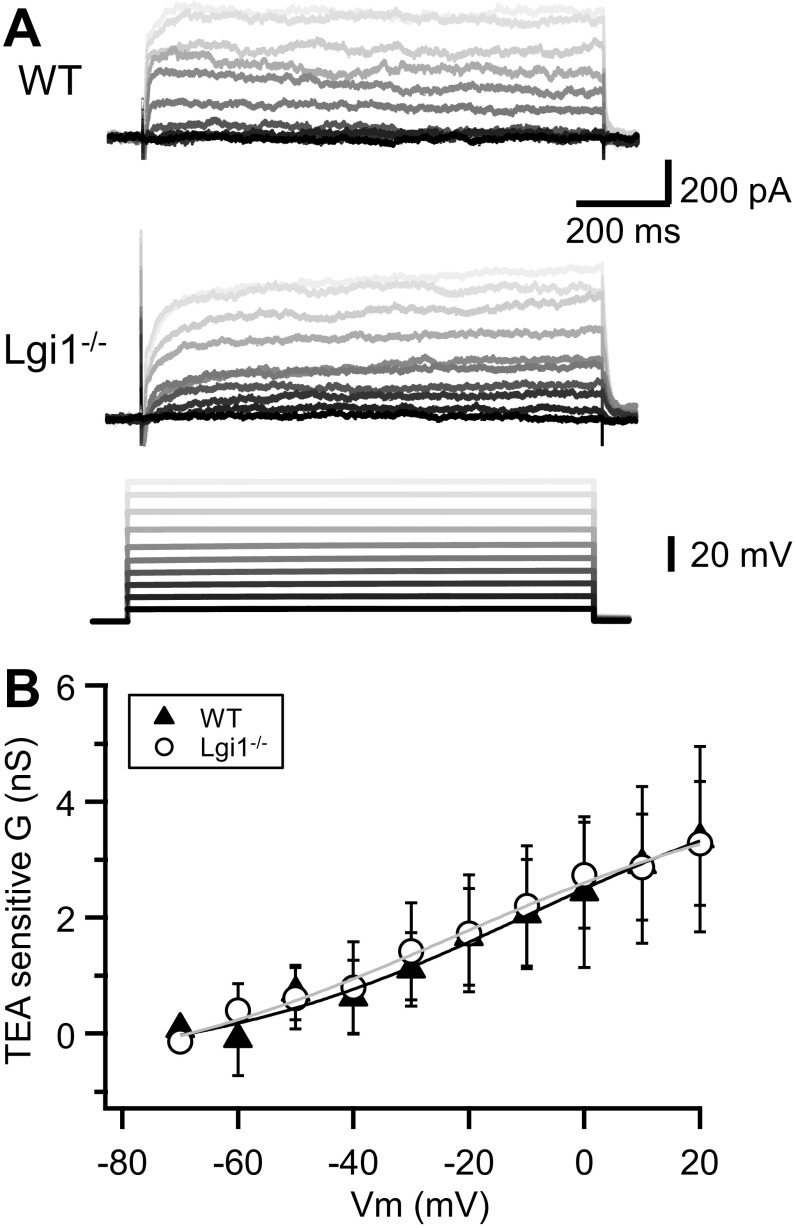
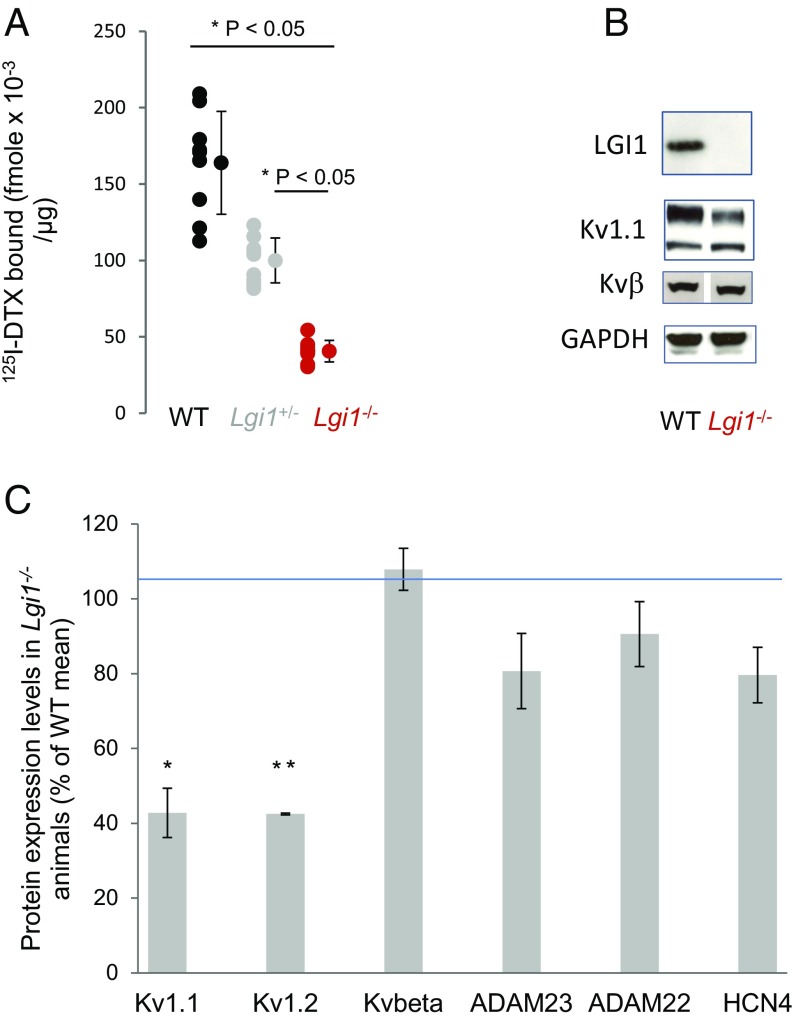
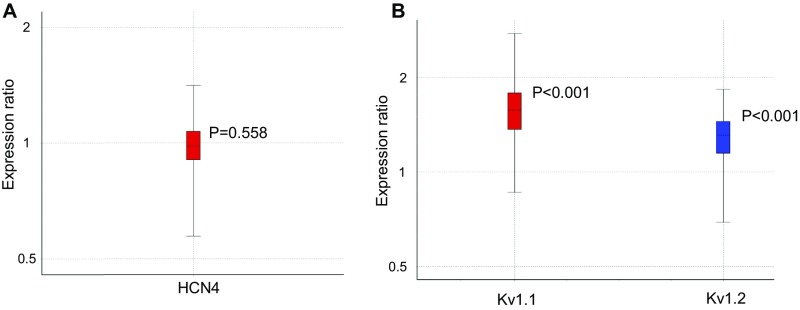
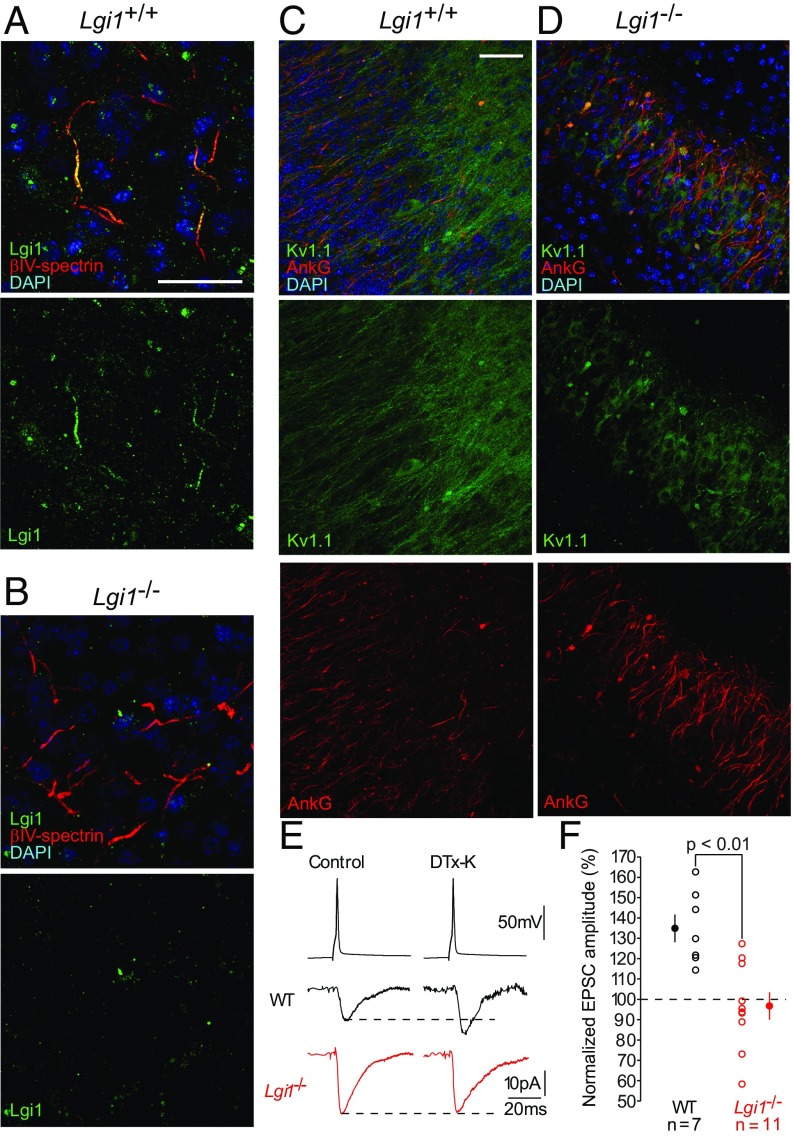
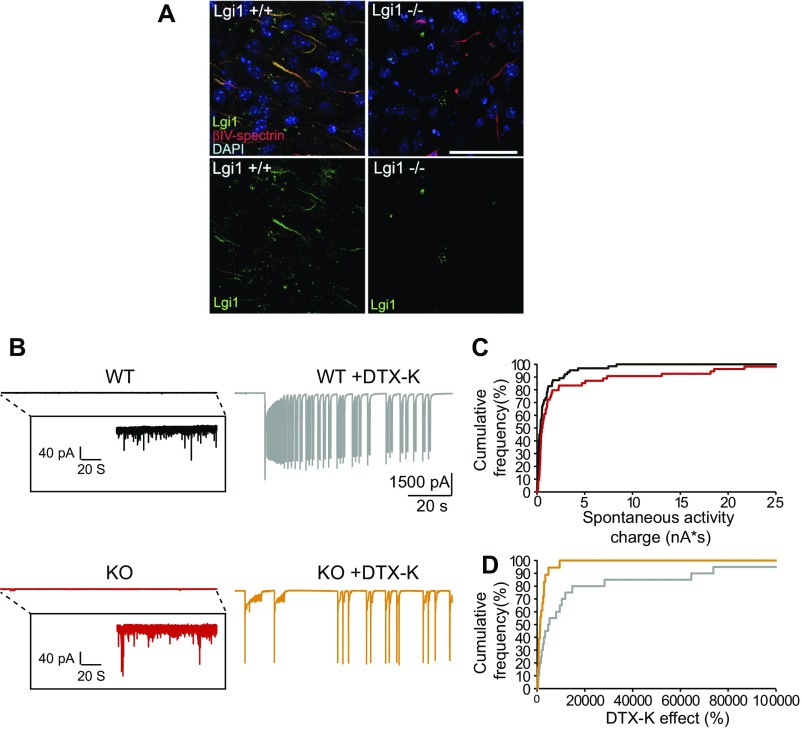
Autosomal dominant epilepsy with auditory features results from mutations in leucine-rich glioma-inactivated 1 (LGI1), a soluble glycoprotein secreted by neurons. Animal models of LGI1 depletion display spontaneous seizures, however, the function of LGI1 and the mechanisms by which deficiency leads to epilepsy are unknown. We investigated the effects of pure recombinant LGI1 and genetic depletion on intrinsic excitability, in the absence of synaptic input, in hippocampal CA3 neurons, a classical focus for epileptogenesis. Our data indicate that LGI1 is expressed at the axonal initial segment and regulates action potential firing by setting the density of the axonal Kv1.1 channels that underlie dendrotoxin-sensitive D-type potassium current. LGI1 deficiency incurs a >50% down-regulation of the expression of Kv1.1 and Kv1.2 via a posttranscriptional mechanism, resulting in a reduction in the capacity of axonal D-type current to limit glutamate release, thus contributing to epileptogenesis.

Keywords: D-type current; Kv1 channels; LGI1; epilepsy; intrinsic excitability.


Conflict of interest statement

The authors declare no conflict of interest.

Figures

Fig. 1.
Fig. 1.
Recombinant expression of LGI1. (A) Schematic representation of recombinant glycosylated LGI1 with signal peptide SP, His6, and T7 tags, leucine-rich region (LRR), and epitempin domain. (B) SDS/PAGE of purified LGI1: Coomassie blue-stained LGI1 (lane 1; 1 μg) and Western blot (0.1 μg) probed with anti-LGI1 (lane 2). (C) Western blots of 0.1 μg of purified LGI1 (lane 1) incubated in PNGase buffer (lanes 2 and 3) in the absence (lane 2) or presence of PNGase (lane 3) probed with anti-T7 antibody. To optimize protein resolution, the gel in C was run for a longer time than in B.
Fig. 2.
Fig. 2.
Exogenous LGI1 reduces the intrinsic excitability of hippocampal CA3 neurons. (A) Representative neurons from rat hippocampal slice cultures, treated for 72 h with 100 nM heat-denatured (Top) or native (Bottom) LGI1, recorded under current clamp. (Right) Input–output curves illustrating the number of action potentials elicited plotted against injected current for each neuron. Gray and pink traces represent maximal injected currents that did not elicit an action potential and the corresponding responses upon treatment with native and denatured LGI1, respectively. Black and red arrows indicate threshold currents. (B) Averaged input–output curves. (C) Rheobase; arrows indicate representative neurons in A. (D) Gain in WT and Lgi1−/−. (E) Rheobase of neurons treated ±100 nM LGI1 for 24 h. (F) In some cells DTX-K (100 nM) was bath applied and the effects on rheobase were determined. Error bars represent SEM.
Fig. S1.
Fig. S1.
Effect of recombinant LGI1 applied for 24 h in rat CA3 neurons. (A) Input–output curves for CA3 neurons treated for 24 h with LGI1 (red) and heat-denatured LGI1 (black). Note the decrease in excitability in LGI1. (B) Lack of effect on the gain. Error bars represent SEM. denat., condition using denatured LGI1.
Fig. 3.
Fig. 3.
Increased intrinsic excitability in CA3 neurons from Lgi1−/− mice. (A and B) Representative traces from CA3 neurons of (A) WT and (B) Lgi1/− mice. Gray traces represent maximal injected currents that did not elicit an action potential and the corresponding responses in WT and Lgi1−/− cells. (C) The number of evoked action potentials was plotted against injected current and the (D) rheobase and (E) gain were calculated. (F and G) The effects of DTX-K (100 nM) on the rheobase in (F) WT and (G) Lgi1−/− neurons were determined. Error bars represent SEM. Ctrl, recording conditions in the absence of DTX.
Fig. S2.
Fig. S2.
Comparison of electrophysiological parameters in WT and Lgi1−/− neurons. (A and B) No change in capacitance (A) nor in input resistance (B) were observed between WT and Lgi1−/− neurons. (C) DTX-K increased equally the gain in WT and Lgi1−/− neurons. (D) Comparison of the outward currents evoked by a step to −30 mV in WT and Lgi1−/− neurons. Ctrl, control. Note the strong decrease of the outward current in the presence of DTX-K. (E and F) Comparison of steady-state half-activation and half-inactivation of the DTX-K–sensitive current in WT and Lgi1−/− neurons. Error bars represent SEM.
Fig. 4.
Fig. 4.
Reduced D-type conductance in Lgi1−/− neurons. (A, Left) Representative traces of D-type current evoked by a voltage step to −30 mV in CA3 neurons from WT (Upper) and Lgi1−/− (Lower) mice. (Right) Comparison of the conductance in WT and Lgi1−/− mice. (B) Steady-state inactivation properties in WT and Lgi1−/− mice. (C) Inactivation kinetics of the D-current were compared. Red, fit curves generated using the following formula: [y = A + (A0 − A)*e(−t/tau)] where A, the calculated amplitude after infinite time in picoamperes ; A0, initial amplitude value in picoamperes; t, time in milliseconds; tau, time constant in milliseconds (with A = 168 pA and A0 = 358 pA in WT and A = 85 pA and A0 = 177 pA in Lgi1−/−). Error bars represent SEM.
Fig. S3.
Fig. S3.
TEA-sensitive current is not affected in Lgi1−/− neurons. (A) Family of TEA-sensitive voltage-gated currents in neurons from WT (Top) and Lgi1−/− (Middle) mice evoked by depolarizing steps from −80 to +20 mV (Bottom). (B) Plot of the TEA-sensitive conductance in neurons from WT and Lgi1−/− mice. No difference was observed between the two groups. Error bars represent SEM.
Fig. 5.
Fig. 5.
Reduced Kv1.1 expression in Lgi1−/−. (A) Specific binding of 0.1 nM 125I-DTX to brain P2 membranes, determined in the presence or absence of 0.1 µM DTX-K. (B) Representative blots and (C) quantification of protein expression in postnuclear brain homogenates. *P ≤ 0.05, **P ≤ 0.01. Error bars represent SD.
Fig. S4.
Fig. S4.
qPCR analysis of Kv1.1 and Kv1.2 expression in Lgi1−/−. (A and B) Statistical Rest 2009 whisker plot representing the (A) expression ratio of HCN4 mRNA between WT and Lgi1−/− mice using HPRT as control mRNA and (B) expression ratio of Kv1.1 and Kv1.2 mRNA between WT and Lgi1−/− mice using HCN4 and HPRT as control mRNAs. Error bars represent SD.
Fig. 6.
Fig. 6.
Axonal LGI1 regulates excitatory neurotransmission via presynaptic D-type current. (A and B) Representative images from WT and Lgi1−/− brain sections. (A and B) CA3 neurons from WT and Lgi1−/− animals stained with antibodies against the axon initial segment marker βIV-spectrin (red) and LGI1 (green). (Scale bar, 50 µm.) LGI1 staining is detected at axon initial segment in WT mice, whereas no staining is detected in Lgi1−/−. (C and D) CA3 region in WT (C) and Lgi1−/− slices (D) stained with antibodies against the axon initial segment marker ankyrinG (red) and Kv1.1 (green). (Scale bar, 100 µm.) (E and F) Representative synaptic recordings from paired CA3 neurons to evaluate the effects of DTX-K on EPSC amplitude in WT and Lgi1−/− animals (E) and data analysis (F). Error bars represent SEM.
Fig. S5.
Fig. S5.
DTX-K differentially enhances spontaneous EPSC activity in WT compared with Lgi1−/− neurons. (A) Cortical sections were stained with DAPI and antibodies against the axon initial segment marker βIV-spectrin (red) and LGI1 (green). (Scale bar, 50 μm.) LGI1 staining is detected at axon initial segment in WT mice, whereas no staining is detected in Lgi1−/−. (B, Left) Comparison of recordings from WT and Lgi1−/− (note the greater spontaneous activity in the Lgi1−/−). (Right) DTX-K induced a much stronger increase in spontaneous currents in WT compared with Lgi1−/− neurons. (C) Comparison of the inward synaptic charge in WT (black) and Lgi1−/− (red) neurons. Note the larger spontaneous activity in Lgi1−/− compared with WT that is seen as a rightward shift in the cumulative frequency plot (P < 0.01, Mann–Whitney U test). (D) Comparison of the enhancement of synaptic drive induced by 100 nM DTX-K in WT vs. Lgi1−/− (P < 0.01, Mann–Whitney U test). Note the larger increase in activity induced by DTX-K in WT compared with Lgi1−/− seen as a rightward shift in the cumulative frequency plot.

References

    1. Kalachikov S, et al. Mutations in LGI1 cause autosomal-dominant partial epilepsy with auditory features. Nat Genet. 2002;30:335–341. - PMC - PubMed
    1. Morante-Redolat JM, et al. Mutations in the LGI1/Epitempin gene on 10q24 cause autosomal dominant lateral temporal epilepsy. Hum Mol Genet. 2002;11:1119–1128. - PubMed
    1. Cowell JK. LGI1: From zebrafish to human epilepsy. Prog Brain Res. 2014;213:159–179. - PubMed
    1. Kegel L, Aunin E, Meijer D, Bermingham JR. LGI proteins in the nervous system. ASN Neuro. 2013;5:167–181. - PMC - PubMed
    1. Chabrol E, et al. Electroclinical characterization of epileptic seizures in leucine-rich, glioma-inactivated 1-deficient mice. Brain. 2010;133:2749–2762. - PMC - PubMed

Publication types

MeSH terms