. 2017 Jul 18;114(29):7635-7640.
doi: 10.1073/pnas.1705769114. Epub 2017 Jul 3.

Quantification of habitat fragmentation reveals extinction risk in terrestrial mammals

Affiliations

Quantification of habitat fragmentation reveals extinction risk in terrestrial mammals

Kevin R Crooks et al. Proc Natl Acad Sci U S A. .

Abstract

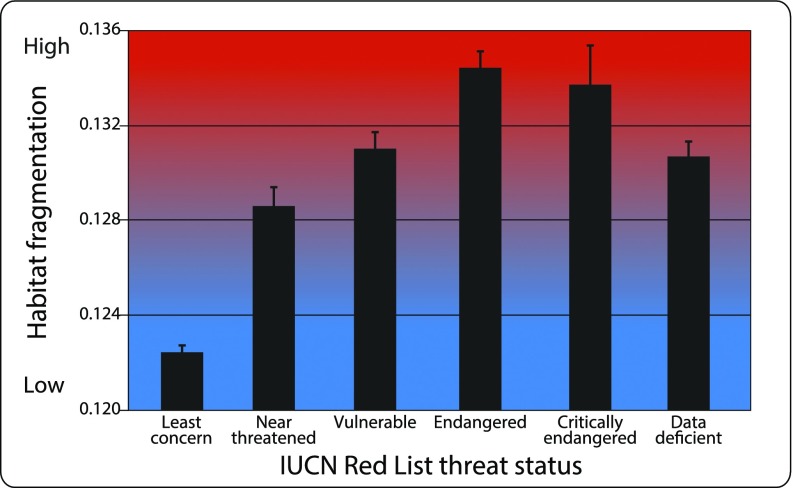
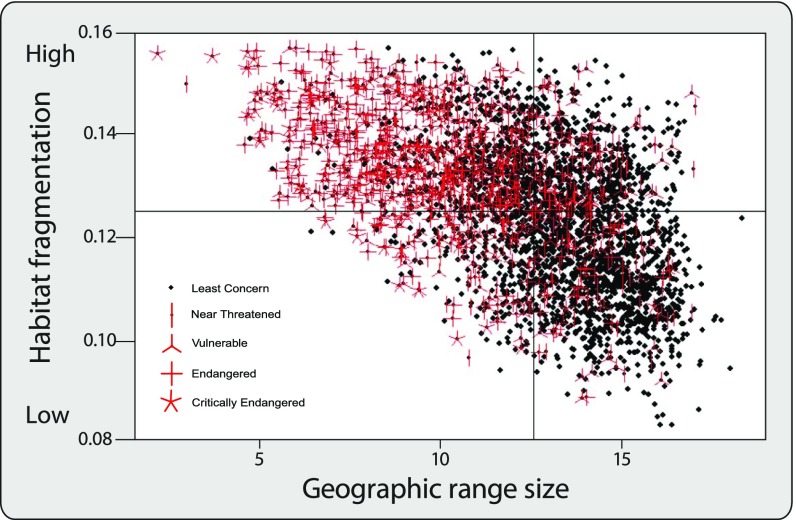
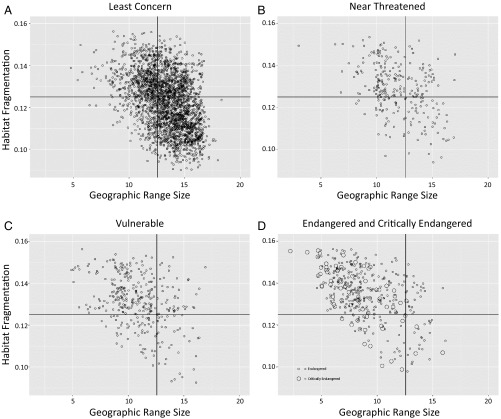
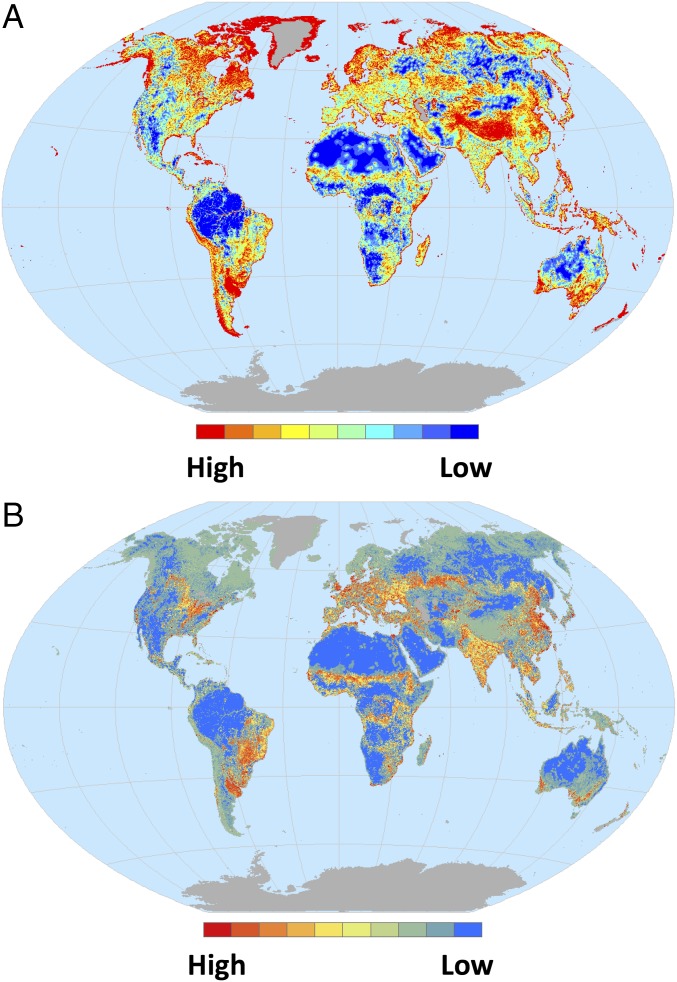
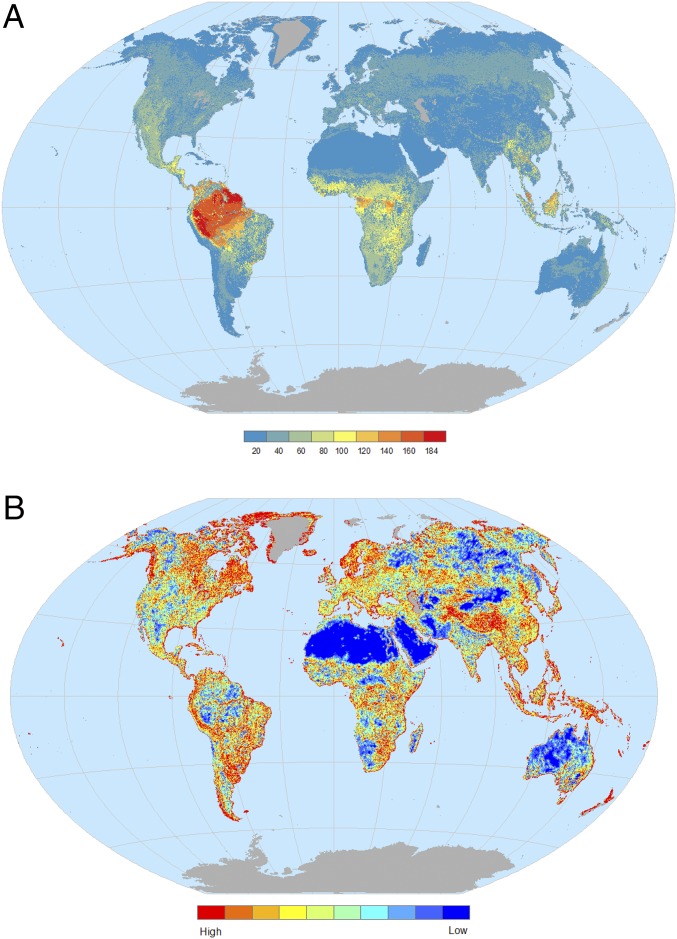
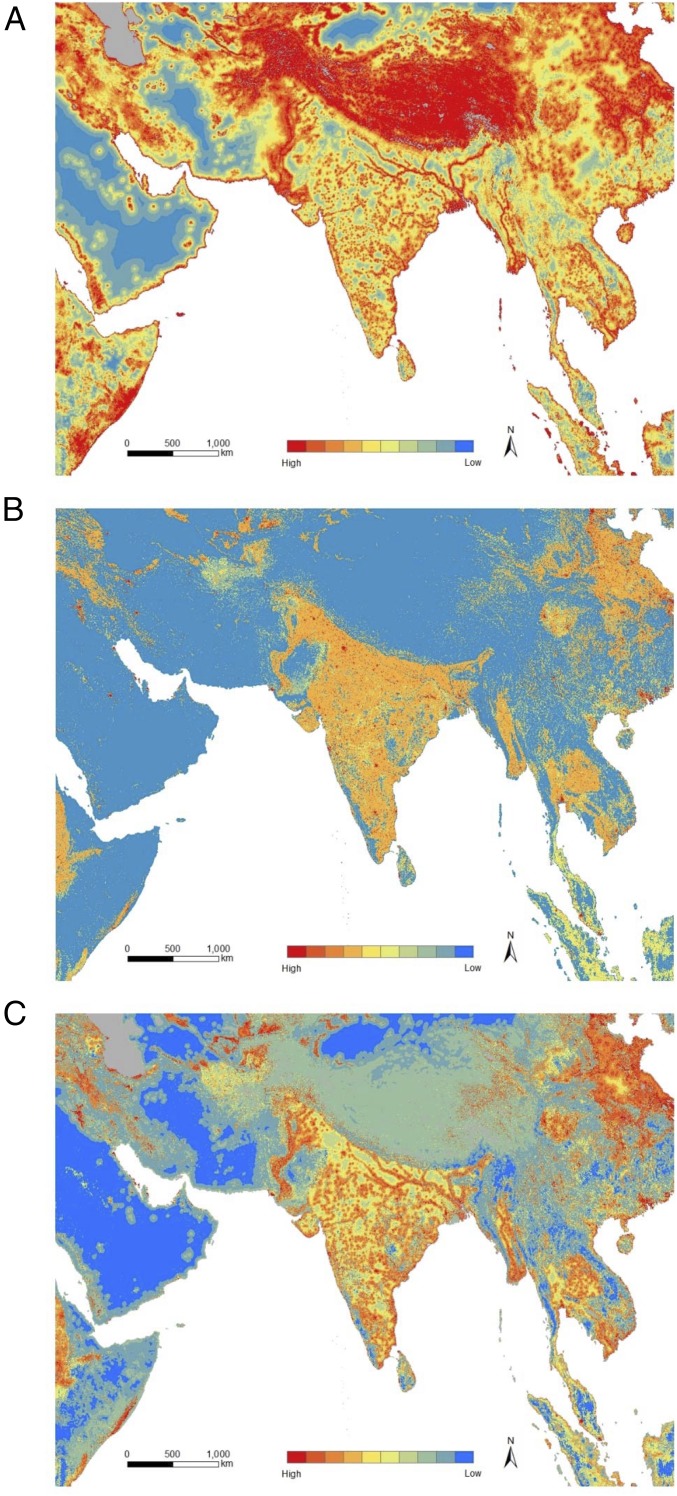
Although habitat fragmentation is often assumed to be a primary driver of extinction, global patterns of fragmentation and its relationship to extinction risk have not been consistently quantified for any major animal taxon. We developed high-resolution habitat fragmentation models and used phylogenetic comparative methods to quantify the effects of habitat fragmentation on the world's terrestrial mammals, including 4,018 species across 26 taxonomic Orders. Results demonstrate that species with more fragmentation are at greater risk of extinction, even after accounting for the effects of key macroecological predictors, such as body size and geographic range size. Species with higher fragmentation had smaller ranges and a lower proportion of high-suitability habitat within their range, and most high-suitability habitat occurred outside of protected areas, further elevating extinction risk. Our models provide a quantitative evaluation of extinction risk assessments for species, allow for identification of emerging threats in species not classified as threatened, and provide maps of global hotspots of fragmentation for the world's terrestrial mammals. Quantification of habitat fragmentation will help guide threat assessment and strategic priorities for global mammal conservation.

Keywords: conservation; extinction risk; habitat fragmentation; mammals.


Conflict of interest statement

The authors declare no conflict of interest.

Figures

Fig. 1.
Fig. 1.
Degree of habitat fragmentation predicts extinction risk for the world’s terrestrial mammals. The fragmentation metric, measuring the amount of core (i.e., interior) habitat distributed within intact high-suitability patches, was ln-transformed and then inverse-coded so high values represent high degrees of fragmentation. Bars represent means and SE (n = 4,018 species). Extinction risk assessed by IUCN Red List threat status. Vulnerable, Endangered, and Critically Endangered species had higher levels of habitat fragmentation compared with Least Concern and Near Threatened species. Similarly, Near Threatened and Data Deficient species had higher levels of fragmentation than Least Concern species (see main text).
Fig. 2.
Fig. 2.
Terrestrial mammals with higher degrees of habitat fragmentation and smaller geographic range sizes have a greater risk of extinction. Each black point represents an individual species, with the number of red line segments corresponding to extinction risk according to IUCN Red List threat status: Least Concern, Near Threatened, Vulnerable, Endangered, and Critically Endangered (see legend within figure). Visually, across the scatter plot of all points, more red represents higher extinction risk. Fragmentation and geographic range size (km2) ln-transformed, and the fragmentation metric then inverse-coded so high values represent high degrees of fragmentation. Vertical and horizontal lines represent means (see also Fig. S1).
Fig. S1.
Fig. S1.
Relationship between habitat fragmentation and geographic range size for world’s terrestrial mammals classified according to IUCN Red List threat status: (A) Least Concern, (B) Near Threatened, (C) Vulnerable, and (D) Endangered (small circles) and Critically Endangered (large circles). Fragmentation and geographic range size (km2) ln-transformed, and the fragmentation metric then inverse coded so high values represent high degrees of fragmentation. Vertical and horizontal lines represent means when pooling among all IUCN threat classes (Fig. 2).
Fig. 3.
Fig. 3.
Degree of habitat fragmentation for the world’s terrestrial mammals. (A) Degree of habitat fragmentation as indexed by the fragmentation metric, measuring the amount of core (i.e., interior) habitat, and (B) degree of anthropogenic habitat fragmentation, calculated by weighting data in A by a recently developed global HM model (Fig. S3). The resulting map identifies regions that have been fragmented by human development specifically, and de-emphasizes regions that are naturally fragmented such as high-elevation areas and landscapes with water bodies interspersed. The color gradient in the legends are the original (A) and weighted (B) fragmentation values binned into deciles. Blue denotes regions with low fragmentation, where mammal species occur in large patches of intact high-suitability core habitat. Red denotes regions with high fragmentation, where mammal species have little core habitat. Fragmentation metrics are spatially quantified by summing the metric at each 300 × 300-m cell for all terrestrial mammal species worldwide.
Fig. S2.
Fig. S2.
Species richness and degree of habitat fragmentation (corrected for species richness) for the world’s terrestrial mammals. (A) Species richness based on extent of suitable habitat. Blue denotes sites with few mammal species, and red denotes sites with the highest species richness. (B) Degree of habitat fragmentation, corrected for species richness by dividing the fragmentation metric within each cell globally by the number of species with suitable habitat within that cell, thus generating an average fragmentation index (Methods). Blue denotes sites with low fragmentation, where terrestrial mammals, averaged across species with suitable habitat at a site, have the most intact high-suitability core habitat. Red denotes sites with high fragmentation, where mammal species on average have little core habitat.
Fig. S3.
Fig. S3.
Weighting (A) the fragmentation model with (B) a recently constructed HM model highlights (C) anthropogenic fragmentation for terrestrial mammals. (A) Degree of habitat fragmentation as indexed by the fragmentation metric, measuring the amount of core (i.e., interior) habitat. (B) The HM model combines the effects of multiple stressors (e.g., urban and agricultural land cover, energy production, nighttime lights, and roads) into an overall score of HM. (C) Weighting fragmentation (A) by HM (B) identifies regions that have been fragmented by human development specifically, and de-emphasizes regions that are naturally fragmented such as high-elevation areas and landscapes with water bodies interspersed. Blue denotes regions with low fragmentation (A and C) or HM (B), and red denotes regions with high fragmentation (A and C) or HM (B). Figure focused on Himalayan area in south-central Asia, given that this region represents the utility of our reweighting approach (see main text).

References

    1. IUCN . IUCN Red List of Threatened Species. IUCN; Gland, Switzerland: 2010.
    1. Schipper J, et al. The status of the world’s land and marine mammals: Diversity, threat, and knowledge. Science. 2008;322:225–230. - PubMed
    1. Wilson MC, et al. Habitat fragmentation and biodiversity conservation: Key findings and future challenges. Landsc Ecol. 2016;31:219–227.
    1. Didham RK, Kapos V, Ewers RM. Rethinking the conceptual foundations of habitat fragmentation research. Oikos. 2012;121:161–170.
    1. Crooks KR, Sanjayan MA. Connectivity Conservation. Cambridge Univ Press; Cambridge, UK: 2006.

LinkOut - more resources