. 2017 Jul 18;114(29):7701-7706.
doi: 10.1073/pnas.1618939114. Epub 2017 Jul 3.

Host-mediated impairment of parasite maturation during blood-stage Plasmodium infection

Affiliations

Host-mediated impairment of parasite maturation during blood-stage Plasmodium infection

David S Khoury et al. Proc Natl Acad Sci U S A. .

Abstract

Severe malaria and associated high parasite burdens occur more frequently in humans lacking robust adaptive immunity to Plasmodium falciparum Nevertheless, the host may partly control blood-stage parasite numbers while adaptive immunity is gradually established. Parasite control has typically been attributed to enhanced removal of parasites by the host, although in vivo quantification of this phenomenon remains challenging. We used a unique in vivo approach to determine the fate of a single cohort of semisynchronous, Plasmodium berghei ANKA- or Plasmodium yoelii 17XNL-parasitized red blood cells (pRBCs) after transfusion into naive or acutely infected mice. As previously shown, acutely infected mice, with ongoing splenic and systemic inflammatory responses, controlled parasite population growth more effectively than naive controls. Surprisingly, however, this was not associated with accelerated removal of pRBCs from circulation. Instead, transfused pRBCs remained in circulation longer in acutely infected mice. Flow cytometric assessment and mathematical modeling of intraerythrocytic parasite development revealed an unexpected and substantial slowing of parasite maturation in acutely infected mice, extending the life cycle from 24 h to 40 h. Importantly, impaired parasite maturation was the major contributor to control of parasite growth in acutely infected mice. Moreover, by performing the same experiments in rag1-/- mice, which lack T and B cells and mount weak inflammatory responses, we revealed that impaired parasite maturation is largely dependent upon the host response to infection. Thus, impairment of parasite maturation represents a host-mediated, immune system-dependent mechanism for limiting parasite population growth during the early stages of an acute blood-stage Plasmodium infection.

Keywords: Plasmodium berghei ANKA; clearance; malaria; mathematical modelling; parasite maturation.


Conflict of interest statement

The authors declare no conflict of interest.

Figures

Fig. 1.
Fig. 1.
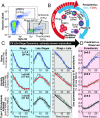
Adoptive transfer protocol. (A) Donor mice infected with PbA-GFPpos had blood taken by cardiac puncture, and the red blood cells (RBCs) were labeled with DDAO-SE, washed, and transfused into groups of recipient mice. The recipient mice either were naive (n = 5) or had an ongoing acute infection with PbA-GFPneg (n = 5). Regular blood samples were taken from the recipient mice after transfusion, and the samples were stained for DNA and RNA before being analyzed by flow cytometry. (B) Representative flow cytometric data collected from one mouse in the naive mouse group, at 1 h and 18 h after transfusion. Forward scatter area and height (FSC-A and FSC-H) were used to isolate singlets, and side scatter area (SSC-A) and FSC-A were used to identify RBCs. The presence of the DDAO-SE stain indicated cells that originated from the donor mice, and GFP expression identified cells that were infected with parasites originating from the donor animals. This allowed identification of the first generation of pRBCs injected into recipient mice (called Gen0) and those cells that had become infected with PbA-GFPpos parasites posttransfusion (called Gen1). We see Gen0 parasites are lost over time, and there is a corresponding increase in the Gen1 parasites. (C) The growth in (PbA-GFPpos, that is, Gen0 + Gen1) parasitemia over 48 h in recipient mice. Growth of parasitemia was lower in acutely infected mice compared with naive mice. (D) However, the difference in the growth in parasitemia did not appear to be accompanied by faster removal of Gen0 parasites themselves. Rather, Gen0 parasites persisted in circulation for longer in acutely infected mice than in naive mice. (E) The rate at which recipient RBCs (DDAO-SEneg) become infected provides a direct measure of the rate of invasion of RBCs.
Fig. S1.
Fig. S1.
Delayed development is not dependent on using GFPpos donor cells. Shown is fitting the rate of maturation of PbA GFPneg donor pRBCs in naive mice and mice infected for 5 d with the transgenic PbA-GFPpos parasite. That is, in this experiment the parasite used to infect donor and recipient has been swapped compared with that in Fig. 2 of the main text. Thus, Gen0 parasites (blue and gray panels) represent DDAO-SEpos and GFPneg parasitized RBCs. These were identified as early ring stages and mature stages (blue panel), using flow cytometry. The dynamics of Gen0 parasites were fitted in the same manner as in Fig. 2 of the main text (with the exception that the age of ring to trophozoite transition, xT, was estimated from the data rather than being fixed). The parasite maturation rate (λ) and the invasion ratio in DDAO-SEpos RBCs (βD) were allowed to vary between groups (fitting estimates: βD=0.10,0.0065, for naive and acutely infected mice, respectively). All other parameters were held constant between naive and acutely infected mice (P0=6.4%, μ=0.33 d, σ=0.70 d, c=0.64/d, and xT=16 h).
Fig. 2.
Fig. 2.
Fitting the dynamics of Gen0 and Gen1 parasites. (A) DNA and RNA content was determined by flow cytometry and used to determine the proportion of Gen0 parasites that were rings, trophozoites, and schizonts at each time point. (B) Illustration of how parasites progress through their asexual life cycle from young stages (rings) to late stages (trophozoites and schizonts), which then rupture and infect other RBCs. (C) The dynamics of Gen0 parasites (GFPpos and DDAO-SEpos) in naive (n = 5) and acutely infected mice (n = 5), as well as mice with antibody-inhibited type-I IFN signaling (IFN-Ineg) (n = 5), were fitted using a mathematical model. The model (solid thick lines) provided a good fit of the dynamics of Gen0 parasites (data: gray circles). All parameters were held to be equivalent between the three groups and estimated from fitting (P0=4.77%, μ=0.32 d, σ=0.26 d, c=0.89 d−1), with the parasite maturation rate (λ), and, in the model reported here, the invasion ratio in donor RBCs was assumed to be nonzero and allowed to vary between groups (fitting estimates βD=0.05,0.44,0.47 for naive, acutely infected, and infected IFN-Ineg mice, respectively), and we estimate a significantly slower parasite maturation rate in acutely infected mice compared with naive mice (P < 0.0001, F test). In the model reported here we fixed the maturation time of parasites in naive mice equal to 24 h. The overall dynamics of Gen0 parasites are shown in the gray column as the sum of rings and late stages. (D) Fitting the data on the parasitemia of GFPpos parasites (Gen0 + Gen1) parameters, using the model and parameter estimates obtained from fitting the Gen0 data in C. The only parameters estimated in fitting these data were the starting concentration of parasites from the donor mice as a percentage of total RBCs for each group of mice (P0=0.11,0.18,0.17) and the invasion ratios in each group of mice, the latter not significantly different between groups (P = 0.16, F test).
Fig. S2.
Fig. S2.
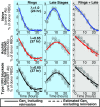
Modeling the contribution of parasite reinvasion. This reproduces Fig. 2 from the main text, but in addition indicates the contribution of parasite reinvasion to the overall Gen0 parasitemia. The estimated Gen0 pRBCs, excluding reinvasion, are indicated by the dashed line.
Fig. S3.
Fig. S3.
Modeling the effect of slower maturation on parasite growth. (A) In a given number of days, a longer parasite maturation cycle means fewer rounds of parasite multiplication can occur. (B) Further, increased time to reach maturity exposes pRBCs to clearance for longer, reducing the number of parasites that survive to maturity. The proportion of parasites surviving to maturity is given by ecλ, where c is the clearance rate and 1/λ is the duration of the parasite life cycle.
Fig. 3.
Fig. 3.
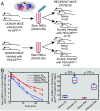
Slower maturation of Py in acute infection. (A) Donor mice, infected with either Py-GFPneg or PbA-GFPneg had blood taken by cardiac puncture, and the red blood cells (RBCs) were labeled with DDAO-SE, washed, and transfused into groups of recipient mice. The recipient mice either were naive or had an ongoing acute infection with PbA-GFPpos. Regular blood samples were taken from the recipient mice after transfusion, and the samples were stained for DNA and RNA before being analyzed by flow cytometry. (B) The percentage of donor Py or PbA Gen0 parasites remaining after transfusion compared with the initial concentration (measured as a percentage of total donor RBCs). Significantly more parasites remained in the circulation of acutely infected mice compared with naive mice after 25 h (***P < 0.0005, one-way ANOVA and contrast analysis).
Fig. S4.
Fig. S4.
Fitting the rate of maturation of Py pRBCs in naive and acutely infected mice. Gen0 parasites (blue and gray panels) represent DDAO-SEpos and GFPneg parasitized RBCs. These were sorted into early ring stages and mature stages (blue panel), using flow cytometry. The dynamics of Gen0 parasites were fitted using a mathematical model allowing the parasite maturation rate (λ) and the invasion ratio in DDAO-SEpos RBCs (βD) to vary between groups (fitting estimates: βD=0.081,0.27, for naive and acutely infected mice given Py donor parasites, respectively). All other parameters were held constant between naive and acutely infected mice (P0=7.0%, μ=0.12 d, σ=0.22 d, c=0.006/d, and γ=3.32).
Fig. 4.
Fig. 4.
Proportion of Gen0 parasites remaining 24 h after transfusion. (A) We see a slight reduction in the proportion of parasites remaining at 24 h in acutely infected mice with blocked IFN-I signaling compared with acutely infected mice that received nonspecific control anitbody. (B) We see some increase in the proportion of Gen0 parasites remaining at 24 h in acutely infected rag1−/− mice, but significantly less than the proportion of parasites remaining in acutely infected WT mice. NS, not significantly different; ***P < 0.0005, **P < 0.005, *P < 0.05.
Fig. 5.
Fig. 5.
Fitting the dynamics of infection in WT and rag1−/− mice. Gen0 were sorted into ring stages and mature stages (blue panel), using flow cytometry. The dynamics of Gen0 parasites were fitted using a mathematical model in which all parameters were the held to be equivalent between the five groups and estimated from fitting (P0= 3.73%, μ=0.30 d, σ=0.50 d, c=0.39 d−1), with the exception of the maturation rate, λ, and the invasion ratio in donor cells (βD=0.073,0.22,0.089,0.14,0.13, for WT naive, WT infected, rag1−/− naive, rag1−/− 5-d infected, and rag1−/− 12-d infected, respectively). We observed that the maturation rate in 5-d infected WT mice was significantly slower than the maturation rate in 5-d infected rag1−/− mice (F test, P < 0.0005). However, there was no significant difference in the maturation rates of parasites in 5-d and 12-d infected rag1−/− or between naive WT and naive rag1−/− mice (P > 0.5 and P = 0.10, respectively). The gray panel shows the overall dynamics of Gen0 parasites (rings + late stages). Extending the model to consider rupture of mature parasites and invasion of RBCs (including the invasion ratio parameter, β), we used the parameter estimates from fitting the Gen0 parasites (blue panel) to predict dynamics of the overall parasitemia (Gen0 + Gen1, red panel). Fitting this extended model to the parasitemia data (red panel), we estimated β=5.6 (not significantly different between groups, all comparisons P > 0.05) and the starting concentration of parasites from donor mice as a percentage of total RBCs for each group (P0=0.042%,0.059%,0.042%,0.054%,0.083%, for WT naive, WT infected, rag1−/− naive, rag1−/− 5-d infected, and rag1−/− 12-d infected, respectively).
Fig. S5.
Fig. S5.
(A and B) IFN-γ (A) and tumor necrosis factor α (TNF-α) (B) levels in WT and rag1−/− mice. The shaded regions indicate the stage of infection of naive and acutely infected mice in our study. There is no detectable elevation in these cytokines over the first 24 h of infection (naive mice), but a dramatic increase in these responses by day 5 of infection (acutely infected mice). Systemic cytokine activity is largely suppressed in rag1−/− mice.

Similar articles

Cited by

References

    1. Douglas AD, et al. Comparison of modeling methods to determine liver-to-blood inocula and parasite multiplication rates during controlled human malaria infection. J Infect Dis. 2013;208:340–345. - PMC - PubMed
    1. Roca-Feltrer A, et al. The age patterns of severe malaria syndromes in sub-Saharan Africa across a range of transmission intensities and seasonality settings. Malar J. 2010;9:282. - PMC - PubMed
    1. Doolan DL, Dobaño C, Baird JK. Acquired immunity to malaria. Clin Microbiol Rev. 2009;22:13–36. - PMC - PubMed
    1. Pinkevych M, et al. Decreased growth rate of P. falciparum blood stage parasitemia with age in a holoendemic population. J Infect Dis. 2014;209:1136–1143. - PMC - PubMed
    1. Molineaux L, Träuble M, Collins WE, Jeffery GM, Dietz K. Malaria therapy reinoculation data suggest individual variation of an innate immune response and independent acquisition of antiparasitic and antitoxic immunities. Trans R Soc Trop Med Hyg. 2002;96:205–209. - PubMed

Publication types

MeSH terms

Supplementary concepts

LinkOut - more resources