

Global priorities for conservation across multiple dimensions of mammalian diversity
- PMID: 28674013
- PMCID: PMC5530698
- DOI: 10.1073/pnas.1706461114
Global priorities for conservation across multiple dimensions of mammalian diversity
Abstract
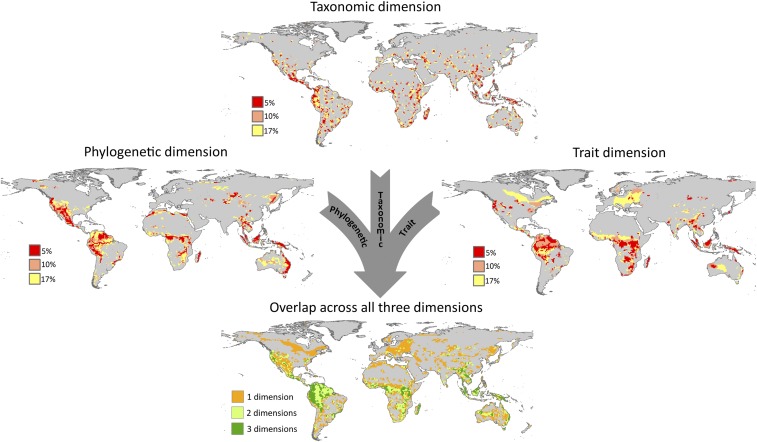
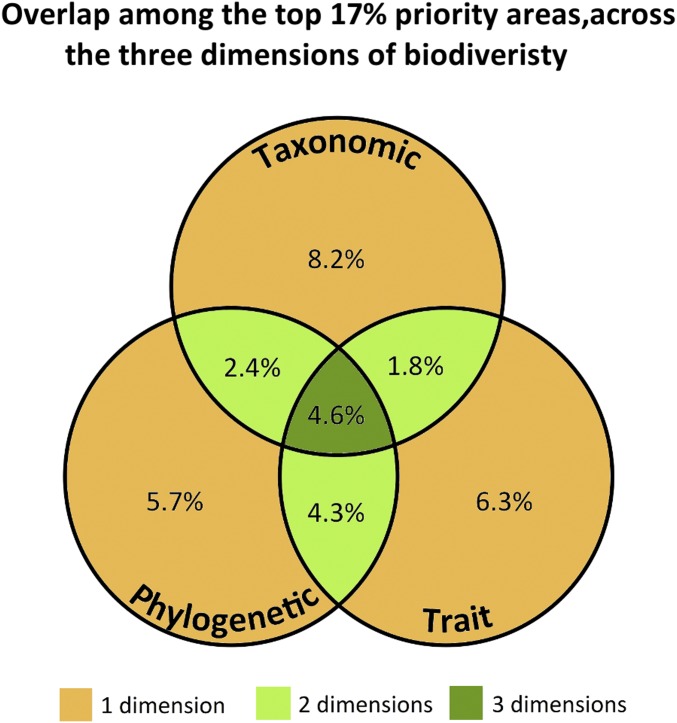
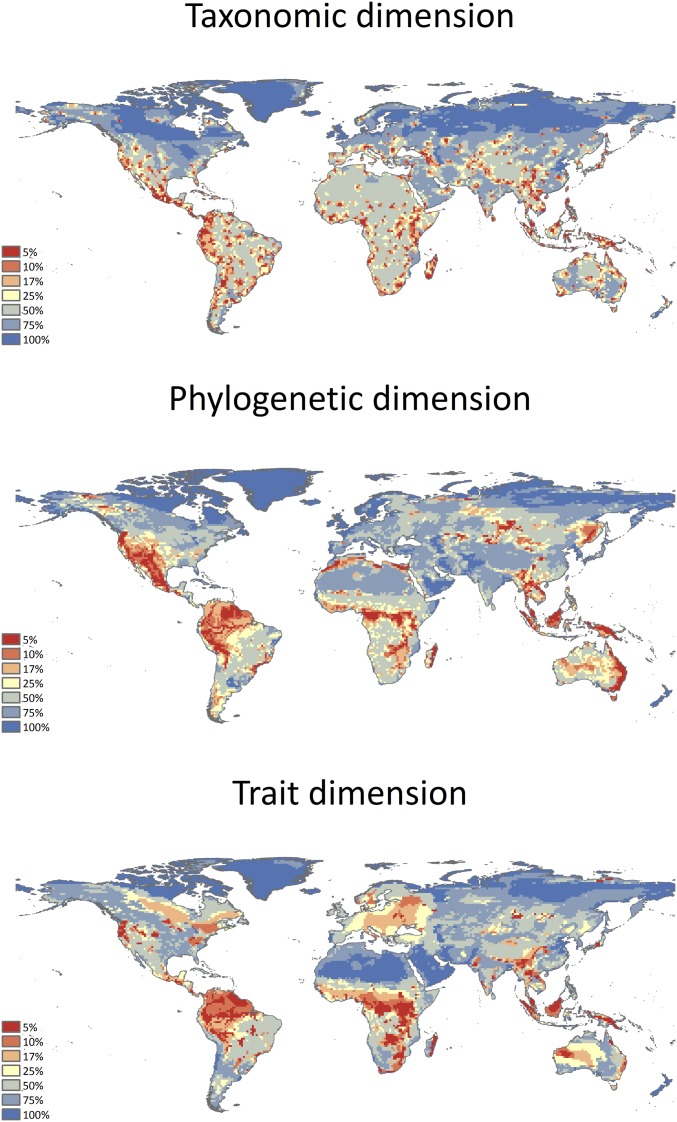
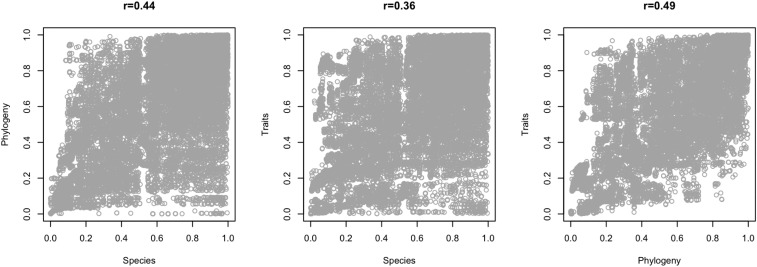
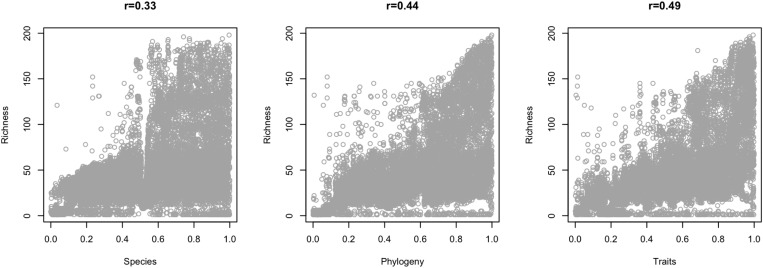
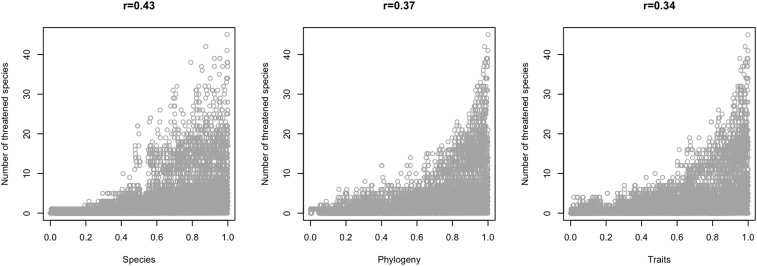
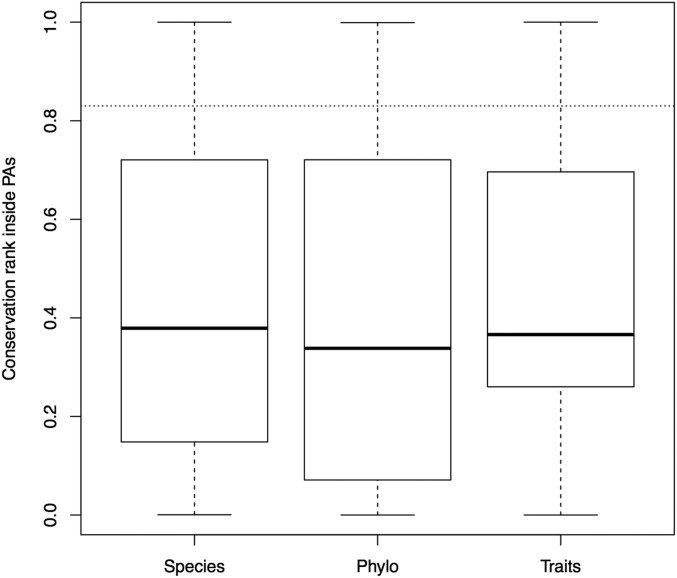
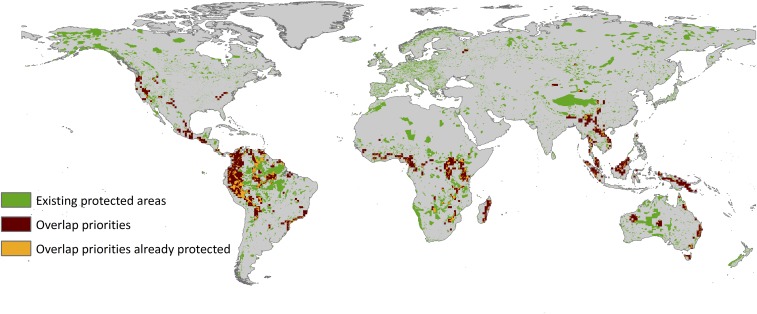
Conservation priorities that are based on species distribution, endemism, and vulnerability may underrepresent biologically unique species as well as their functional roles and evolutionary histories. To ensure that priorities are biologically comprehensive, multiple dimensions of diversity must be considered. Further, understanding how the different dimensions relate to one another spatially is important for conservation prioritization, but the relationship remains poorly understood. Here, we use spatial conservation planning to (i) identify and compare priority regions for global mammal conservation across three key dimensions of biodiversity-taxonomic, phylogenetic, and traits-and (ii) determine the overlap of these regions with the locations of threatened species and existing protected areas. We show that priority areas for mammal conservation exhibit low overlap across the three dimensions, highlighting the need for an integrative approach for biodiversity conservation. Additionally, currently protected areas poorly represent the three dimensions of mammalian biodiversity. We identify areas of high conservation priority among and across the dimensions that should receive special attention for expanding the global protected area network. These high-priority areas, combined with areas of high priority for other taxonomic groups and with social, economic, and political considerations, provide a biological foundation for future conservation planning efforts.
Keywords: complementarity; phylogenetic dimension; spatial conservation prioritization; taxonomic dimension; trait dimension.
Conflict of interest statement
The authors declare no conflict of interest.
Figures
References
-
- Ellis EC, Ramankutty N. Putting people in the map: Anthropogenic biomes of the world. Front Ecol Environ. 2008;6:439–447.
-
- Barnosky AD, et al. Has the Earth’s sixth mass extinction already arrived? Nature. 2011;471:51–57. - PubMed
-
- Pimm SL, et al. The biodiversity of species and their rates of extinction, distribution, and protection. Science. 2014;344:1246752. - PubMed
-
- Vitousek PM, Mooney HA, Lubchenco J, Melillo JM. Human domination of Earth’s ecosystems. Science. 1997;277:494–499.
-
- Convention on Biological Diversity (2010) COP 10 Decision X/2: Strategic Plan for Biodiversity 2011–2020. Available at https://www.cbd.int/decision/cop/?id=12268. Accessed April 15, 2014.
Publication types
MeSH terms
LinkOut - more resources
Full Text Sources
Other Literature Sources
