

Macrophage deficiency of miR-21 promotes apoptosis, plaque necrosis, and vascular inflammation during atherogenesis
- PMID: 28674080
- PMCID: PMC5582411
- DOI: 10.15252/emmm.201607492
Macrophage deficiency of miR-21 promotes apoptosis, plaque necrosis, and vascular inflammation during atherogenesis
Abstract
Atherosclerosis, the major cause of cardiovascular disease, is a chronic inflammatory disease characterized by the accumulation of lipids and inflammatory cells in the artery wall. Aberrant expression of microRNAs has been implicated in the pathophysiological processes underlying the progression of atherosclerosis. Here, we define the contribution of miR-21 in hematopoietic cells during atherogenesis. Interestingly, we found that miR-21 is the most abundant miRNA in macrophages and its absence results in accelerated atherosclerosis, plaque necrosis, and vascular inflammation. miR-21 expression influences foam cell formation, sensitivity to ER-stress-induced apoptosis, and phagocytic clearance capacity. Mechanistically, we discovered that the absence of miR-21 in macrophages increases the expression of the miR-21 target gene, MKK3, promoting the induction of p38-CHOP and JNK signaling. Both pathways enhance macrophage apoptosis and promote the post-translational degradation of ABCG1, a transporter that regulates cholesterol efflux in macrophages. Altogether, these findings reveal a major role for hematopoietic miR-21 in atherogenesis.
Keywords: apoptosis; atherosclerosis; macrophage polarization; miRNA.
© 2017 The Authors. Published under the terms of the CC BY 4.0 license.
Figures
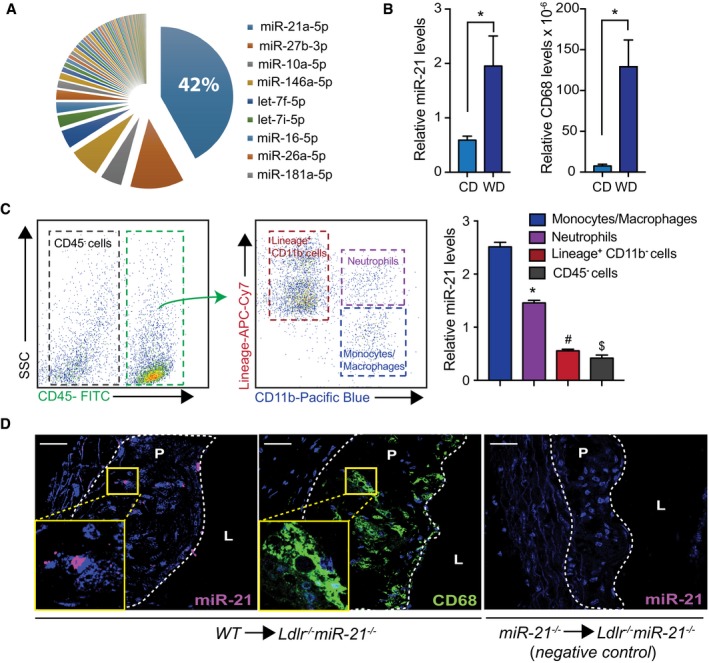
Pie graph representation of miRNAs in mouse BMDMs; top nine most abundant are indicated. Small RNA‐seq analysis of BMDM cellular miRNA reads. Data are expressed as average reads per million (RpM) which are reads mapped to a miRNA per total mapped reads across samples (n = 3).
Relative miR‐21 (left) or CD68 macrophage marker (right) expression in whole aorta of Ldlr −/− mice fed a chow diet (CD) or after feeding Western‐type high‐fat diet (WD) for 12 weeks. miR‐21 levels are normalized to U6, and CD68 levels are normalized to 18S rRNA. Data represent the mean ± SEM (n = 5 per group; *P = 0.048 for mR‐21 expression and *P = 0.01 for CD68 expression). Level of significance was determined using t‐test.
Left, representative contour plots demonstrate the gating scheme for sorting aortic cells. Monocytes/macrophages (CD11b+/lineage−), neutrophils (CD11b+/lineage+), lineage+ cells are CD45+ cells not including monocytes/macrophages and neutrophils, and CD45− cells are aortic non‐leukocytic cells. Right, relative miR‐21 expression levels normalized to U6 of different cell types sorted from whole aortas of Ldlr −/− mice fed a WD for 12 weeks. Data represent the mean ± SEM (n = 3; *,#,$ P < 0.0001, compared to monocytes/macrophages). Level of significance was determined using one?way ANOVA with Bonferroni's post‐test.
Representative in situ hybridization of miR‐21 (left) in atherosclerotic plaques isolated from double‐knockout (DKO) Ldlr −/− miR‐21 −/− mice transplanted with WT bone marrow (BM) and fed a WD for 12 weeks. Image in the middle is a representative staining for CD68 in a consecutive section to the one used for in situ hybridization. The image on the right shows a negative control for detection of miR‐21 in plaque macrophages of DKO mice transplanted with miR‐21 −/− BM. P, plaque. L, lumen. Scale bar, 50 μm.
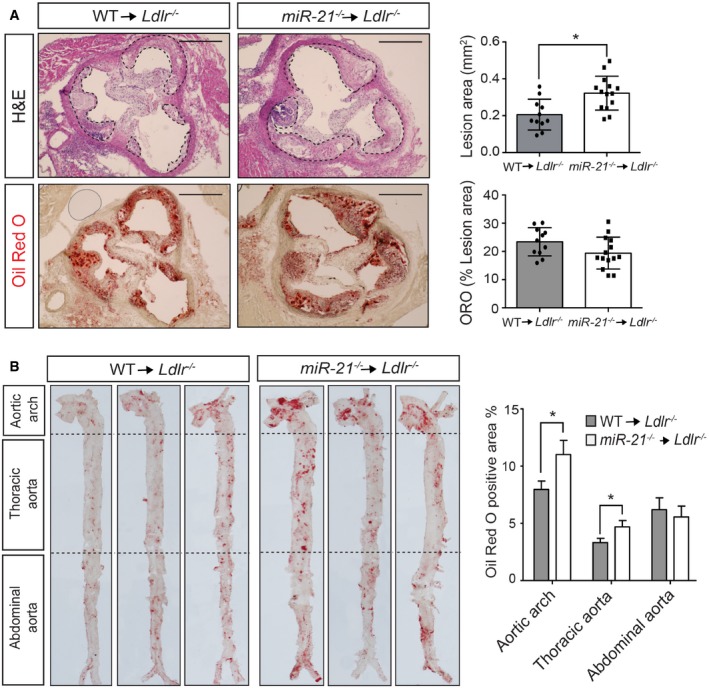
Representative histological analysis of cross sections of the aortic sinus stained with hematoxylin and eosin (H&E) or Oil Red O (ORO) of Ldlr −/− mice transplanted with WT or miR‐21 −/− BM fed for 12 weeks on a WD (left). Right panels are the mean lesion area calculated from H&E or ORO aortic cross sections, respectively. Each dot represents the mean of the quantification of nine sections from an individual animal. Data represent the mean ± SEM (n = 11–14 per group; *P = 0.0051). Scale bars, 400 μm. Level of significance was determined using Mann–Whitney test.
Representative ORO staining of three aortas of Ldlr −/− mice transplanted with WT or miR‐21 −/− BM fed for 12 weeks on a WD (left). Quantification of the ORO‐positive area is shown in the right panel. Data represent the mean ± SEM (n = 9–11 per group; *P = 0.0465 for the aortic arch and *P = 0.0310 for the thoracic aorta). Level of significance was determined using one‐way ANOVA with Bonferroni's post‐test.
- A
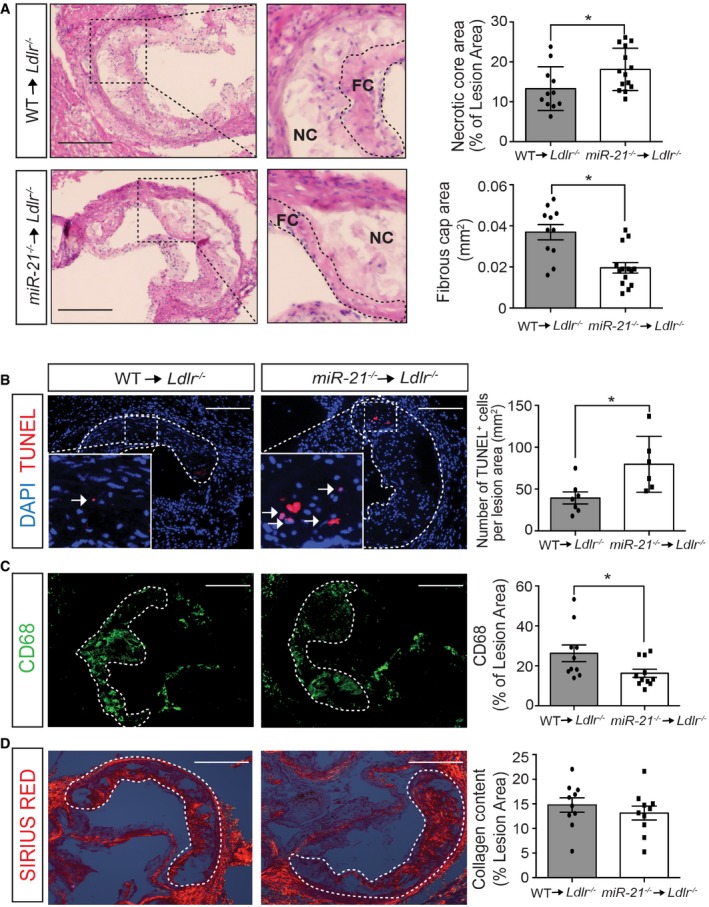
Representative images of aortic root cross sections stained with hematoxylin and eosin (H&E) from Ldlr −/− mice transplanted with WT or miR‐21 −/− BM fed for 12 weeks on WD. Enlarged images shown in the right panels reveal how the necrotic core area was defined for quantification in each section and the area of the fibrous cap that was used to measure the thickness. Dashed lines show the boundary of the developing necrotic core (NC) and fibrous cap (FC), see Materials and Methods section for a detailed description. Quantification of the necrotic core area and fibrous cap is shown in the right panels. Each dot represents the mean of the quantification of three sections from individual animals. Data represent the mean ± SEM (n = 11–14 per group, as indicated; *P = 0.0179 for necrotic core and *P = 0.001 for cap thickness). Scale bars, 200 μm. Level of significance was determined using Mann–Whitney test.
- B–D
Representative cross‐sectional analysis of the aortic root of Ldlr −/− mice transplanted with WT or miR‐21 −/− BM fed for 12 weeks on WD (B) for apoptotic cell analysis via TUNEL staining, (C) macrophage content analysis via immunodetection of CD68, and (D) collagen content analysis via Sirius Red staining. Quantifications are the graphs on the right. Each dot represents the mean of the quantification of three sections from individual animals. Data represent the mean ± SEM (n = 6–11 per group, as indicated). (B) Data are represented as the number of TUNEL‐positive cells per lesion area; *P = 0.014. (C) Data are expressed as the average percentage of CD68‐positive signal per total lesion area; *P = 0.0159. (D) Data are expressed as the average percent collagen per total lesion area. Scale bars, 200 μm. Level of significance was determined using Mann–Whitney test.
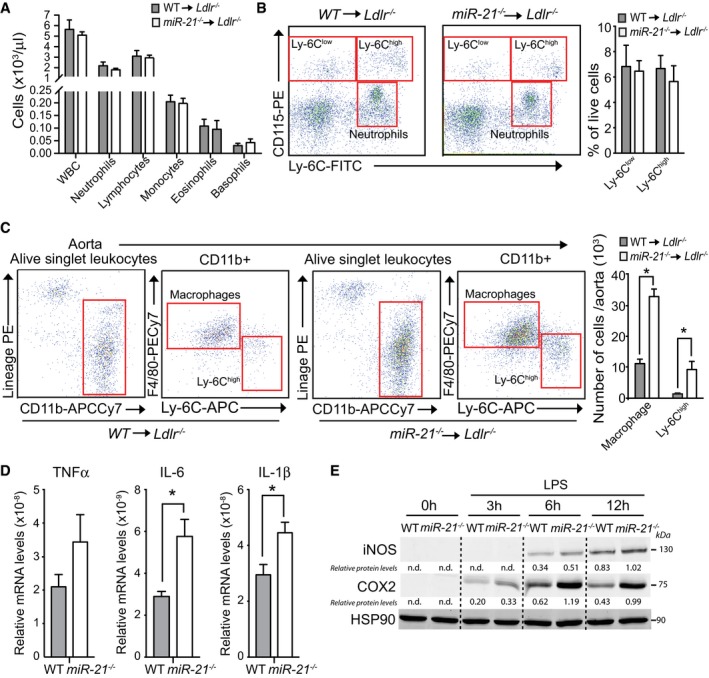
Peripheral blood counts from Ldlr −/− mice transplanted with WT or miR‐21 −/− BM after 12 weeks on WD measured using Hemavet hematology analyzer. Data represent the mean ± SD (n = 11 per group).
Flow cytometry analysis of circulating monocytes and neutrophils from Ldlr −/− mice transplanted with WT or miR‐21 −/− BM fed for 12 weeks on WD. Left, representative dot plots showing gaiting schemes. Right, quantification Ly‐6Clow and Ly‐6Chigh circulating monocytes expressed as % of live cells. Data represent the mean ± SEM (n = 6 for WT and n = 5 for miR‐21 −/−).
Flow cytometry analysis of aortic macrophages and monocytes from Ldlr −/− mice transplanted with WT or miR‐21 −/− BM fed for 12 weeks on a WD. Left, representative dot plots showing gating schemes. Right, quantification of total number of macrophages or Ly‐6Chigh monocytes per aorta. Data represent the mean ± SEM (n = 3 per group; *P = 0.0001 for macrophages and *P = 0.004 for Ly‐6Chigh monocytes). Level of significance was determined using one‐way ANOVA with Bonferroni's post‐test.
Relative TNF‐α, IL‐6, or IL‐1β mRNA expression levels normalized to 18S rRNA of WT or miR‐21 −/− BMDMs treated with LPS (10 ng/ml) for 6 h. Data are mean ± SEM (n = 4 per group; *P = 0.0152 for IL‐6 and *P = 0.0291 for IL‐1β). Level of significance was determined using t‐test.
Western blot analysis of iNOS and COX‐2 in WT or miR‐21 −/− BMDMs treated with LPS (10 ng/ml) for the indicated times. HSP90 was used as a loading control. Representative experiment out of three with similar results. Relative protein levels were determined by band densitometry and are expressed in arbitrary units after correction for HSP90. n.d., not detectable.
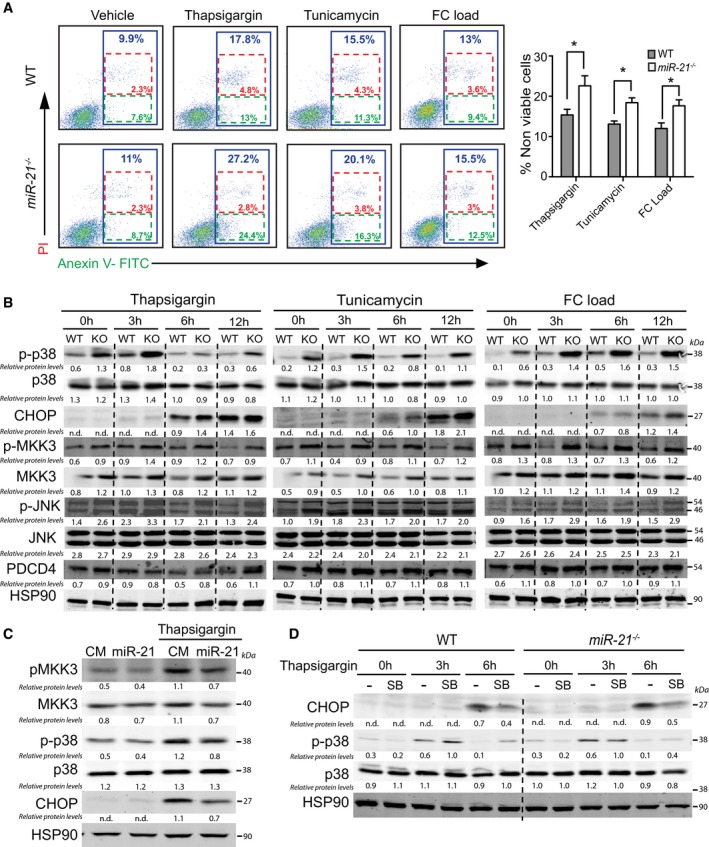
Determination of apoptosis by flow cytometry of peritoneal macrophages isolated from WT or mir‐21 −/− mice treated with thapsigargin (2 μM), tunicamycin (5 μg/ml), or loaded with free cholesterol (FC load) by treatment with Ac‐LDL (120 μg cholesterol/ml) + ACAT inhibitor [Sandoz 58035 (10 μg/ml)] for 24 h. Left, dot plots showing gating schemes of one representative experiment. Right, data are average of % of non‐viable cells (blue), which are the sum of late apoptotic cells (red, annexin V+/PI+) and the early apoptotic cells (green, annexin V+/PI−). Data represent the mean ± SEM (n = 5 for WT and n = 6 for miR‐21 −/−; *P = 0.003 for thapsigargin treatment, *P = 0.04 for tunicamycin treatment, and *P = 0.003 for FC load). Level of significance was determined using one‐way ANOVA with Bonferroni's post‐test.
Western blot analysis of CHOP, p‐p38, p38, p‐JNK, JNK, p‐MKK3, MKK3, and PDCD4 in WT or miR‐21 −/− peritoneal macrophages treated with thapsigargin (2 μM), tunicamycin (5 μg/ml), or FC load with Ac‐LDL (120 μg cholesterol/ml) + ACAT inhibitor (10 μg/ml) for the indicated times. Relative protein levels were determined by band densitometry and are expressed in arbitrary units after correction for HSP90 (loading control). n.d., not detectable.
Western blot analysis of pMKK3, MKK3, p38, p‐p38, and CHOP in WT peritoneal macrophages transfected with control miRNA mimic (CM) or miR‐21 mimic and treated or not with thapsigargin (2 μM) for 6 h. Relative protein levels were determined by band densitometry and are expressed in arbitrary units after correction for HSP90 (loading control). n.d., not detectable.
Western blot analysis of p38, p‐p38, and CHOP expression in WT or miR‐21 −/− peritoneal macrophages treated with SB202190 (10 μM) for 2 h prior treatment with thapsigargin (2 μM) for the indicated times. Relative protein levels were determined by band densitometry and are expressed in arbitrary units after correction for HSP90 (loading control). n.d., not detectable.
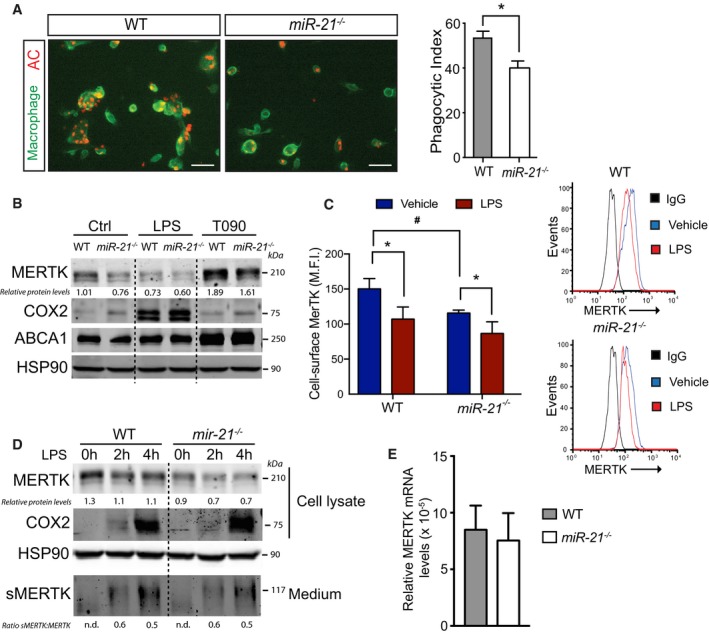
Representative confocal microscopy images (left) of the in vitro engulfment of CellTracker Red labeled apoptotic Jurkat cells by peritoneal macrophages isolated from WT or miR‐21 −/− mice. Right, phagocytosis expressed as phagocytic index, which is the number of apoptotic cells (red) ingested in 1 h per F4/80‐positive macrophage (green) × 100. Data represent the mean ± SEM of the quantification of five images from different fields of duplicate samples (n = 3 per group; *P = 0.017). Scale bars, 100 μm. Level of significance was determined using t‐test.
Representative Western blot analysis of MERTK protein levels in WT or miR‐21 −/− peritoneal macrophages treated with LPS (50 ng/ml; to induce MERTK cleavage) and T0901317 (3 μM; to induce MERTK expression) for 12 h. COX2 and ABCA1 are positive controls for LPS or T0901317 treatment, respectively. Representative experiments out of three with similar results. Relative protein levels were determined by band densitometry and are expressed in arbitrary units after correction for HSP90 (loading control).
Flow cytometry analysis of cell surface MERTK expression in WT and miR‐21 −/− macrophages treated or nor with LPS (50 ng/ml) for 12 h. The results are expressed in terms of geometric mean fluorescence intensity (M.F.I.) after subtracting isotype control (IgG). Histograms of one representative experiment are shown on the right. Data represent the mean ± SEM (n = 3 per group; # P = 0.009 WT vs. miR‐21 −/− macrophages vehicle; *P = 0.0012 vehicle vs. LPS treatment in WT macrophages and *P = 0.032 for vehicle vs. LPS treatment in miR‐21 −/− macrophages). Level of significance was determined using one‐way ANOVA with Bonferroni's post‐test.
Representative Western blot analysis of cellular MERTK and secreted MERTK (sMERTK) in WT and miR‐21 −/− peritoneal macrophages treated with LPS (10 ng/ml) for 2 and 4 h. COX2 is used a positive control for LPS treatment. Representative experiments out of three with similar results. Relative protein levels were determined by band densitometry and are expressed in arbitrary units after correction for HSP90 (loading control). n.d., not detectable.
Relative MERTK mRNA expression levels normalized to 18S rRNA of peritoneal macrophages isolated from WT and miR‐21 −/− mice. Data are mean ± SEM (n = 3 per group).
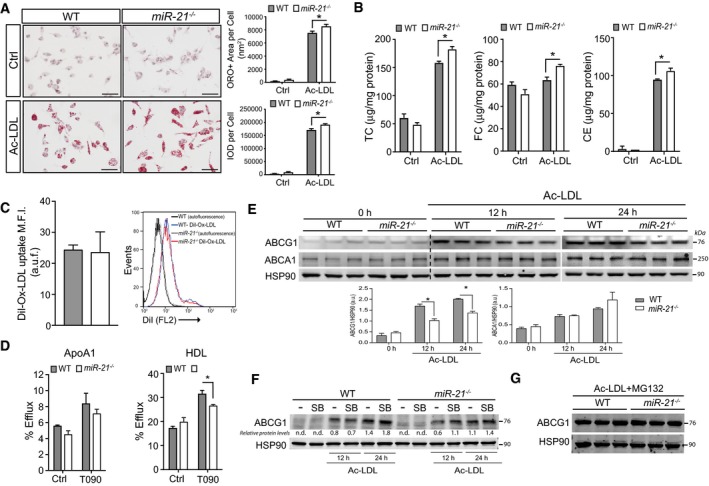
Representative images of WT or miR‐21 −/− peritoneal macrophages incubated with or without Ac‐LDL (120 μg cholesterol/ml) for 24 h and stained with ORO. Quantification of the ORO‐positive area and integrated optical density (IOD) per cell is shown in the right panels. Data represent the mean ± SEM of the quantification of three images from different fields (n = 3 per group; *P = 0.0126 for ORO and *P = 0.0148 for IOD). Scale bars, 100 μm. Level of significance was determined using one‐way ANOVA with Bonferroni's post‐test.
Quantification of total cholesterol (TC) (left panel), free cholesterol (FC) (middle panel), and cholesterol esters (CE) (right panel) corrected by cell protein concentration of WT and miR‐21 −/− peritoneal macrophages incubated as in (A). Data represent the mean ± SEM of duplicates (n = 3 per group; *P = 0.022 for TC, *P = 0.042 for FC and *P = 0.025 for CE). Level of significance was determined using one‐way ANOVA with Bonferroni's post‐test.
Flow cytometry analysis of DiI‐Ox‐LDL uptake in peritoneal macrophages of WT and miR‐21 −/− mice incubated with DiI‐Ox‐LDL (30 μg cholesterol/ml) for 2 h at 37°C. The results are expressed in terms of geometric mean fluorescence intensity (M.F.I.) after subtracting the autofluorescence of cells incubated in the absence of DiI‐Ox‐LDL. Data represent the mean ± SEM of duplicates (n = 3 per group)
Cholesterol efflux to apolipoprotein A1 (ApoA1) and HDL in peritoneal macrophages isolated from WT and miR‐21 −/− mice stimulated with or without T0901317 (T090). Data represent the mean ± SEM of duplicate samples (n = 3 per group; *P = 0.0417). Level of significance was determined using t‐test.
Representative Western blot analysis of ABCG1 and ABCA1 in WT and miR‐21 −/− peritoneal macrophages treated with Ac‐LDL (120 μg/ml) for 12 and 24 h. Samples from three different mice per group are shown. Bottom panels show the quantification of band densitometry values of ABCG1 and ABCA1 protein levels expressed in arbitrary units after correction for HSP90 (loading control). Data represent the mean ± SD from blots above (n = 3 per group as indicated; *P = 0.0002 for 12 h and *P = 0.0003 for 24 h). Level of significance was determined using one?way ANOVA with Bonferroni's post?test.
Representative Western blot analysis of ABCG1 and ABCA1 of WT and miR‐21 −/− peritoneal macrophages treated with Ac‐LDL (120 μg/ml) in the presence of p38 inhibitor (SB202190) for 12 and 24 h. Representative experiments out of three with similar results. Relative protein levels were determined by band densitometry and are expressed in arbitrary units after correction for HSP90 (loading control). n.d., not detectable.
Representative Western blot analysis of ABCG1 in WT and miR‐21 −/− peritoneal macrophages treated with Ac‐LDL (120 μg/ml) in presence of the proteasome inhibitor MG132 (10 μM) for 12 h.
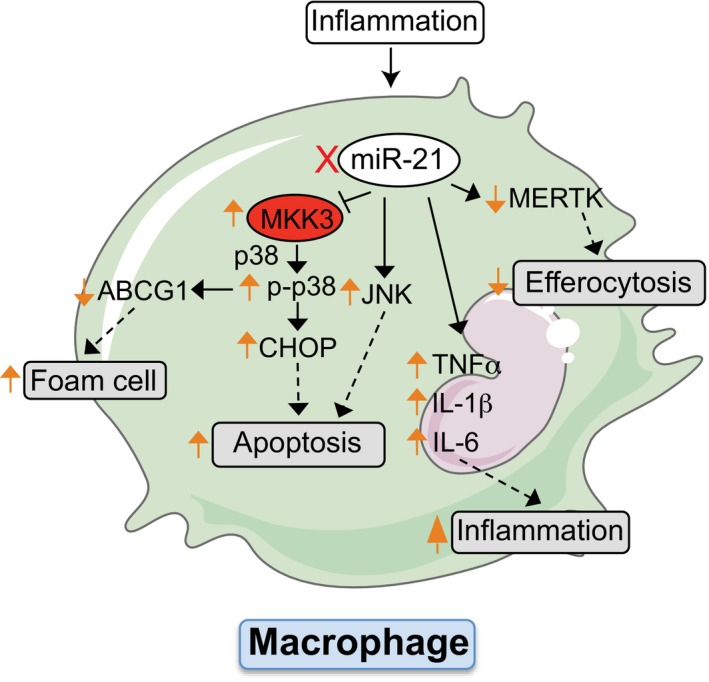
miR‐21 expression influences foam cell formation, sensitivity to ER‐stress‐induced apoptosis, and phagocytic clearance capacity. Absence of miR‐21 in macrophages is pro‐inflammatory, increases the expression of the miR‐21 target gene MKK3, promoting the induction of p38‐CHOP and JNK signaling. Both pathways enhance macrophage apoptosis and promote the post‐translational degradation of ABCG1, a transporter that regulates cholesterol efflux in macrophages.
Similar articles
-
microRNA-33 Regulates Macrophage Autophagy in Atherosclerosis.Arterioscler Thromb Vasc Biol. 2017 Jun;37(6):1058-1067. doi: 10.1161/ATVBAHA.116.308916. Epub 2017 Apr 20. Arterioscler Thromb Vasc Biol. 2017. PMID: 28428217 Free PMC article.
-
Deficiency of ATP-Binding Cassette Transporters A1 and G1 in Endothelial Cells Accelerates Atherosclerosis in Mice.Arterioscler Thromb Vasc Biol. 2016 Jul;36(7):1328-37. doi: 10.1161/ATVBAHA.115.306670. Epub 2016 May 19. Arterioscler Thromb Vasc Biol. 2016. PMID: 27199450 Free PMC article.
-
MicroRNA-23a-5p promotes atherosclerotic plaque progression and vulnerability by repressing ATP-binding cassette transporter A1/G1 in macrophages.J Mol Cell Cardiol. 2018 Oct;123:139-149. doi: 10.1016/j.yjmcc.2018.09.004. Epub 2018 Sep 15. J Mol Cell Cardiol. 2018. PMID: 30227118
-
ATP-binding cassette transporters A1 and G1, HDL metabolism, cholesterol efflux, and inflammation: important targets for the treatment of atherosclerosis.Curr Drug Targets. 2011 May;12(5):647-60. doi: 10.2174/138945011795378522. Curr Drug Targets. 2011. PMID: 21039336 Review.
-
Diverse roles of macrophages in atherosclerosis: from inflammatory biology to biomarker discovery.Mediators Inflamm. 2012;2012:693083. doi: 10.1155/2012/693083. Epub 2012 Apr 11. Mediators Inflamm. 2012. PMID: 22577254 Free PMC article. Review.
Cited by
-
Mucosal microRNAs relate to age and severity of disease in ulcerative colitis.Aging (Albany NY). 2021 Mar 1;13(5):6359-6374. doi: 10.18632/aging.202715. Epub 2021 Mar 1. Aging (Albany NY). 2021. PMID: 33647883 Free PMC article.
-
The Accelerated Progression of Atherosclerosis Correlates with Decreased miR-33a and miR-21 and Increased miR-122 and miR-3064-5p in Circulation and the Liver of ApoE-/- Mice with Streptozocin (STZ)-Induced Type 2 Diabetes.Curr Issues Mol Biol. 2022 Oct 13;44(10):4822-4837. doi: 10.3390/cimb44100328. Curr Issues Mol Biol. 2022. PMID: 36286043 Free PMC article.
-
Trimethylamine n-Oxide (TMAO) Modulates the Expression of Cardiovascular Disease-Related microRNAs and Their Targets.Int J Mol Sci. 2021 Oct 15;22(20):11145. doi: 10.3390/ijms222011145. Int J Mol Sci. 2021. PMID: 34681805 Free PMC article.
-
Pathogenic role of microRNAs in atherosclerotic ischemic stroke: Implications for diagnosis and therapy.Genes Dis. 2021 Jan 12;9(3):682-696. doi: 10.1016/j.gendis.2021.01.001. eCollection 2022 May. Genes Dis. 2021. PMID: 35782982 Free PMC article. Review.
-
MiR-302a Limits Vascular Inflammation by Suppressing Nuclear Factor-κ B Pathway in Endothelial Cells.Front Cell Dev Biol. 2021 Aug 2;9:682574. doi: 10.3389/fcell.2021.682574. eCollection 2021. Front Cell Dev Biol. 2021. PMID: 34409030 Free PMC article.
References
-
- Ambros V (2004) The functions of animal microRNAs. Nature 431: 350–355 - PubMed
-
- Aparicio‐Vergara M, Shiri‐Sverdlov R, Koonen DP, Hofker MH (2012) Bone marrow transplantation as an established approach for understanding the role of macrophages in atherosclerosis and the metabolic syndrome. Curr Opin Lipidol 23: 111–121 - PubMed
-
- Araldi E, Chamorro‐Jorganes A, Fernandez‐Hernando C, Suarez Y (2012) Regulation of endothelial cell functions by macrophage‐derived microRNAs. International Society for Extracellular Vesicles ‐ First Annual Meeting 2012.
MeSH terms
Substances
Grants and funding
LinkOut - more resources
Full Text Sources
Other Literature Sources
Medical
Molecular Biology Databases
Research Materials
Miscellaneous
