

MG132-induced progerin clearance is mediated by autophagy activation and splicing regulation
- PMID: 28674081
- PMCID: PMC5582415
- DOI: 10.15252/emmm.201607315
MG132-induced progerin clearance is mediated by autophagy activation and splicing regulation
Abstract
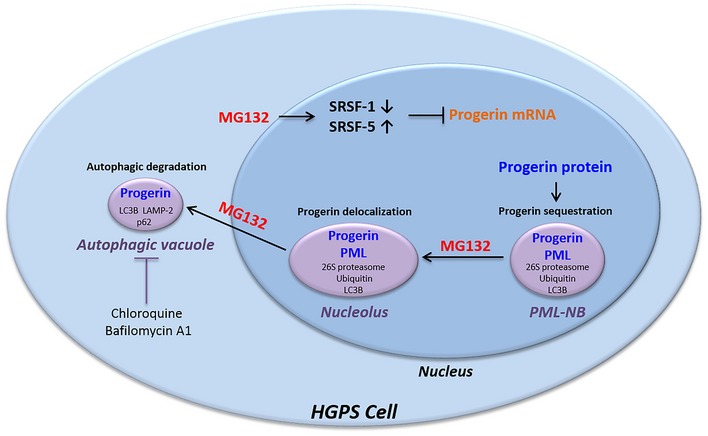
Hutchinson-Gilford progeria syndrome (HGPS) is a lethal premature and accelerated aging disease caused by a de novo point mutation in LMNA encoding A-type lamins. Progerin, a truncated and toxic prelamin A issued from aberrant splicing, accumulates in HGPS cells' nuclei and is a hallmark of the disease. Small amounts of progerin are also produced during normal aging. We show that progerin is sequestered into abnormally shaped promyelocytic nuclear bodies, identified as novel biomarkers in late passage HGPS cell lines. We found that the proteasome inhibitor MG132 induces progerin degradation through macroautophagy and strongly reduces progerin production through downregulation of SRSF-1 and SRSF-5 accumulation, controlling prelamin A mRNA aberrant splicing. MG132 treatment improves cellular HGPS phenotypes. MG132 injection in skeletal muscle of LmnaG609G/G609G mice locally reduces SRSF-1 expression and progerin levels. Altogether, we demonstrate progerin reduction based on MG132 dual action and shed light on a promising class of molecules toward a potential therapy for children with HGPS.
Keywords: MG132; PML‐NBs; autophagy; progerin; splicing.
© 2017 The Authors. Published under the terms of the CC BY 4.0 license.
Figures
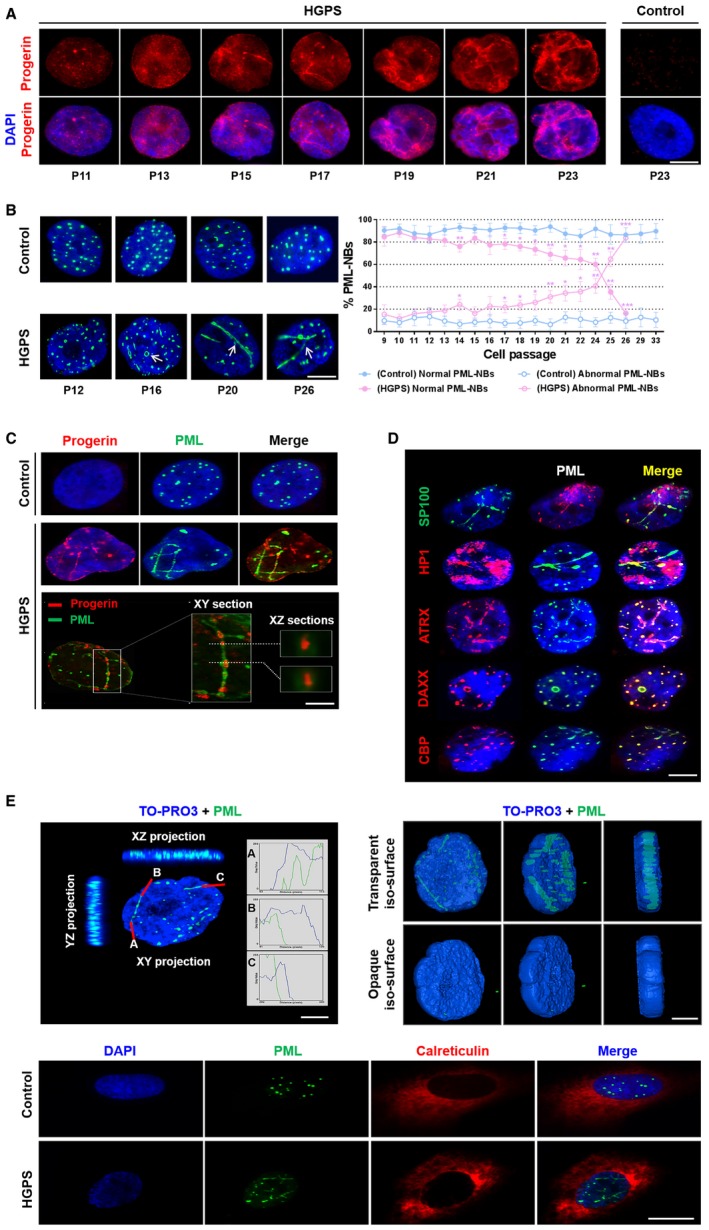
Progerin accumulation in the nuclei of HGPS fibroblasts at successive passages. Immunofluorescence microscopy on primary dermal fibroblasts from an individual with HGPS and a healthy individual (control) stained with DAPI (blue) and progerin (red).
Left panel, labeling of PML in the nucleus of HGPS and control (healthy individual) fibroblasts at successive passages. Right panel, abnormal PML‐NBs (ring‐like and thread‐like: arrows) structures increase in HGPS fibroblasts nuclei vs. control fibroblasts. The experiments were performed on fibroblasts of HGPS patients and healthy subjects matched for age and passage.
Upper panel: Progerin accumulates and localizes in PML‐NBs. Immunofluorescence microscopy on primary dermal fibroblasts from an individual with HGPS and a healthy individual (control) stained with DAPI (blue), progerin (red), and PML (green). Lower panel: confocal images of lateral (xy) and axial (xz) sections of an HGPS fibroblast nucleus. Cells were stained with DAPI (blue), progerin antibody (red), and PML antibody (green).
Ring‐like and thread‐like PML‐NBs in HGPS fibroblast nuclei contain the main components of conventional PML‐NBs including PML, SP100, HP‐1, ATRX, DAXX, and CBP.
Left panel: confocal cross section in XY and XZ of HGPS fibroblast nucleus stained with TO‐PRO3 (blue) and PML (green); curves are the intensities plots along the red lines. Right panel: visualization of rotated planes of a 3D‐volume view of PML (green) within the nucleus. The blue nuclear counterstain TOPRO‐3 is rendered more or less transparent. Confocal stacks were recreated in three dimensions with Imaris software. Lower panel: immunofluorescence microscopy on primary dermal fibroblasts from an individual with HGPS and a healthy individual (control) stained with DAPI (blue), PML (green), and endoplasmic reticulum marker calreticulin (red).
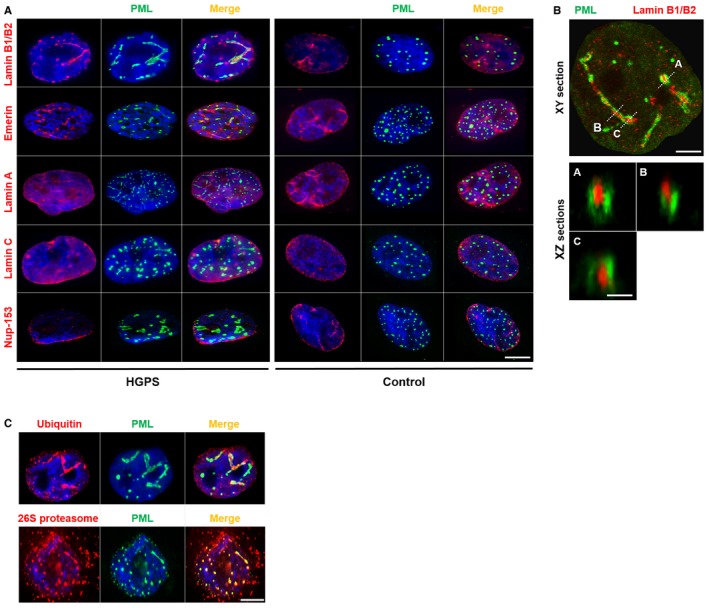
Colocalization of lamin B1/B2 and emerin with PML in HGPS fibroblast nuclei. Immunofluorescence images of primary dermal fibroblasts from an individual with HGPS (left panels) and a healthy individual (control) (right panels) stained with DAPI (blue), PML (green), and antibodies to lamin B1/B2, emerin, lamin A, lamin C, and Nup‐153 (red). The merged images are shown. There are no PML‐NBs labeling with lamin A (red), lamin C (red), or Nup‐153 (red) antibodies. Scale bar, 5 μm.
Confocal images of lateral (XY) sections (upper panel; scale bar, 2 μm) and axial (XZ) sections along the A, B, and C axis (lower panels; scale bar, 400 nm) of an HGPS fibroblast nucleus stained with lamin B1/B2 (red) and PML (green) antibodies.
Immunofluorescence images showing colocalization of ubiquitin (red) and 26S proteasome (red) with PML (green) in the nucleus of HGPS fibroblasts. Nucleus was labeled with DAPI (blue). The merged images are shown. Scale bar, 5 μm.
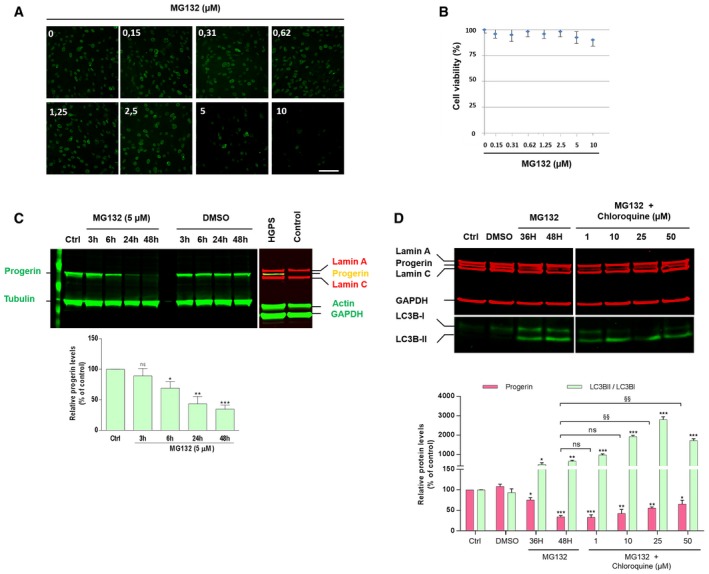
Immunofluorescence images of HGPS fibroblasts treated with MG132 for 24 h and stained for progerin (green). Scale bar, 40 μm. (n = 4).
HGPS fibroblasts viability was measured at 24 h post‐treatment with MG132 at the indicated concentrations using CellTiter‐Glo Luminescent Cell Viability Assay. Results are reported as viability percentage of MG132‐treated cells relative to DMSO‐treated cells. (n = 4).
MG132 treatment results in a decrease of progerin levels, (Ctrl: untreated HGPS cells). Lower panel, progerin expression levels in MG132‐treated cells were normalized to those treated with DMSO and to tubulin values (loading control). Fibroblasts isolated from biopsies of healthy subjects (Control) were used as negative controls to validate the specificity of anti‐progerin antibody. (n = 5).
Upper panels, lamin A/C, progerin, GAPDH, LC3B‐I and LC3B‐II expression, in whole lysates from HGPS fibroblasts untreated (Ctrl) or treated with DMSO (48 h), 5 μM MG132 (36 and 48 h), or both 5 μM MG132 and chloroquine added simultaneously (48 h). The images were cropped from the same Western blot experiment. Lower panels, progerin expression levels (relative to DMSO‐treated cells: “*”, or relative to MG132‐treated cells for 48H: “§”, and LC3BII/LC3BI ratios relative to DMSO‐treated cells: “*”) were normalized to GAPDH values. (n = 5).
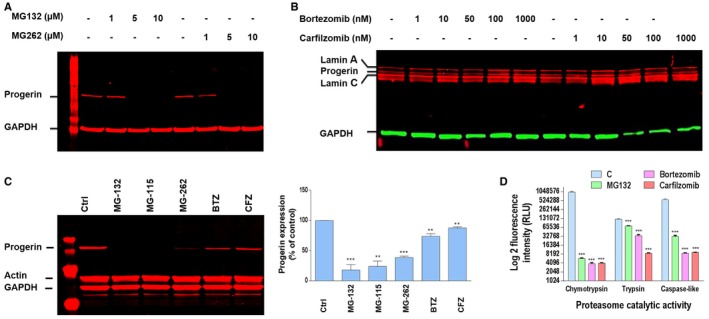
MG132 and MG262 induced clearance of progerin. A representative Western blotting experiment in whole lysates of HGPS fibroblasts showing progerin and GAPDH expression in MG132‐ and MG262‐treated HGPS cells at the indicated concentrations relative to DMSO‐treated (−) cells for 24 h (Control). (n = 5).
Western blotting evaluation of lamin A/C, progerin and GAPDH in whole lysates from HGPS fibroblasts untreated (−) or treated with bortezomib or carfilzomib for 24 h at indicated concentrations. (n = 4).
Left panels: progerin, actin, and GAPDH expressions in whole lysates from HGPS fibroblasts treated for 48 h with DMSO (Ctrl) or 5 μM MG132, MG115, MG262, bortezomib (BTZ), or carfilzomib (CFZ). Right panels: Progerin expression levels relative to DMSO‐treated cells were normalized to actin values using ImageJ software. (n = 6).
Proteasome activities (trypsin: Z‐LRR aminoluciferin, chymotrypsin: Suc‐LLVY aminoluciferin and caspase‐like: Z‐nLPnLD‐aminoluciferin) in HGPS fibroblasts upon 24 h MG132, bortezomib, or carfilzomib treatment, used at 5 μM. (n = 4).
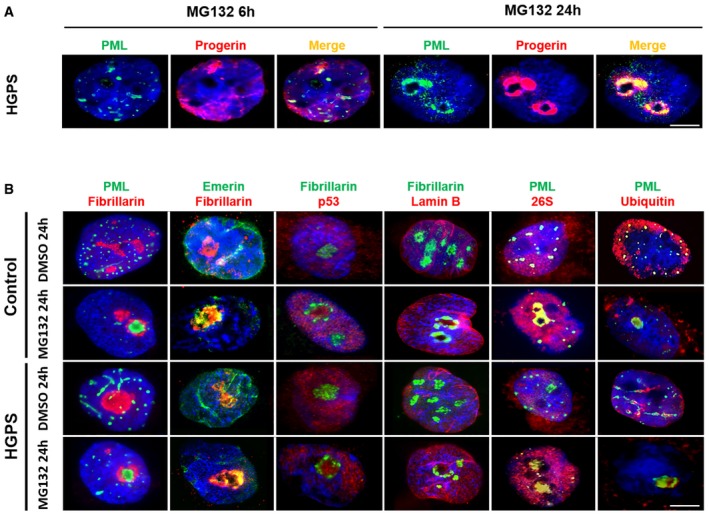
Subnuclear distribution of progerin (red) and PML (green) after MG132 treatment of HGPS fibroblasts. Cells cultured with 5 μM MG132 for 24 h show staining of progerin and PML in intranuclear foci.
MG132 induces the translocation of PML (green), emerin (green), p53 (red), 26S proteasome subunit (red), and ubiquitin (red) into nucleoli of HGPS and control fibroblasts cultured in the presence of 5 μM MG132 for 24 h (relative to DMSO‐treated cells: control). Nucleoli were labeled with fibrillarin antibodies and nuclei with DAPI (blue). The merged images are shown.
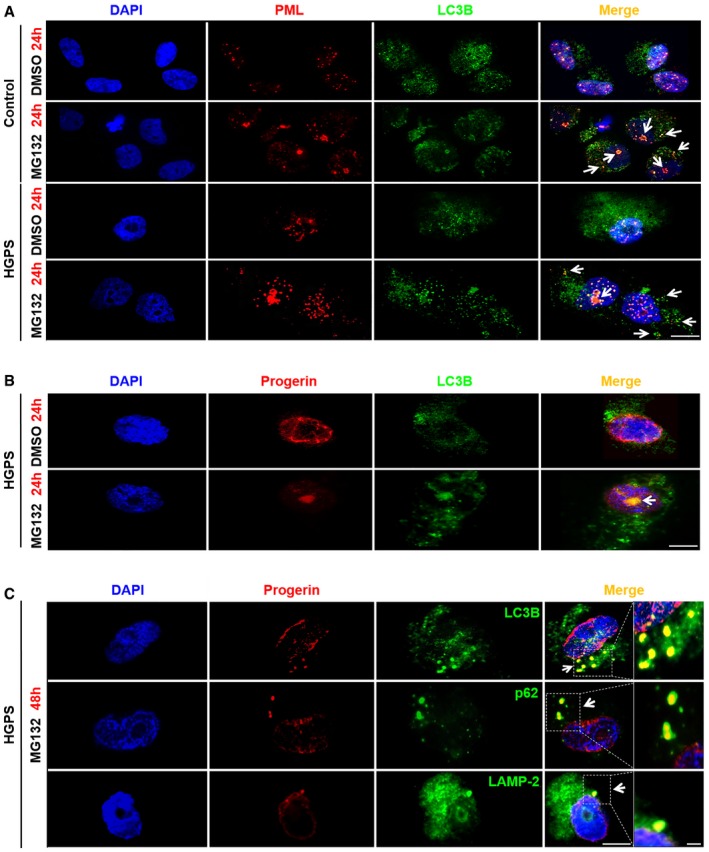
Immunofluorescence staining of PML (red) and LC3B (green) in HGPS and control fibroblasts both treated with MG132 (5 μM) or DMSO (control) for 24 h. Nucleolar and cytoplasmic colocalization of LC3B with PML are shown (arrows). Scale bar, 10 μm.
Nucleolar progerin (red) and LC3B (green) accumulation (arrows) in HGPS fibroblasts upon 5 μM MG132 treatment. Scale bar, 5 μm.
Progerin (red) accumulated in LC3B (green), p62 (green) and LAMP‐2 (green) positive cytoplasmic vesicles (arrows) after 48 h MG132 (5 μM) exposure of HGPS fibroblasts. Scale bar, 5 μm. The magnifications are shown; scale bar, 200 nm.
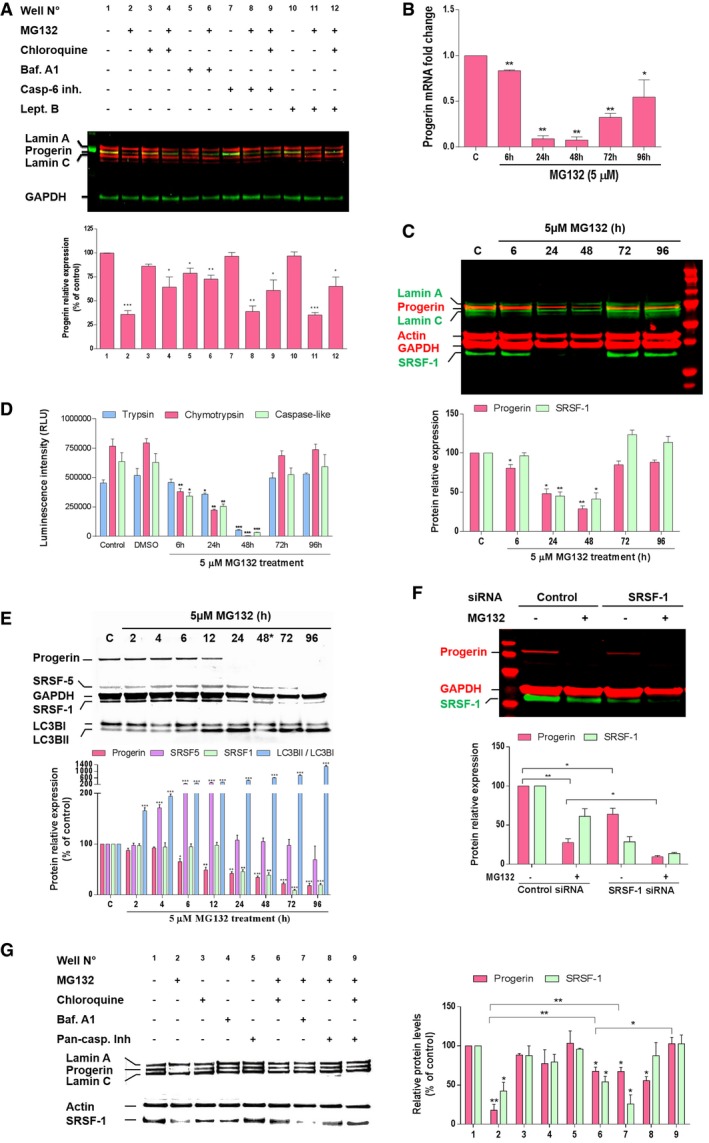
Upper panel, lamin A/C, progerin, and GAPDH expressions in whole lysates from HGPS fibroblasts treated for 48 h either with DMSO control (−) or with (+) the indicated drug (s) (MG132 (5 μM), chloroquine (50 μM), bafilomycin A1 (Baf. A1) (100 nM), caspase‐6 inhibitor (Casp‐6 inh.) (50 μM) or leptomycin B (Lept. B) (20 ng/ml). Lower panels, progerin expression levels in drug (s)‐treated cells relative to DMSO‐treated cells (well no. 1) were normalized to GAPDH values. (n = 5).
Downregulation of progerin transcripts in response to MG132. Quantitative real‐time PCR analyses of progerin mRNA levels in HGPS fibroblasts treated with 5 μM MG132 relative to DMSO‐treated cells (Control: “C”). (n = 3).
A representative Western blotting experiment in whole lysates of HGPS fibroblasts showing progerin, lamin A, lamin C, actin, GAPDH and SRSF‐1 expression in MG132‐treated HGPS cells up to 96 h and relative to DMSO‐treated cells “C”. Urea was used to lyse cells. (n = 4).
Proteasome activities in HGPS fibroblasts treated with 5 μM MG132 relative to DMSO‐treated cells, (Control: untreated cells). (n = 3).
MG132‐mediated SRSF‐5 accumulation and SRSF‐1 downregulation correlate with progerin clearance. A representative Western blotting experiment in whole lysates of HGPS fibroblasts showing progerin, SRSF‐5, GAPDH, SRSF‐1, LC3BI, and LC3BII expression in MG132‐treated HGPS cells up to 96 h and relative to DMSO‐treated cells (Control: “C”). The medium was replaced with new drug every 48 h. Urea was used to lyse cells. (n = 4).
siRNA inactivation of SRSF‐1 reduces progerin levels in HGPS fibroblasts. HGPS fibroblasts were transfected with control siRNA or with siRNA specific for SRSF‐1 and 48 h later cells were treated for 24 h with DMSO control (−) or with (+) MG132 (5 μM). (n = 3).
Left panels, caspase‐mediated downregulation of SRSF‐1, in addition to autophagy, contribute to progerin clearance. Western blotting evaluation of lamin A/C, progerin, actin and SRSF‐1 in whole lysates from HGPS fibroblasts treated for 48 h either with DMSO control (−) or with (+) the indicated drug (s) [MG132 (5 μM), chloroquine (50 μM), bafilomycin A1 (100 nM) or pan‐caspase inhibitor (50 μM)]. Rihgt panels, progerin and SRSF‐1 expression levels relative to DMSO‐treated cells (well no. 1) were normalized to actin values using ImageJ software. (n = 6).
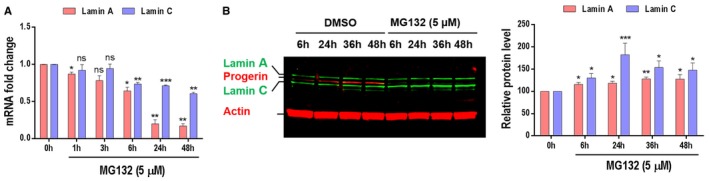
MG132 reduces lamin A and lamin C transcript levels. Quantitative real‐time PCR analyses of lamin A and lamin C mRNA levels in HGPS fibroblasts treated with 5 μM MG132.
Both lamin A and lamin C protein levels are increased upon HGPS fibroblasts treatment with 5 μM MG132.
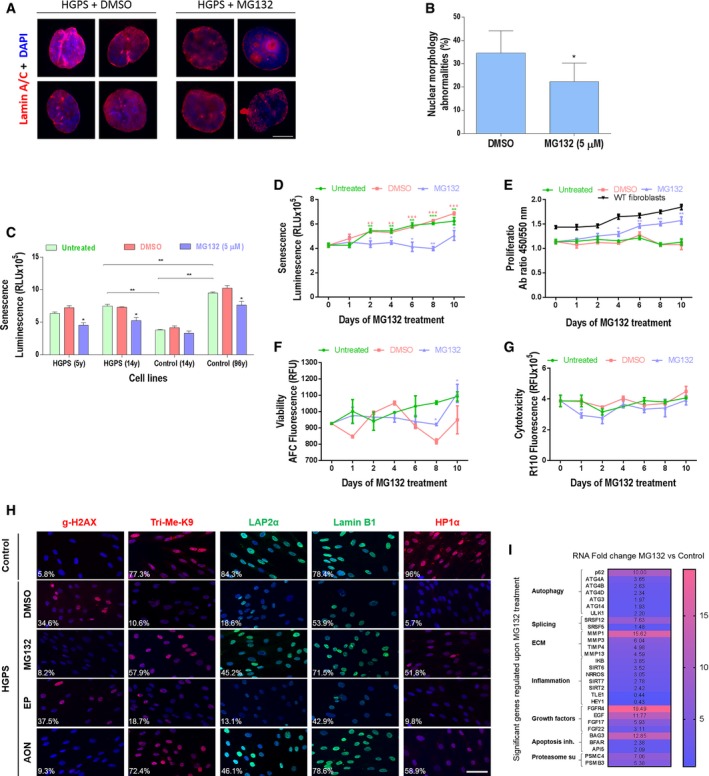
- A
Immunofluorescence images of HGPS fibroblasts cultured with DMEM medium containing 5 μM MG132, or the same volume of vehicle (DMSO, 0.025% v/v) for 48 h and stained for lamin A/C (red) and DAPI (blue). Scale bar, 5 μm. (n = 3).
- B
The percentage of normal nuclei (nuclei with a smooth oval shape) and abnormal nuclei (nuclei with blebs, irregular shape, or multiple folds) was calculated using the Nuclear Irregularity Index (NII) plugin of the ImageJ software (version 1.6.0, NIH, USA). At least 200 fibroblast nuclei were randomly selected for each cell line. A representative image and the mean values of three different experiments are shown.
- C
Senescence rate in 2 HGPS fibroblasts and two control fibroblasts treated with 5 μM MG132 for 48 h relative to DMSO‐treated cells. Each experiment was performed on cells at the same passage level. Senescence is determined as relative light units (RLU). (n = 4).
- D–G
HGPS fibroblasts were untreated, vehicle control (DMSO) or 5 μM MG132 treated up to 10 days. The medium was replaced with new drug every 48 h. (n = 3). Senescence rate in HGPS fibroblasts (untreated or DMSO‐treated cells at each time point vs. Day 0. MG132‐treated cells vs. DMSO‐treated cells at each time point) (D). Cell proliferation rate based on the incorporation of bromodeoxyuridine (BrdU) into the DNA was expressed as absorbance OD450‐550. (MG132‐treated cells vs. DMSO‐treated cells at each time point). Proliferation rates in normal fibroblasts (WT fibroblasts) are presented (E). Viability (MG132‐treated cells vs. DMSO‐treated cells at each time point) (F) and cytotoxicity (MG132‐treated cells vs. DMSO‐treated cells at each time point) (G).
- H
Immunofluorescence microscopy on primary dermal fibroblasts from a healthy individual (control) and an individual with HGPS treated with DMSO (MG132 vehicle control), 5 μM MG132, 20 μM control scrambled morpholino antisense oligonucleotides (Scr‐AON), or 20 μM specific AON for 10 days. The medium was replaced with new drug every 48 h. Cells were stained with DAPI (blue) and antibodies to the indicated proteins. The percentage of positive staining is indicated, at least 200 fibroblast nuclei were randomly selected for each cell line (n = 3) and examined using ImageJ software. Scale bar, 40 μm.
- I
Heatmap of RNAseq data (ArrayExpress accession number: E‐MTAB‐5807) from HGPS fibroblasts treated with DMSO (vehicle control) or with 5 μM MG132 for 6 h. This analysis represents the fold change, in MG132‐treated relative to DMSO‐treated HGPS fibroblasts, of the most characteristic transcripts of the cellular HGPS phenotype. (n = 2).
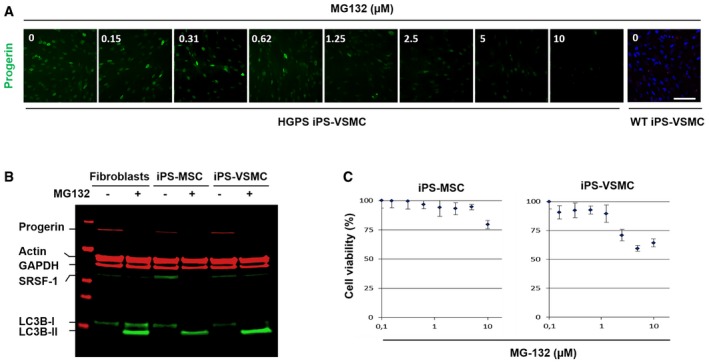
Immunofluorescence images of HGPS‐derived iPS‐VSMC and WT‐derived iPS‐VSMC cultured with DMEM medium containing either indicated MG132 concentrations (0.15, 0.31, 0.62, 1.25, 2.5, 5, and 10 μM) or DMSO (0) for 24 h and stained for progerin (green). Scale bar, 40 μm. (n = 3).
MG132 treatment resulted in a decrease of progerin levels. A representative Western blotting experiment in whole lysates showing progerin, actin, GAPDH, SRSF‐1, LC3B‐I, and LC3B‐II expression in 5 μM MG132‐treated HGPS fibroblasts (+), 2.5 μM MG132‐treated HGPS iPS‐MSC (+), and 1.2 μM MG132‐treated HGPS iPS‐VSMC (+) for 24 h, relative to DMSO‐treated cells (−). (n = 4).
HGPS‐derived iPS‐MSC and iPS‐VSMC viability was measured at 24 h post‐treatment with MG132 at the indicated concentrations using CellTiter‐Glo Luminescent Cell Viability Assay. Results are reported as viability percentage of MG132‐treated cells relative to DMSO‐treated cells. Results are expressed as mean ± SEM (n = 4).
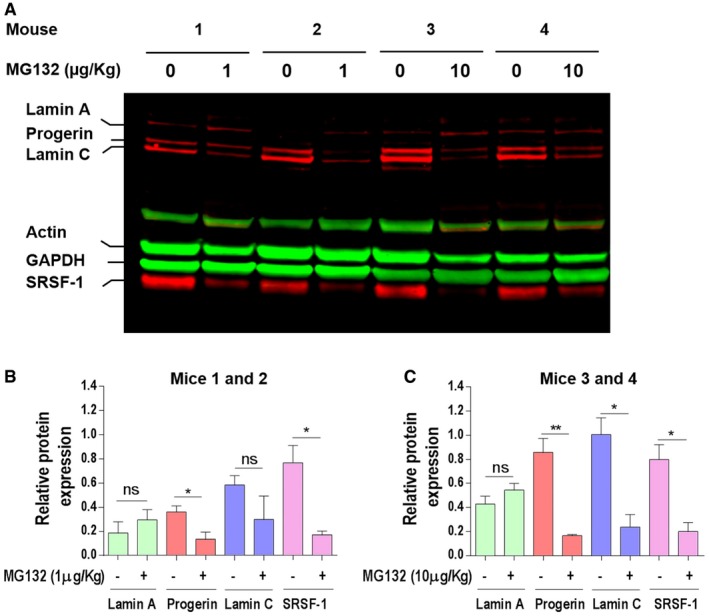
Western blotting evaluation of lamin A/C, progerin, actin, GAPDH, and SRSF‐1 in gastrocnemius muscle lysate of Lmna G609G/G609G mice treated with 1 μg/kg (mice 1 and 2) or 10 μg/kg (mice 3 and 4) MG132. The results are shown as four successive pairs (left: DMSO‐treated (0 μg/kg) and right: MG132‐treated (1 or 10 μg/kg) muscles, each corresponding to a single mouse).
Lamin A‐, progerin‐, lamin C‐, and SRSF‐1‐specific bands, corresponding to DMSO‐treated left muscle (−) and 1 μg/kg MG132‐treated right muscle (+), were quantified by ImageJ software and their expression levels were normalized to GAPDH values.
Lamin A‐, progerin‐, lamin C‐, and SRSF‐1‐specific bands, corresponding to DMSO‐treated left muscle (−) and 10 μg/kg MG132‐treated right muscle (+), were quantified by ImageJ software, and their expression levels were normalized to GAPDH values.
References
Publication types
MeSH terms
Substances
LinkOut - more resources
Full Text Sources
Other Literature Sources
Molecular Biology Databases
Research Materials
Miscellaneous
