. 2017 Aug 2;37(31):7373-7389.
doi: 10.1523/JNEUROSCI.0569-17.2017. Epub 2017 Jul 3.

Retinotopic Organization of Scene Areas in Macaque Inferior Temporal Cortex

Affiliations

Retinotopic Organization of Scene Areas in Macaque Inferior Temporal Cortex

Michael J Arcaro et al. J Neurosci. .

Abstract

Primates have specialized domains in inferior temporal (IT) cortex that are responsive to particular image categories. Though IT traditionally has been regarded as lacking retinotopy, several recent studies in monkeys have shown that retinotopic maps extend to face patches along the lower bank of the superior temporal sulcus (STS) and neighboring regions of IT cortex. Here, we used fMRI to map the retinotopic organization of medial ventral temporal cortex in four monkeys (2 male and 2 female). We confirm the presence of visual field maps within and around the lower bank of the STS and extend these prior findings to scene-selective cortex in the ventral-most regions of IT. Within the occipitotemporal sulcus (OTS), we identified two retinotopic areas, OTS1 and OTS2. The polar angle representation of OTS2 was a mirror reversal of the OTS1 representation. These regions contained representations of the contralateral periphery and were selectively active for scene versus face, body, or object images. The extent of this retinotopy parallels that in humans and shows that the organization of the scene network is preserved across primate species. In addition retinotopic maps were identified in dorsal extrastriate, posterior parietal, and frontal cortex as well as the thalamus, including both the lateral geniculate nucleus and pulvinar. Together, it appears that most, if not all, of the macaque visual system contains organized representations of visual space.SIGNIFICANCE STATEMENT Primates have specialized domains in inferior temporal (IT) cortex that are responsive to particular image categories. Though retinotopic maps are considered a fundamental organizing principle of posterior visual cortex, IT traditionally has been regarded as lacking retinotopy. Recent imaging studies have demonstrated the presence of several visual field maps within the lateral IT. Using neuroimaging, we found multiple representations of visual space within ventral IT cortex of macaques that included scene-selective cortex. Scene domains were biased toward the peripheral visual field. These data demonstrate the prevalence of visual field maps throughout the primate visual system, including late stages in the ventral visual hierarchy, and support the idea that domains representing different categories are biased toward different parts of the visual field.

Keywords: IT; macaque; organization; retinotopy; scenes; vision.


Figures

Figure 1.
Figure 1.
Retinotopic maps across occipital, temporal, and parietal cortex as well as the thalamus. Top, Polar angle and (bottom) eccentricity maps are shown on inflated surface views of lateral cortex in the left hemispheres and sagittal and coronal volume slices of monkeys M1 and M2. Full volume slices are accompanied with zoomed in views of the ventral thalamus. The color code indicates the phase of the fMRI response and therefore the preferred region of the visual field. For polar angle maps, only contralateral representations are displayed. Data were threshold at p < 0.0001. Black solid lines mark meridian borders between visual field maps. Black dashed line in volume image highlights a region of the posterior thalamus that includes the LGN and pulvinar. Plus, minus, and square symbols mark upper, lower, and horizontal meridians. The purple line encompasses the MT cluster (comprising MT, MST, FST, and LST; Kolster et al., 2009).
Figure 2.
Figure 2.
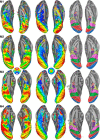
Retinotopic maps in ventral temporal cortex of four monkeys. Left, Polar angle and (middle) eccentricity maps are shown in inflated surface views of ventral occipital and temporal cortex. The color code indicates the phase of the fMRI response and therefore the preferred region of the visual field. For polar angle maps, only contralateral representations are displayed. Data were threshold at p < 0.0001. Black solid lines mark the borders between visual field maps. In M1, the locations of six reversals in polar angle progression corresponding to areal borders are labeled. Right, Areal extent for newly defined areas OTS1 and OTS2 as well as the ventral halves of V1, V2, V3, V4, V4A, and the entire area of PITv are shown. Plus, minus, and square symbols mark upper, lower, and horizontal meridians. Red and green arrows in the polar angle maps indicate partial surface projections of LGN and pulvinar visual maps, respectively.
Figure 3.
Figure 3.
Analysis of topographic organization within OTS1 and OTS2. a, Polar angle maps for OTS1 and OTS2 in the RH of monkey M4. Top, Red, green, and blue dotted lines correspond to the ROIs along the lateral, midline, and medial borders of OTS1 and OTS2. Bottom, Polar angle phase values plotted as a function of cortical distance (relative to posterior border of OTS1) for all three linear ROIs and the average (black line). b, Polar angle phase plot for the right and left hemispheres of individual monkeys (averaged across all three lines within each hemisphere as illustrated in a and the group average (black line). Phase values were interpolated into a common space, which allowed for averaging across monkeys. The smooth progression of phase values within the OTS maps and the phase reversals at the area boundaries were apparent in the group average as well as in the individual subjects. Corresponding wedge stimulus position illustrated next to color bar for RH and LH hemispheres.
Figure 4.
Figure 4.
Anatomical localization of retinotopic maps in volume. The location of OTS1 and OTS2 in (left) axial, (middle) sagittal, and (right) coronal views. Mean EPI images from the polar angle experiment are presented aligned to anatomical volumes for the sagittal view. For M1 and M2, EPI images were registered to native anatomical volumes. For M3 and M4, EPI images were registered to the F99 standard template volume. OTS1 and OTS2 as well as V1, V2, V3, V4, V4A, MT, MST, FST, V4t, OTd, PITd, and PITv are illustrated in three coronal slices in each monkey. Enlarged views of the left hemisphere of ventral temporal cortex are presented in the coronal slices, evenly spaced at 2 mm. Centroids and the shared border of OTS1 and OTS2 fall within these slices, but their area (as well as most other visual maps shown) extends beyond these coronal images. Slices are orientated anterior (left) to posterior (right). Thin blue and red lines in all three views correspond to segmentations of the pial and white matter. Green lines in axial and sagittal slices correspond to the location of coronal slices.
Figure 5.
Figure 5.
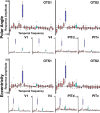
Response amplitude as a function of temporal frequency in OTS1 and OTS2. Box plots of response amplitude converted to percentage signal change for (top) polar angle and (bottom) eccentricity experiments. The response at the stimulus frequency (dark blue) was significantly greater than the response at all other frequencies. Light blue bars correspond to the first harmonic. For comparison, response amplitudes for areas V1, V4, PITd, and PITv are also shown. Median (black line), interquartiles (whiskers), and 1.5× interquartile outliers (red cross).
Figure 6.
Figure 6.
Visual field coverage of OTS1 and OTS2. Individual monkey and group scatter plots of the central 10° visual field representation based on polar angle and eccentricity maps threshold at p < 0.0001. Each point represents the preferred visual field location of a voxel that had significant responses in both polar angle and eccentricity. Red and blue points indicate data from the RH and LH hemispheres, respectively. Inner solid black line denotes 6° along the eccentricity axis. OTS1 and 2 show a strong contralateral and peripheral preference. Composite visual field coverage is plotted for OTS1 and OTS2 as well as for areas V1, V4, V4A, and PITv for comparison. For composite data, triangles are presented angled at one of four cardinal orientations for each monkey.
Figure 7.
Figure 7.
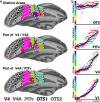
Alternative models of ventral temporal retinotopic organization. a, Top, Our proposed model of the retinotopic organization of macaque ventral temporal cortex includes distinct visual field maps for OTS1/2. Black arrow indicates axis of eccentricity map. Middle, An alternative model where OTS1 is part of V4 and OTS2 is part of V4A. Bottom, A second alternative model where OTS1 is part of V4A and OTS2 is part of PITv. Red x's mark inconsistencies in polar angle representations between V4/V4A and the OTS maps. Light gray lines illustrate iso-eccentricity lines. The purple line marks the peripheral-most representations for V1–V4, V4A, and PITv. See Figure 1 for other conventions. b, Eccentricity phase plots from lateral to medial cortex for areas OTS(1 and 2), PITv, V4, and V1. Eccentricity representations progressed from foveal space to the periphery for V1, V4, and PITv. Further medial, there was no clear progression of eccentricity within OTS and the eccentricity line remained flat. Colored dots correspond to individual monkeys (hemispheres plotted separately) and black solid lines correspond to the average across monkeys.
Figure 8.
Figure 8.
Category selectivity in OTS1 and OTS2. a, Scene selectivity overlapped with OTS1 and OTS2. This region showed strong selectivity for scenes versus (top) faces and (bottom) objects. The location of scene selectivity with respect to anatomy and the OTS1 and OTS2 visual field maps was consistent in all four monkeys (p < 0.0001, FDR-corrected). b, Mean responses within OTS1/2 were significantly larger for scene stimuli versus all other categories (p < 0.01). d-primes for distinguishing scenes from objects was significant larger in OTS1/2 than visual areas V1, V4, PITd, and PITv (p < 0.05).
Figure 9.
Figure 9.
Retinotopic organization of dorsal scene-selective region. a, Group average (n = 4) polar angle and eccentricity maps of dorsal occipital and posterior parietal cortex. See Figure 1 for conventions. b, A region within the dorsal prelunate that overlapped with retinotopic areas DP and V3 showed stronger responses to scenes versus all other categories. This area mainly represented contralateral peripheral space. Our mapping also revealed extensive retinotopic organization throughout the inferior bank of the intraparietal sulcus beyond what has been previously described (Arcaro et al., 2011). Anterior to the map previously referred to as LIPvt (Arcaro et al., 2011; here referred to as LIP1), we identified another map of contralateral space, referred to as LIP2. Anterior to this map, we saw additional representations of contralateral visual space suggesting the existence of another map, which we tentatively label LIP3.
Figure 10.
Figure 10.
Group average maps. a, Group average (n = 4) polar angle and eccentricity maps of ventral occipital and temporal cortex. The topographic organization was consistent with individual subject maps indicating that there was good agreement in the representation of visual space across monkeys. Data were threshold at p < 0.001 in each subject. Voxels that were significant in at least 3/4 individuals are displayed. See Figure 1 for conventions. b, Group average (n = 4) map for the contrast of responses to scenes and objects (p < 0.0001, FDR-corrected). Consistent with the individual subject maps, the group average scene-selective region LPP overlapped with OTS1/2. c, Overlap of retinotopic maps with the Lewis and Van Essen atlas (Lewis and Van Essen, 2000; Van Essen et al., 2012). OTS1/2 overlapped with area TF as well as medial portions of V4v and VOT.
Figure 11.
Figure 11.
Functional organization of human ventral temporal organization. a, Visual field maps PHC1/2 in humans have a similar topographic organization to OTS1/2 in monkey. Similar to OTS1/2, PHC1/2 represent peripheral contralateral space and selectively respond to scene images compared with other image categories. b, Comparison of ventral temporal functional organization in humans and macaques. A focal region selectively responsive to scenes versus objects overlaps with PHC1/2 similar to OTS1/2. Face- and body-selective regions in the human are located lateral to both OTS and PHC in monkeys and humans, respectively. Human data originally published by Arcaro et al. (2009).

References

    1. Afraz SR, Kiani R, Esteky H (2006) Microstimulation of inferotemporal cortex influences face categorization. Nature 442:692–695. 10.1038/nature04982 - DOI - PubMed
    1. Aguirre GK, Detre JA, Alsop DC, D'Esposito M (1996) The parahippocampus subserves topographical learning in man. Cereb Cortex 6:823–829. 10.1093/cercor/6.6.823 - DOI - PubMed
    1. Aguirre GK, Zarahn E, D'Esposito M (1998) Neural components of topographical representation. Proc Natl Acad Sci U S A 95:839–846. 10.1073/pnas.95.3.839 - DOI - PMC - PubMed
    1. Angelucci A, Rosa MG (2015) Resolving the organization of the third tier visual cortex in primates: a hypothesis-based approach. Vis Neurosci 32:E010. 10.1017/S0952523815000073 - DOI - PMC - PubMed
    1. Arcaro MJ, Kastner S (2015) Topographic organization of areas V3 and V4 and its relation to supra-areal organization of the primate visual system. Vis Neurosci 32:E014. 10.1017/S0952523815000115 - DOI - PMC - PubMed

Publication types

LinkOut - more resources