. 2017 Jul 3;7(1):4552.
doi: 10.1038/s41598-017-04689-3.

Quantitative Protein Topography Measurements by High Resolution Hydroxyl Radical Protein Footprinting Enable Accurate Molecular Model Selection

Affiliations

Quantitative Protein Topography Measurements by High Resolution Hydroxyl Radical Protein Footprinting Enable Accurate Molecular Model Selection

Boer Xie et al. Sci Rep. .

Abstract

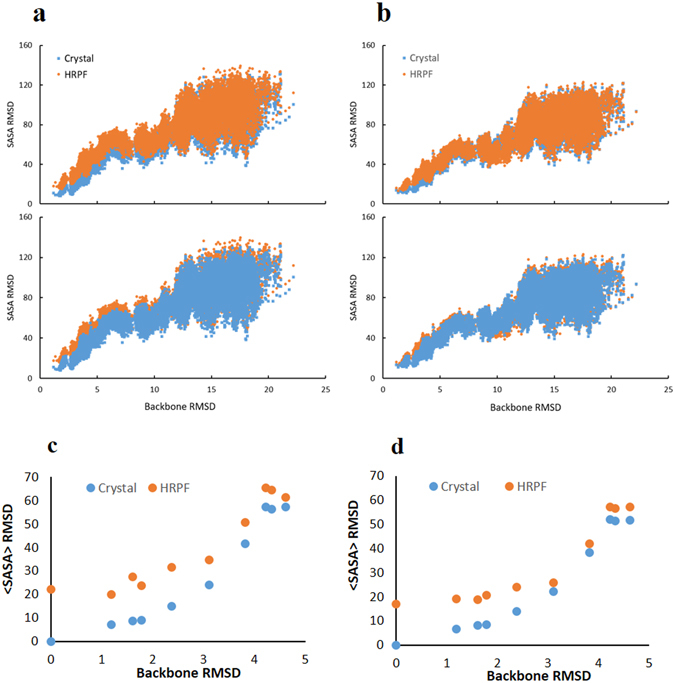
We report an integrated workflow that allows mass spectrometry-based high-resolution hydroxyl radical protein footprinting (HR-HRPF) measurements to accurately measure the absolute average solvent accessible surface area (<SASA>) of amino acid side chains. This approach is based on application of multi-point HR-HRPF, electron-transfer dissociation (ETD) tandem MS (MS/MS) acquisition, measurement of effective radical doses by radical dosimetry, and proper normalization of the inherent reactivity of the amino acids. The accuracy of the resulting <SASA> measurements was tested by using well-characterized protein models. Moreover, we demonstrated the ability to use <SASA> measurements from HR-HRPF to differentiate molecular models of high accuracy (<3 Å backbone RMSD) from models of lower accuracy (>4 Å backbone RMSD). The ability of <SASA> data from HR-HRPF to differentiate molecular model quality was found to be comparable to that of <SASA> data obtained from X-ray crystal structures, indicating the accuracy and utility of HR-HRPF for evaluating the accuracy of computational models.


Conflict of interest statement

J.S.S. discloses a significant ownership share of Photochem Technologies, LLC, a small company that is active in the area of hydroxyl radical protein footprinting instrument design.

Figures

Figure 1
Figure 1
Representative HR-HRPF regressions for five residues from lysozyme after multi-point HR-HRPF performed in triplicate (mean ± SD plotted; error bars obscured by data markers). The levels of oxidation vary linearly with the available hydroxyl radical dose, measured by adenine dosimetry; reactivity is measured as the slope of the regression. Orange - Trp123, light blue – Trp111, yellow – Phe34, dark blue – Asn37, and green – Asn39.
Figure 2
Figure 2
Correlation plots of NPF (the slope of the linear regression divided by the inherent reactivity of the free amino acid) vs. fractional ( of the amino acid in the folded structure divided by the for that same amino acid in a Gly-X-Gly tripeptide) for amino acids identified to be oxidized from lysozyme (green square) and myoglobin (red circle) sample for: (a) amino acids with high inherent reactivity (>10x more reactive than Pro); (b) amino acids with moderate inherent reactivity (4–10x more reactive than Pro); (c) amino acids with poor inherent reactivity (<4x more reactive than Pro). All data shown from triplicate experiments using mean ± SD plotted for all data (x-axis error bars), with fractional <SASA> from MD simulation of the protein structure ± SD from the MD trajectory (y-axis error bars).
Figure 3
Figure 3
Correlation between multi-point HR-HRPF data by comparing reactivities in denatured form (SlopeD) versus native form (SlopeN) and fractional <SASA> between native (<SASA>N) and denatured (<SASA>D) based on all non-sulfur containing residues from myoglobin (circles) and lysozyme (squares). Each data point represents an oxidized amino acid identified in both denatured and native sample. Red – highly reactive residues; Blue – moderately reactive residues; and Green – poorly reactive residues. Data shown from triplicate experiments using mean ± SD plotted for all data (x-axis error bars), with fractional <SASA> from MD simulation of the protein structure ± SD from the MD trajectory (y-axis error bars).
Figure 4
Figure 4
Evaluation of prediction regression models for HR-HRPF data. (a) Predictive model based on multi-point HR-HRPF data from all non-sulfur containing residues with k/ kp > 4 from myoglobin based on NPFs calculated from multi-point HR-HRPF data. (b) Comparison between predicted lysozyme <SASA> by HR-HRPF and actual lysozyme <SASA> from MD simulation based on NPFs calculated from multi-point HR-HRPF data. Correlation coefficient calculated against a regression where y = x. (c) Predictive model based on multi-point HR-HRPF data from all non-sulfur containing residues from myoglobin based on the ratio of reactivities (native: denatured). (d) Comparison between predicted lysozyme <SASA> by HRPF and actual lysozyme <SASA> from MD simulation based on the ratio of reactivities (native: denatured). Mean ± SD plotted for all data from triplicate experiments.
Figure 5
Figure 5
Evaluation of HR-HRPF derived for assessing the quality of protein structural models. (a) SASA RMSD calculated on structure obtained from an unfolding MD simulation of lysozyme using crystallographic <SASA> and HR-HRPF derived <SASA> based on free amino acids normalization approach using only highly reactive amino acids as reference; (b) SASA RMSD calculated on structure obtained from an unfolding MD simulation of lysozyme using crystallographic <SASA> and HR-HRPF derived <SASA> based on the ratio of reactivity (native: denatured) approach as reference. Top and bottom panels of (a and b) show the same data, with different data series in front (c) SASA RMSD obtained from homology modeling analysis of lysozyme using crystallographic <SASA> and HR-HRPF derived <SASA> based on free amino acids normalization approach as reference. (d) SASA RMSD obtained from homology modeling analysis of lysozyme using crystallographic <SASA> and HR-HRPF derived <SASA> based on the ratio of reactivity (native: denatured) approach as reference.

References

    1. Takamoto K, Chance MR. Radiolytic protein footprinting with mass spectrometry to probe the structure of macromolecular complexes. Annual review of biophysics and biomolecular structure. 2006;35:251–276. doi: 10.1146/annurev.biophys.35.040405.102050. - DOI - PubMed
    1. Xu GH, Chance MR. Hydroxyl radical-mediated modification of proteins as probes for structural proteomics. Chem Rev. 2007;107:3514–3543. doi: 10.1021/cr0682047. - DOI - PubMed
    1. Aebersold R, Mann M. Mass spectrometry-based proteomics. Nature. 2003;422:198–207. doi: 10.1038/nature01511. - DOI - PubMed
    1. Konermann L, Tong X, Pan Y. Protein structure and dynamics studied by mass spectrometry: H/D exchange, hydroxyl radical labeling, and related approaches. J Mass Spectrom. 2008;43:1021–1036. doi: 10.1002/jms.1435. - DOI - PubMed
    1. Schermann SM, Simmons DA, Konermann L. Mass spectrometry-based approaches to protein-ligand interactions. Expert Rev Proteomics. 2005;2:475–485. doi: 10.1586/14789450.2.4.475. - DOI - PubMed

Publication types

LinkOut - more resources